Grundlæggende statistik
| Institutionelle aktier (lange) | 28.526.504 - 107,24% (ex 13D/G) - change of -7,49MM shares -20,80% MRQ |
| Institutionel værdi (lang) | $ 8.447.741 USD ($1000) |
Institutionelt ejerskab og aktionærer
Saia, Inc. (US:SAIA) har 432 institutionelle ejere og aktionærer, der har indsendt 13D/G- eller 13F-formularer til Securities Exchange Commission (SEC). Disse institutioner har i alt 28,526,504 aktier. Største aktionærer omfatter Vanguard Group Inc, BlackRock, Inc., Alliancebernstein L.p., Price T Rowe Associates Inc /md/, Capital International Investors, Kayne Anderson Rudnick Investment Management Llc, Viking Global Investors Lp, Invesco Ltd., State Street Corp, and Morgan Stanley .
Saia, Inc. (NasdaqGS:SAIA) institutionel ejerskabsstruktur viser aktuelle positioner i virksomheden efter institutioner og fonde, samt seneste ændringer i positionsstørrelse. Større aktionærer kan omfatte individuelle investorer, investeringsforeninger, hedgefonde eller institutioner. Skema 13D angiver, at investoren besidder (eller besidder) mere end 5 % af virksomheden og har til hensigt (eller har til hensigt at) aktivt at forfølge en ændring i forretningsstrategi. Skema 13G indikerer en passiv investering på over 5%.
The share price as of April 10, 2026 is 401,85 / share. Previously, on April 14, 2025, the share price was 340,64 / share. This represents an increase of 17,97% over that period.

Fondens stemningsscore
Fund Sentiment Score (fka Ownership Accumulation Score) finder de aktier, der bliver mest købt af fonde. Det er resultatet af en sofistikeret, multi-faktor kvantitativ model, der identificerer virksomheder med de højeste niveauer af institutionel akkumulering. Scoringsmodellen bruger en kombination af den samlede stigning i oplyste ejere, ændringerne i porteføljeallokeringer i disse ejere og andre målinger. Tallet går fra 0 til 100, hvor højere tal indikerer et højere niveau af akkumulering for sine jævnaldrende, og 50 er gennemsnittet.
Opdateringsfrekvens: Dagligt
Se Ownership Explorer, som giver en liste over højest rangerende virksomheder.
AI+ Ask Fintel’s AI assistant about Saia, Inc..
Select a question to share a public post with an AI-crafted answer.
Thinking of good questions…
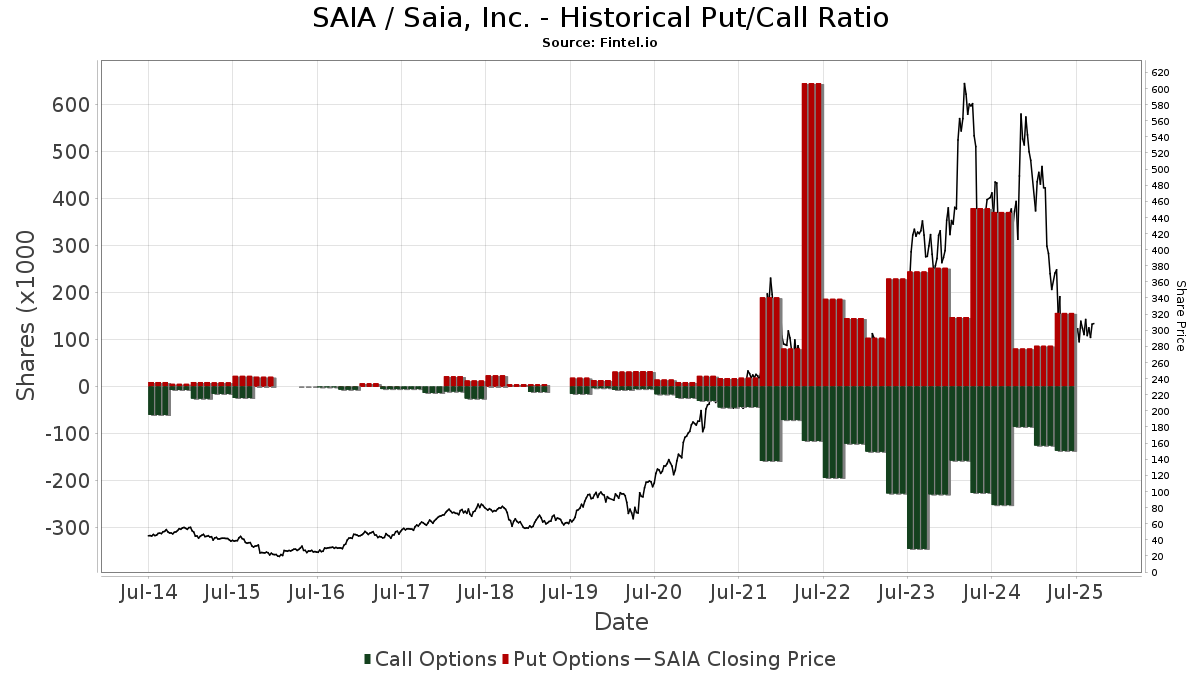
Institutionel Put/Call-forhold
Ud over at indberette standardaktie- og gældsudstedelser skal institutter med mere end 100 mill. aktiver under forvaltning også oplyse deres put- og call-optionsbeholdninger. Da salgsoptioner generelt indikerer negativ stemning, og købsoptioner indikerer positiv stemning, kan vi få en fornemmelse af den overordnede institutionelle stemning ved at plotte forholdet mellem put og kald. Diagrammet til højre viser det historiske put/call-forhold for dette instrument.
Brug af Put/Call Ratio som en indikator for investorernes stemning overvinder en af de vigtigste mangler ved at bruge totalt institutionelt ejerskab, som er, at en betydelig mængde af aktiver under forvaltning investeres passivt for at spore indekser. Passivt forvaltede fonde køber typisk ikke optioner, så indikatoren for put/call-forholdet følger mere nøje følelsen af aktivt forvaltede fonde.
13D/G-arkivering
Vi præsenterer 13D/G ansøgninger separat fra 13F ansøgninger på grund af den forskellige behandling af SEC. 13D/G-ansøgninger kan indgives af grupper af investorer (med én ledende), hvorimod 13F-ansøgninger ikke kan. Dette resulterer i situationer, hvor en investor kan indsende en 13D/G, der rapporterer én værdi for de samlede aktier (der repræsenterer alle de aktier, der ejes af investorgruppen), men derefter indsender en 13F, der rapporterer en anden værdi for de samlede aktier (der udelukkende repræsenterer deres egne) ejendomsret). Det betyder, at aktieejerskab af 13D/G-arkiver og 13F-arkiveringer ofte ikke er direkte sammenlignelige, så vi præsenterer dem separat.
Bemærk: Fra den 16. maj 2021 viser vi ikke længere ejere, der ikke har indsendt en 13D/G inden for det seneste år. Tidligere viste vi den fulde historie af 13D/G-arkiver. Generelt skal enheder, der er forpligtet til at indgive 13D/G-ansøgninger, indgive mindst årligt, før de indsender en afsluttende ansøgning. Dog forlader fonde nogle gange positioner uden at indsende en afsluttende ansøgning (dvs. de afvikler), så visning af den fulde historie resulterede nogle gange i forvirring om det nuværende ejerskab. For at undgå forvirring viser vi nu kun 'aktuelle' ejere - det vil sige - ejere, der har anmeldt inden for det seneste år.
Upgrade to unlock premium data.
| Fil dato | Form | Investor | Forrige Aktier |
Seneste Aktier |
Δ Aktier (Procent) |
Ejendomsret (Procent) |
Δ Ejerskab (Procent) |
|
|---|---|---|---|---|---|---|---|---|
| 2026-03-27 | VANGUARD GROUP INC | 2,489,503 | 0 | -100.00 | 0.00 | -100.00 | ||
| 2026-02-17 | VIKING GLOBAL INVESTORS LP | 1,337,356 | 1,088,582 | -18.60 | 4.10 | -18.33 | ||
| 2026-02-13 | Capital International Investors | 1,684,515 | 1,150,724 | -31.69 | 4.30 | -31.75 | ||
| 2025-11-14 | ALLIANCEBERNSTEIN L.P. | 1,678,722 | 2,273,396 | 35.42 | 8.50 | 34.92 | ||
| 2025-11-14 | PRICE T ROWE ASSOCIATES INC /MD/ | 2,778,303 | 1,755,227 | -36.82 | 6.60 | -36.54 | ||
| 2025-04-24 | BlackRock, Inc. | 3,131,565 | 2,422,077 | -22.66 | 9.10 | -22.88 |
13F og NPORT arkivering
Detaljer om 13F-arkivering er gratis. Detaljer om NP-ansøgninger kræver et premium-medlemskab. Grønne rækker angiver nye positioner. Røde rækker angiver lukkede positioner. Klik på linket ikon for at se den fulde transaktionshistorik.
Opgrader
for at låse premium-data op og eksportere til Excel ![]() .
.
| Fil dato | Kilde | Investor | Type | Gennemsnitlig pris (Øst) |
Aktier | Δ Aktier (%) |
Rapporteret Værdi ($1000) |
Δ Værdi (%) |
Port Alloc (%) |
|
|---|---|---|---|---|---|---|---|---|---|---|
| 2026-01-27 | 13F | First Horizon Corp | 0 | -100,00 | 0 | |||||
| 2026-02-12 | 13F | CIBC Private Wealth Group, LLC | 43.625 | -31,01 | 14.244 | -24,75 | ||||
| 2025-11-14 | 13F | Delta Global Management LP | 0 | -100,00 | 0 | -100,00 | ||||
| 2026-01-22 | 13F/A | Cresset Asset Management, LLC | 0 | -100,00 | 0 | |||||
| 2026-02-12 | 13F | Xponance, Inc. | 2.505 | -16,83 | 818 | -9,32 | ||||
| 2026-02-11 | 13F | Group One Trading, L.p. | Put | 0 | -100,00 | 0 | ||||
| 2026-02-17 | 13F | Citadel Advisors Llc | Put | 16.400 | 57,69 | 5.355 | 71,99 | |||
| 2026-02-17 | 13F | Russell Investments Group, Ltd. | 60.927 | 59,63 | 19.894 | 74,12 | ||||
| 2026-02-03 | 13F | Gateway Investment Advisers Llc | 5.253 | -20,60 | 1.715 | -13,38 | ||||
| 2026-03-04 | 13F | Rehmann Capital Advisory Group | 972 | 11,34 | 318 | 21,84 | ||||
| 2026-02-17 | 13F | Citadel Advisors Llc | Call | 16.300 | -41,79 | 5.322 | -36,51 | |||
| 2026-02-11 | 13F | Capital International Investors | 1.115.424 | -21,40 | 364.226 | -14,26 | ||||
| 2026-02-17 | 13F | Citadel Advisors Llc | 99.876 | 32.612 | ||||||
| 2026-02-11 | 13F | Cerity Partners LLC | 631 | 206 | ||||||
| 2026-02-12 | 13F | Granite Investment Partners, LLC | 19.595 | -41,52 | 6.398 | -36,22 | ||||
| 2026-02-13 | 13F | Next Century Growth Investors Llc | 30.739 | -37,75 | 10.037 | -32,10 | ||||
| 2026-02-11 | 13F | Group One Trading, L.p. | 0 | -100,00 | 0 | |||||
| 2025-11-04 | 13F | Raleigh Capital Management Inc. | 0 | -100,00 | 0 | |||||
| 2026-01-23 | 13F | Optima Capital Llc | 2 | 1 | ||||||
| 2026-01-29 | 13F | Comerica Bank | 21.080 | -34,19 | 6.883 | -28,21 | ||||
| 2026-02-13 | 13F/A | Ontario Teachers Pension Plan Board | 0 | -100,00 | 0 | |||||
| 2026-02-17 | 13F | Public Employees Retirement System Of Ohio | 8.317 | -3,11 | 2.716 | 5,68 | ||||
| 2025-11-13 | 13F | Clear Street Markets Llc | Call | 0 | -100,00 | 0 | -100,00 | |||
| 2025-11-14 | 13F | Samlyn Capital, Llc | 0 | -100,00 | 0 | |||||
| 2026-01-21 | 13F | Westfuller Advisors, LLC | 0 | -100,00 | 0 | |||||
| 2026-02-13 | 13F | Pacific Center for Financial Services | 21 | 0,00 | 6 | 0,00 | ||||
| 2026-02-17 | 13F | Raymond James Financial Inc | 112.599 | -15,97 | 36.766 | -8,34 | ||||
| 2026-01-21 | 13F | Greenleaf Trust | 697 | 228 | ||||||
| 2026-02-13 | 13F | First National Bank Of Omaha | 10.018 | 754,05 | 3.323 | 846,44 | ||||
| 2026-02-17 | 13F | CWM Advisors, LLC | 992 | -4,89 | 324 | 3,53 | ||||
| 2026-02-06 | 13F | HighTower Advisors, LLC | 1.659 | -18,52 | 542 | -11,17 | ||||
| 2026-02-11 | 13F | GW&K Investment Management, LLC | 2.340 | 1 | ||||||
| 2026-02-17 | 13F | SageView Advisory Group, LLC | 36 | 12 | ||||||
| 2026-04-06 | 13F | CX Institutional | 39 | 875,00 | 0 | |||||
| 2026-02-13 | 13F | Smartleaf Asset Management LLC | 46 | 27,78 | 15 | 50,00 | ||||
| 2026-02-13 | 13F | BRITISH COLUMBIA INVESTMENT MANAGEMENT Corp | 0 | -100,00 | 0 | |||||
| 2026-02-05 | 13F | Stephens Investment Management Group LLC | 127.193 | 7,84 | 41.531 | 17,62 | ||||
| 2026-02-11 | 13F | Deutsche Bank Ag\ | 47.770 | 7,32 | 15.598 | 17,06 | ||||
| 2026-01-14 | 13F | LVW Advisors, LLC | 1.352 | -14,27 | 441 | -6,57 | ||||
| 2026-02-17 | 13F | Shelton Capital Management | 933 | 0,00 | 305 | 8,96 | ||||
| 2026-02-13 | 13F | Wells Fargo & Company/mn | 175.376 | -13,12 | 57.264 | -5,24 | ||||
| 2025-11-12 | 13F | Advisor OS, LLC | 0 | -100,00 | 0 | |||||
| 2026-02-05 | 13F | Stephens Inc /ar/ | 879 | 5,52 | 287 | 15,26 | ||||
| 2026-04-08 | 13F | Canandaigua National Corp | 0 | -100,00 | 0 | |||||
| 2026-02-11 | 13F | Capital Group Private Client Services, Inc. | 8.921 | -2,76 | 2.913 | 6,05 | ||||
| 2026-02-13 | 13F | Wealth Alliance | 726 | 5,68 | 237 | 15,61 | ||||
| 2026-01-22 | 13F | Massachusetts Financial Services Co /ma/ | 9.690 | 3,68 | 3.164 | 13,09 | ||||
| 2025-11-14 | 13F | Algert Global Llc | 0 | -100,00 | 0 | |||||
| 2026-02-13 | 13F | Dockside LLC | 7.364 | 2.404 | ||||||
| 2026-01-28 | 13F | Atwood & Palmer Inc | 1.325 | 0,00 | 433 | 9,09 | ||||
| 2025-11-12 | 13F | Aster Capital Management (DIFC) Ltd | 0 | -100,00 | 0 | |||||
| 2026-04-07 | 13F | Signaturefd, Llc | 73 | 4,29 | 26 | 13,64 | ||||
| 2026-02-12 | 13F | Federation des caisses Desjardins du Quebec | 3.955 | 119,11 | 1.291 | 139,07 | ||||
| 2025-11-14 | 13F | Soapstone Management L.p. | 0 | -100,00 | 0 | |||||
| 2026-02-17 | 13F | Creative Planning | 4.011 | 57,42 | 1.310 | 71,78 | ||||
| 2026-02-13 | 13F | Neuberger Berman Group LLC | 283.559 | 11,66 | 92.588 | 21,79 | ||||
| 2026-02-09 | 13F | Hartland & Co., LLC | 571 | 181,28 | 186 | 210,00 | ||||
| 2026-02-13 | 13F | Marshall Wace, Llp | 0 | -100,00 | 0 | |||||
| 2026-02-17 | 13F/A | Northwest & Ethical Investments L.P. | 1.974 | -9,86 | 656 | 1,71 | ||||
| 2025-11-14 | 13F | Virtu Financial LLC | 0 | -100,00 | 0 | |||||
| 2026-02-13 | 13F | Landscape Capital Management, L.l.c. | 0 | -100,00 | 0 | |||||
| 2026-01-27 | 13F | Lecap Asset Management Ltd | 5.182 | 1.692 | ||||||
| 2026-01-29 | 13F | Pictet Asset Management Holding SA | 3.899 | 4,98 | 1.273 | 14,58 | ||||
| 2026-02-13 | 13F | Barclays Plc | 39.769 | 3,32 | 12.985 | 12,70 | ||||
| 2026-02-13 | 13F | Alamea Verwaltungs GmbH | 1.140 | 382 | ||||||
| 2026-01-14 | 13F | Wolff Wiese Magana Llc | 12 | 0,00 | 4 | 0,00 | ||||
| 2025-10-31 | 13F | Whittier Trust Co | 0 | -100,00 | 0 | |||||
| 2026-04-06 | 13F | GAMMA Investing LLC | 631 | 19,51 | 222 | 28,49 | ||||
| 2026-01-21 | 13F | Hunter Associates Investment Management Llc | 21.858 | 2,37 | 7 | 16,67 | ||||
| 2025-11-13 | 13F | Entropy Technologies, LP | 0 | -100,00 | 0 | |||||
| 2026-01-20 | 13F | AdvisorNet Financial, Inc | 346 | 0,87 | 113 | 9,80 | ||||
| 2026-02-10 | 13F | Envestnet Asset Management Inc | 107.881 | -17,97 | 35.225 | -10,53 | ||||
| 2026-02-12 | 13F | Dimensional Fund Advisors Lp | 477.249 | 3,46 | 155.842 | 12,86 | ||||
| 2026-02-13 | 13F | American Century Companies Inc | 21.644 | -19,06 | 7.067 | -11,72 | ||||
| 2026-04-07 | 13F | CoreCap Advisors, LLC | 35 | 118,75 | 12 | 140,00 | ||||
| 2026-04-07 | 13F | Park Avenue Securities Llc | 2.307 | -2,62 | 1 | |||||
| 2026-02-17 | 13F | Man Group plc | 8.219 | -78,38 | 2.684 | -76,43 | ||||
| 2026-02-11 | 13F | Los Angeles Capital Management Llc | 109 | 31 | ||||||
| 2026-02-17 | 13F | J. Goldman & Co LP | 10.517 | 3.434 | ||||||
| 2026-02-17 | 13F | Occudo Quantitative Strategies Lp | 0 | -100,00 | 0 | -100,00 | ||||
| 2026-01-29 | 13F | UMA Financial Services, Inc. | 9 | 12,50 | 3 | 0,00 | ||||
| 2026-02-11 | 13F | Manchester Capital Management LLC | 0 | -100,00 | 0 | -100,00 | ||||
| 2026-01-22 | 13F | Maseco Llp | 21 | 0,00 | 7 | 0,00 | ||||
| 2026-02-17 | 13F | ExodusPoint Capital Management, LP | 0 | -100,00 | 0 | -100,00 | ||||
| 2026-01-26 | 13F | Private Trust Co Na | 21 | 0,00 | 7 | 0,00 | ||||
| 2026-02-17 | 13F | Dark Forest Capital Management Lp | 0 | -100,00 | 0 | -100,00 | ||||
| 2025-11-12 | 13F | CIBC Bancorp USA Inc. | 63.322 | 18.956 | ||||||
| 2026-02-17 | 13F | Summit Trail Advisors, Llc | 1.083 | 42,50 | 354 | 55,51 | ||||
| 2025-11-13 | 13F | Capital Fund Management S.a. | 0 | -100,00 | 0 | |||||
| 2026-03-06 | 13F | Hsbc Holdings Plc | 1.141 | -3,55 | 373 | 5,08 | ||||
| 2026-01-30 | 13F | Us Bancorp \de\ | 5.021 | -3,50 | 1.639 | 5,27 | ||||
| 2026-02-13 | 13F | Treasurer of the State of North Carolina | 16.428 | 37,11 | 5 | 66,67 | ||||
| 2026-02-17 | 13F | Two Sigma Securities, Llc | 0 | -100,00 | 0 | |||||
| 2025-11-14 | 13F | XTX Topco Ltd | 0 | -100,00 | 0 | -100,00 | ||||
| 2025-11-04 | 13F | Guerra Advisors Inc | 4 | 1 | ||||||
| 2026-02-09 | 13F | Life Cycle Investment Partners Ltd | 59.371 | 19.386 | ||||||
| 2026-02-17 | 13F | Atom Investors LP | 19.048 | 1.014,57 | 6.220 | 1.117,03 | ||||
| 2026-02-17 | 13F | Alight Capital Management LP | 12.000 | 3.918 | ||||||
| 2026-02-13 | 13F | Sei Investments Co | 88.946 | -0,28 | 29.043 | 8,76 | ||||
| 2026-02-17 | 13F | Alliancebernstein L.p. | 2.314.180 | 1,79 | 755.626 | 11,03 | ||||
| 2026-02-13 | 13F | Toroso Investments, LLC | 5.059 | 2,00 | 1.652 | 11,25 | ||||
| 2026-01-27 | 13F | Forum Financial Management, LP | 627 | 205 | ||||||
| 2025-11-19 | 13F | Caitong International Asset Management Co., Ltd | 0 | -100,00 | 0 | |||||
| 2026-02-05 | 13F | HFM Investment Advisors, LLC | 2 | 0,00 | 1 | |||||
| 2026-02-13 | 13F | Parkside Financial Bank & Trust | 88 | 6,02 | 29 | 16,67 | ||||
| 2026-01-30 | 13F | State of New Jersey Common Pension Fund D | 9.492 | -4,00 | 3.099 | 4,73 | ||||
| 2026-02-09 | 13F | Royce & Associates Lp | 72.431 | 517,43 | 23.650 | 573,60 | ||||
| 2025-12-09 | 13F/A | Tudor Investment Corp Et Al | Put | 0 | -100,00 | 0 | -100,00 | |||
| 2025-10-15 | 13F | Stephens Consulting, LLC | 0 | -100,00 | 0 | |||||
| 2026-01-23 | 13F | Eagle Bay Advisors LLC | 544 | 178 | ||||||
| 2026-02-03 | 13F | Sageworth Trust Co | 0 | -100,00 | 0 | |||||
| 2026-02-17 | 13F | Fmr Llc | 408.711 | -14,64 | 133.452 | -6,90 | ||||
| 2026-02-17 | 13F | Jones Financial Companies Lllp | 182 | -6,19 | 59 | 3,51 | ||||
| 2026-01-29 | 13F | Concurrent Investment Advisors, LLC | 650 | 212 | ||||||
| 2025-11-14 | 13F | Aigen Investment Management, Lp | 0 | -100,00 | 0 | |||||
| 2026-01-23 | 13F | State of Alaska, Department of Revenue | 2.655 | -6,84 | 1 | |||||
| 2026-01-29 | 13F | UBS Group AG | 42.609 | -59,40 | 13.913 | -55,72 | ||||
| 2026-02-12 | 13F | Bank Of Montreal /can/ | 3.611 | -4,42 | 1.179 | 4,34 | ||||
| 2026-02-17 | 13F | Mirabella Financial Services Llp | 0 | -100,00 | 0 | |||||
| 2026-02-13 | 13F | Van Eck Associates Corp | 21.080 | -2,12 | 7 | 0,00 | ||||
| 2026-01-07 | 13F | Retirement Wealth Solutions LLC | 0 | -100,00 | 0 | |||||
| 2026-02-17 | 13F | Millennium Management Llc | 64.316 | 21.000 | ||||||
| 2026-02-12 | 13F | Nuveen, LLC | 51.344 | -20,19 | 16.765 | -12,95 | ||||
| 2026-02-09 | 13F | Hantz Financial Services, Inc. | 864 | -0,58 | 0 | |||||
| 2026-02-17 | 13F | Aquatic Capital Management LLC | 11.780 | 3.846 | ||||||
| 2025-11-12 | 13F | Fox Run Management, L.l.c. | 0 | -100,00 | 0 | |||||
| 2026-02-13 | 13F | State Street Corp | 811.568 | -0,39 | 264.993 | 8,64 | ||||
| 2026-02-17 | 13F | Utah Retirement Systems | 4.403 | 0,00 | 1.438 | 9,03 | ||||
| 2025-11-14 | 13F | Wolverine Trading, Llc | 751 | -17,74 | 221 | -12,65 | ||||
| 2026-04-08 | 13F | Wealth Enhancement Advisory Services, Llc | 4.688 | 391,40 | 320 | -19,19 | ||||
| 2025-11-14 | 13F | Wolverine Trading, Llc | Call | 4.600 | 4,55 | 1.355 | 11,16 | |||
| 2025-11-14 | 13F | Wolverine Trading, Llc | Put | 7.200 | 28,57 | 2.121 | 36,66 | |||
| 2026-01-20 | 13F | Sheets Smith Wealth Management | 2.634 | 0,08 | 860 | 9,28 | ||||
| 2026-02-17 | 13F | Quantinno Capital Management LP | 5.874 | 43,20 | 1.918 | 56,23 | ||||
| 2026-02-17 | 13F | Northern Trust Corp | 226.732 | -6,15 | 74.033 | 2,37 | ||||
| 2026-01-26 | 13F | Mirae Asset Global Investments Co., Ltd. | 0 | -100,00 | 0 | -100,00 | ||||
| 2026-02-19 | 13F | CI Private Wealth, LLC | 846 | -10,57 | 277 | -2,47 | ||||
| 2026-02-23 | 13F | Mv Capital Management, Inc. | 7 | 600,00 | 2 | |||||
| 2026-02-03 | 13F | Financial Partners Group, Inc | 0 | -100,00 | 0 | |||||
| 2025-11-14 | 13F | Gallo Partners, LP | 0 | -100,00 | 0 | |||||
| 2026-01-21 | 13F | Rocky Mountain Advisers, Llc | 40 | 0,00 | 13 | 18,18 | ||||
| 2026-02-06 | 13F | Global Retirement Partners, LLC | 1.658 | -6,12 | 541 | 2,46 | ||||
| 2026-02-17 | 13F | FIL Ltd | 625.000 | 11,11 | 204.075 | 21,19 | ||||
| 2026-04-08 | 13F | NorthCrest Asset Manangement, LLC | 3.784 | 0,34 | 1.341 | 0,68 | ||||
| 2026-02-06 | 13F | Vestmark Advisory Solutions, Inc. | 12.724 | 5,32 | 4.155 | 14,88 | ||||
| 2026-02-12 | 13F | Brinker Capital Investments, LLC | 1.446 | 108,96 | 472 | 128,02 | ||||
| 2025-11-06 | 13F | Madison Asset Management, LLC | 0 | -100,00 | 0 | |||||
| 2026-04-09 | 13F | Thrive Wealth Management, LLC | 749 | -8,44 | 263 | -1,50 | ||||
| 2026-01-16 | 13F | Louisiana State Employees Retirement System | 7.400 | 0,00 | 2.416 | 9,07 | ||||
| 2026-02-13 | 13F | First Trust Advisors Lp | 740.798 | 32,97 | 241.885 | 45,03 | ||||
| 2026-02-05 | 13F | Qsemble Capital Management, LP | 0 | -100,00 | 0 | |||||
| 2026-01-27 | 13F | Financial Management Professionals, Inc. | 16 | 0,00 | 5 | 25,00 | ||||
| 2026-02-17 | 13F | Bayesian Capital Management, LP | 0 | -100,00 | 0 | |||||
| 2026-02-13 | 13F | Ubs Asset Management Americas Inc | 75.684 | 7,52 | 24.712 | 17,28 | ||||
| 2026-02-17 | 13F | T. Rowe Price Investment Management, Inc. | 164.637 | -75,00 | 54 | -73,10 | ||||
| 2026-02-13 | 13F | Squarepoint Ops LLC | 90.000 | -50,54 | 29.387 | -46,05 | ||||
| 2026-01-28 | 13F | HB Wealth Management, LLC | 645 | 211 | ||||||
| 2026-02-04 | 13F | LRI Investments, LLC | 256 | 7,11 | 84 | 16,90 | ||||
| 2026-02-02 | 13F | Strs Ohio | 638 | 0,16 | 208 | 9,47 | ||||
| 2026-02-03 | 13F | Indivisible Partners | 958 | 313 | ||||||
| 2025-12-09 | 13F/A | Tudor Investment Corp Et Al | 0 | -100,00 | 0 | -100,00 | ||||
| 2026-01-09 | 13F | SG Americas Securities, LLC | 19.817 | 309,78 | 6 | 500,00 | ||||
| 2026-02-09 | 13F | Legal & General Group Plc | 39.051 | -8,15 | 12.751 | 0,17 | ||||
| 2025-11-13 | 13F | Glenmede Investment Management, LP | 1.139 | 19,14 | 341 | 30,27 | ||||
| 2026-02-17 | 13F | Silvercrest Asset Management Group Llc | 87.439 | 16,11 | 28.551 | 26,65 | ||||
| 2026-02-17 | 13F | Wellington Management Group Llp | 0 | -100,00 | 0 | |||||
| 2026-02-13 | 13F | Manufacturers Life Insurance Company, The | 0 | -100,00 | 0 | |||||
| 2026-02-06 | 13F | ProShare Advisors LLC | 1.126 | -5,46 | 368 | 3,09 | ||||
| 2026-02-13 | 13F | Bank Of Nova Scotia | 23.318 | 13,48 | 7.614 | 23,77 | ||||
| 2026-02-17 | 13F | SummitTX Capital, L.P. | 19.821 | 21,90 | 6.472 | 32,96 | ||||
| 2026-02-10 | 13F | Private Wealth Asset Management, LLC | 33 | 0,00 | 11 | 11,11 | ||||
| 2026-02-13 | 13F | Rhumbline Advisers | 70.060 | 1,20 | 22.876 | 10,38 | ||||
| 2026-01-23 | 13F | Lincoln Capital Corp | 4.200 | 1.371 | ||||||
| 2026-02-12 | 13F | Quadrant Capital Group Llc | 975 | -0,81 | 318 | 8,16 | ||||
| 2026-02-12 | 13F | Skopos Labs, Inc. | 1.023 | 339 | ||||||
| 2026-02-17 | 13F | Voloridge Investment Management, Llc | 0 | -100,00 | 0 | |||||
| 2026-02-17 | 13F | Bank Of America Corp /de/ | 87.974 | -42,38 | 28.725 | -37,15 | ||||
| 2026-02-17 | 13F | London Co Of Virginia | 0 | -100,00 | 0 | |||||
| 2026-02-13 | 13F | Brant Point Investment Management Llc | 14.000 | -9,37 | 4.571 | -1,15 | ||||
| 2026-02-17 | 13F | DV Trading LLC | 300 | 98 | ||||||
| 2026-02-10 | 13F | Bnp Paribas Arbitrage, Sa | 85.899 | -19,11 | 28.048 | -11,77 | ||||
| 2026-02-12 | 13F | Wealthspire Advisors, LLC | 0 | -100,00 | 0 | |||||
| 2025-11-12 | 13F | Accent Capital Management, LLC | 0 | -100,00 | 0 | |||||
| 2026-01-08 | 13F | Gradient Investments LLC | 5.068 | 5,94 | 1.655 | 15,50 | ||||
| 2026-02-12 | 13F | Cloud Capital Management, LLC | 0 | -100,00 | 0 | |||||
| 2026-02-13 | 13F | Greenline Wealth Management LLC | 3 | 1 | ||||||
| 2026-02-12 | 13F | BlackRock, Inc. | 2.328.611 | 0,00 | 760.338 | 9,07 | ||||
| 2026-02-14 | 13F | Militia Capital Partners, LP | 2.460 | 173,33 | 803 | 198,51 | ||||
| 2026-02-11 | 13F | Simplex Trading, Llc | 0 | -100,00 | 0 | |||||
| 2026-02-13 | 13F | Jacobs Levy Equity Management, Inc | 170.166 | 102,10 | 55.563 | 120,44 | ||||
| 2026-01-16 | 13F | Ronald Blue Trust, Inc. | 77 | 48,08 | 25 | 66,67 | ||||
| 2026-01-20 | 13F | Harbor Capital Advisors, Inc. | 3.691 | -3,45 | 1 | 0,00 | ||||
| 2026-02-17 | 13F | Quadrature Capital Ltd | 0 | -100,00 | 0 | |||||
| 2025-11-07 | 13F | Shell Asset Management Co | 262 | -60,24 | 0 | |||||
| 2026-02-10 | 13F | Goldman Sachs Group Inc | 172.895 | -10,92 | 56.454 | -2,83 | ||||
| 2026-01-21 | 13F | Clayton Financial Group LLC | 0 | -100,00 | 0 | |||||
| 2026-02-13 | 13F | Walleye Capital LLC | Put | 100 | 0,00 | 33 | 10,34 | |||
| 2026-02-11 | 13F | Nemes Rush Group LLC | 1 | 0 | ||||||
| 2026-02-13 | 13F | Walleye Capital LLC | 28.712 | -70,36 | 9.375 | -67,67 | ||||
| 2026-02-13 | 13F | Walleye Capital LLC | Call | 100 | 33 | |||||
| 2026-01-21 | 13F | Capital Advisors, Ltd. LLC | 35 | 1.066,67 | 0 | |||||
| 2026-01-29 | 13F | State Of Michigan Retirement System | 6.286 | -1,57 | 2.053 | 7,38 | ||||
| 2026-02-06 | 13F | TimesSquare Capital Management, LLC | 2.510 | 0,00 | 820 | 9,05 | ||||
| 2025-11-12 | 13F | Bellwether Advisors, LLC | 0 | -100,00 | 0 | |||||
| 2026-02-03 | 13F | International Assets Investment Management, Llc | 711 | 232 | ||||||
| 2026-02-12 | 13F | Hilton Capital Management, LLC | 6.936 | 10,46 | 2.265 | 20,49 | ||||
| 2026-02-09 | 13F | Quest Partners LLC | 92 | -37,84 | 30 | -31,82 | ||||
| 2026-02-17 | 13F | Cetera Investment Advisers | 3.299 | 2,55 | 1.077 | 11,84 | ||||
| 2026-02-17 | 13F | Voleon Capital Management Lp | 2.114 | -63,87 | 690 | -60,59 | ||||
| 2026-04-09 | 13F | Curated Wealth Partners LLC | 664 | 233 | ||||||
| 2026-01-29 | 13F | Rakuten Securities, Inc. | 3 | 50,00 | 1 | |||||
| 2026-02-17 | 13F | Sagefield Capital LP | 23.869 | -34,20 | 7.794 | -28,23 | ||||
| 2026-02-06 | 13F | Pnc Financial Services Group, Inc. | 2.871 | -16,69 | 937 | -9,12 | ||||
| 2026-02-10 | 13F | Eurizon Capital SGR S.p.A. | 255 | 85 | ||||||
| 2026-02-03 | 13F | NewEdge Wealth, LLC | 10.678 | -7,22 | 3.487 | 7,06 | ||||
| 2026-02-13 | 13F | Cynosure Management, Llc | 1.530 | -44,96 | 500 | -40,02 | ||||
| 2026-01-15 | 13F | Allspring Global Investments Holdings, LLC | 146.995 | -3,58 | 49.562 | 10,63 | ||||
| 2026-03-04 | 13F | Leonteq Securities AG | 0 | -100,00 | 0 | |||||
| 2026-02-13 | 13F | Kayne Anderson Rudnick Investment Management Llc | 1.090.786 | -9,97 | 356.163 | -1,80 | ||||
| 2026-02-17 | 13F | Delaware Management Holdings, Inc. | 75.999 | 24.815 | ||||||
| 2026-02-11 | 13F | Westfield Capital Management Co Lp | 228.751 | 0,37 | 74.692 | 9,48 | ||||
| 2026-02-17 | 13F | Royal Bank Of Canada | 48.928 | -37,01 | 15.977 | -31,29 | ||||
| 2026-02-17 | 13F | Greenhouse Funds LLLP | 0 | -100,00 | 0 | |||||
| 2026-02-05 | 13F | Security National Bank | 5 | 0,00 | 2 | 0,00 | ||||
| 2026-01-09 | 13F | Congress Asset Management Co /ma | 910 | -68,69 | 297 | -65,82 | ||||
| 2026-02-17 | 13F | California State Teachers Retirement System | 25.107 | -0,12 | 8.198 | 8,93 | ||||
| 2026-02-17 | 13F | Frontier Capital Management Co Llc | 184.718 | 55,97 | 60.314 | 70,12 | ||||
| 2026-01-07 | 13F | Everpar Advisors Llc | 0 | -100,00 | 0 | |||||
| 2026-02-17 | 13F | Guggenheim Capital Llc | 0 | -100,00 | 0 | |||||
| 2025-11-14 | 13F | Parallax Volatility Advisers, L.P. | Put | 0 | -100,00 | 0 | ||||
| 2026-02-03 | 13F | Ballentine Partners, LLC | 1.781 | -20,21 | 582 | -13,02 | ||||
| 2025-11-14 | 13F | Parallax Volatility Advisers, L.P. | Call | 0 | -100,00 | 0 | ||||
| 2026-01-21 | 13F | Portside Wealth Group, LLC | 0 | -100,00 | 0 | |||||
| 2026-01-15 | 13F | Retirement Systems of Alabama | 48.464 | -0,47 | 15.824 | 8,56 | ||||
| 2026-02-02 | 13F | Bay Harbor Wealth Management, LLC | 1 | 0,00 | 0 | |||||
| 2026-01-15 | 13F | Fortitude Family Office, LLC | 4 | -76,47 | 1 | -80,00 | ||||
| 2026-02-11 | 13F | Capital International Sarl | 3.397 | -5,87 | 1.109 | 2,69 | ||||
| 2026-02-12 | 13F | California Public Employees Retirement System | 34.544 | -0,03 | 11.279 | 9,05 | ||||
| 2026-02-17 | 13F | Qube Research & Technologies Ltd | 18.478 | 6.033 | ||||||
| 2026-02-13 | 13F | Morgan Stanley | 771.698 | -12,97 | 251.975 | -5,08 | ||||
| 2026-02-09 | 13F | Harbour Investments, Inc. | 24 | 0,00 | 8 | 0,00 | ||||
| 2026-02-10 | 13F | Commonwealth Of Pennsylvania Public School Empls Retrmt Sys | 6.667 | -2,47 | 2.177 | 6,35 | ||||
| 2026-02-05 | 13F | Elyxium Wealth, LLC | 10 | 3 | ||||||
| 2026-02-10 | 13F | Bridges Investment Management Inc | 3.909 | -22,24 | 1.276 | -15,16 | ||||
| 2025-11-14 | 13F | Scientech Research LLC | 0 | -100,00 | 0 | |||||
| 2026-04-07 | 13F | Farther Finance Advisors, LLC | 148 | 2,78 | 53 | 10,64 | ||||
| 2026-02-11 | 13F | Ameritas Investment Partners, Inc. | 4.883 | -2,20 | 1.594 | 6,69 | ||||
| 2026-02-13 | 13F | Itau Unibanco Holding S.A. | 36 | 12 | ||||||
| 2026-02-11 | 13F | Clearbridge Investments, LLC | 0 | -100,00 | 0 | |||||
| 2026-02-13 | 13F | Resources Investment Advisors, LLC. | 904 | 1,01 | 295 | 10,49 | ||||
| 2026-02-11 | 13F | Simplex Trading, Llc | Put | 1.800 | -74,29 | 588 | 29.250,00 | |||
| 2026-02-11 | 13F | Simplex Trading, Llc | Call | 6.300 | 152,00 | 2.057 | ||||
| 2026-01-28 | 13F | DekaBank Deutsche Girozentrale | 721 | 0,00 | 0 | |||||
| 2026-02-03 | 13F | Wilson Asset Management (international) Pty Ltd | 4.162 | -19,00 | 1.359 | -11,70 | ||||
| 2026-04-08 | 13F | Wealth Enhancement Trust Services, Inc. | 0 | -100,00 | 0 | |||||
| 2026-02-17 | 13F | CastleKnight Management LP | 6.100 | 0,00 | 1.992 | 9,04 | ||||
| 2026-02-10 | 13F | Td Asset Management Inc | 11.470 | -17,24 | 3.745 | -9,74 | ||||
| 2026-01-07 | 13F | Procyon Private Wealth Partners, LLC | 658 | 215 | ||||||
| 2026-02-10 | 13F | Bruce G. Allen Investments, LLC | 4 | 0,00 | 1 | 0,00 | ||||
| 2026-02-11 | 13F | MCF Advisors LLC | 32 | -25,58 | 10 | -16,67 | ||||
| 2026-02-13 | 13F | Victory Capital Management Inc | 56.607 | 4,19 | 18.483 | 13,65 | ||||
| 2026-02-11 | 13F | Mattson Financial Services, LLC | 1.110 | 62,04 | 362 | 76,59 | ||||
| 2026-02-11 | 13F | LPL Financial LLC | 22.467 | -9,79 | 7.336 | -1,61 | ||||
| 2026-02-17 | 13F | Mbb Public Markets I Llc | 618 | 202 | ||||||
| 2025-11-04 | 13F | IMC-Chicago, LLC | Call | 0 | -100,00 | 0 | ||||
| 2026-02-04 | 13F | Oregon Public Employees Retirement Fund | 5.354 | 0,43 | 1.748 | 9,59 | ||||
| 2026-02-12 | 13F | Steward Partners Investment Advisory, Llc | 774 | -3,37 | 253 | 5,44 | ||||
| 2025-11-04 | 13F | IMC-Chicago, LLC | Put | 0 | -100,00 | 0 | ||||
| 2026-02-09 | 13F | Morningstar Investment Management LLC | 0 | -100,00 | 0 | -100,00 | ||||
| 2026-02-12 | 13F | Wasatch Advisors Inc | 734.205 | -4,75 | 239.733 | 3,90 | ||||
| 2026-02-13 | 13F | Ossiam | 4.147 | 0,00 | 1.354 | 9,11 | ||||
| 2026-01-14 | 13F | Baron Wealth Management LLC | 927 | -0,96 | 303 | 7,86 | ||||
| 2026-02-27 | 13F/A | Howard Bailey Securities, Llc | 0 | -100,00 | 0 | |||||
| 2026-02-17 | 13F | Lighthouse Investment Partners, LLC | 4.570 | -77,40 | 1.492 | -75,35 | ||||
| 2026-02-13 | 13F | Transamerica Financial Advisors, Inc. | 15 | 5 | ||||||
| 2026-02-12 | 13F | South Dakota Investment Council | 8.411 | -7,89 | 3 | 0,00 | ||||
| 2026-02-06 | 13F | IFP Advisors, Inc | 64 | 3,23 | 21 | 11,11 | ||||
| 2026-02-17 | 13F | Advisory Services Network, LLC | 0 | -100,00 | 0 | |||||
| 2026-02-11 | 13F | Jpmorgan Chase & Co | 569.918 | 18,31 | 186.090 | 29,04 | ||||
| 2026-02-17 | 13F | Moore Capital Management, Lp | 0 | -100,00 | 0 | |||||
| 2026-01-21 | 13F | SJS Investment Consulting Inc. | 2 | 0,00 | 1 | |||||
| 2026-02-13 | 13F | Journey Strategic Wealth Llc | 878 | -14,84 | 287 | -7,14 | ||||
| 2026-02-03 | 13F | Pier Capital, LLC | 26.284 | -1,33 | 8.582 | 7,62 | ||||
| 2026-01-21 | 13F | Yousif Capital Management, Llc | 8.359 | -1,60 | 2.849 | 11,99 | ||||
| 2026-02-11 | 13F | Meeder Asset Management Inc | 17 | 240,00 | 6 | 400,00 | ||||
| 2026-02-02 | 13F | B.O.S.S. Retirement Advisors, LLC | 0 | -100,00 | 0 | |||||
| 2026-02-11 | 13F | Janney Montgomery Scott LLC | 14.986 | -9,86 | 5 | 0,00 | ||||
| 2026-02-17 | 13F | Turas Capital Management LP | 28.460 | 9.293 | ||||||
| 2026-01-27 | 13F | GHP Investment Advisors, Inc. | 8.030 | -1,86 | 2.622 | 7,02 | ||||
| 2026-02-05 | 13F | IMG Wealth Management, Inc. | 0 | -100,00 | 0 | |||||
| 2026-02-11 | 13F | Twin Tree Management, LP | Put | 1.200 | -82,61 | 392 | -81,07 | |||
| 2026-02-13 | 13F | Palisade Asset Management, LLC | 0 | -100,00 | 0 | |||||
| 2026-04-10 | 13F | Impact Capital Partners LLC | 1.199 | -12,35 | 421 | -5,61 | ||||
| 2026-02-11 | 13F | Capital Research Global Investors | 176.035 | 57.479 | ||||||
| 2026-02-04 | 13F | Summit Wealth Group Llc / Co | 0 | -100,00 | 0 | |||||
| 2026-01-20 | 13F | American National Bank | 0 | -100,00 | 0 | |||||
| 2026-04-10 | 13F | Quaker Wealth Management, LLC | 1 | 0,00 | 0 | |||||
| 2026-01-21 | 13F | Oak Thistle LLC | 713 | 233 | ||||||
| 2026-02-13 | 13F | BNP Paribas Asset Management Holding S.A. | 3.377 | 20,01 | 1 | |||||
| 2026-02-17 | 13F | Interval Partners, LP | 124.699 | 40.717 | ||||||
| 2026-02-04 | 13F | Pacer Advisors, Inc. | 0 | -100,00 | 0 | |||||
| 2026-02-13 | 13F | FORA Capital, LLC | 2.621 | 856 | ||||||
| 2026-02-05 | 13F | North Dakota State Investment Board | 943 | 308 | ||||||
| 2026-02-13 | 13F | Nicholas Investment Partners, LP | 2.218 | 11,23 | 724 | 21,48 | ||||
| 2026-02-04 | 13F | Securian Asset Management, Inc | 1.967 | 0,00 | 642 | 9,18 | ||||
| 2026-02-11 | 13F | Capital World Investors | 407.265 | 0,00 | 132.980 | 9,07 | ||||
| 2026-01-14 | 13F | Jfs Wealth Advisors, Llc | 18 | 28,57 | 6 | 25,00 | ||||
| 2026-02-12 | 13F | MetLife Investment Management, LLC | 13.019 | -4,92 | 4.251 | 3,71 | ||||
| 2026-02-09 | 13F | Wcm Investment Management, Llc | 62.989 | -7,12 | 20.934 | 4,75 | ||||
| 2026-01-28 | 13F | Klp Kapitalforvaltning As | 5.880 | 1,38 | 1.920 | 10,54 | ||||
| 2025-11-17 | 13F | Kestra Investment Management, LLC | 0 | -100,00 | 0 | |||||
| 2026-02-13 | 13F | Stifel Financial Corp | 37.841 | -9,16 | 12.356 | -0,93 | ||||
| 2026-01-08 | 13F | True Wealth Design, LLC | 39 | 13 | ||||||
| 2026-01-12 | 13F | Rialto Wealth Management, LLC | 0 | -100,00 | 0 | |||||
| 2026-02-13 | 13F | Charles Schwab Investment Management Inc | 267.415 | 6,01 | 87.316 | 15,63 | ||||
| 2026-02-12 | 13F | Federated Hermes, Inc. | 19.487 | -37,97 | 6.363 | -32,35 | ||||
| 2026-02-10 | 13F | Rothschild Investment Llc | 2 | -33,33 | 1 | |||||
| 2025-11-13 | 13F | Jump Financial, LLC | 0 | -100,00 | 0 | |||||
| 2026-02-11 | 13F | Capital International Inc /ca/ | 22.982 | -29,39 | 7.504 | -22,98 | ||||
| 2026-02-18 | 13F | GWM Advisors LLC | 46 | -46,51 | 15 | -40,00 | ||||
| 2026-02-10 | 13F | Hilltop Partners LLC | 1.370 | 0,00 | 447 | 9,02 | ||||
| 2025-11-13 | 13F | Bokf, Na | 0 | -100,00 | 0 | |||||
| 2026-02-17 | 13F | State Of Wisconsin Investment Board | 22.344 | -2,93 | 7.296 | 5,88 | ||||
| 2026-02-17 | 13F | PharVision Advisers, LLC | 636 | 208 | ||||||
| 2026-02-13 | 13F | Kestra Advisory Services, LLC | 0 | -100,00 | 0 | |||||
| 2026-02-17 | 13F | Susquehanna Fundamental Investments, Llc | 25.513 | 76,74 | 8.331 | 92,78 | ||||
| 2026-01-08 | 13F | Fulton Bank, N.a. | 904 | -20,84 | 295 | -13,49 | ||||
| 2026-02-13 | 13F | Verition Fund Management LLC | 6.522 | -55,21 | 2.130 | -51,16 | ||||
| 2026-02-17 | 13F | Shellback Capital, LP | 0 | -100,00 | 0 | |||||
| 2026-02-05 | 13F | Northwestern Mutual Investment Management Company, Llc | 5.961 | 0,40 | 1.946 | 9,51 | ||||
| 2025-11-14 | 13F | Hrt Financial Lp | 0 | -100,00 | 0 | -100,00 | ||||
| 2025-10-30 | 13F | Locust Wood Capital Advisers, Llc | 0 | -100,00 | 0 | |||||
| 2026-02-03 | 13F | Sequoia Financial Advisors, LLC | 1.685 | 59,11 | 550 | 73,50 | ||||
| 2026-02-13 | 13F | Pathstone Holdings, LLC | 11.017 | 6,08 | 3.594 | 15,60 | ||||
| 2026-02-12 | 13F | Principal Securities, Inc. | 751 | 1,76 | 245 | 11,36 | ||||
| 2026-02-17 | 13F | Advisor Group Holdings, Inc. | 591 | -53,46 | 193 | -48,67 | ||||
| 2026-02-11 | 13F | Prestige Wealth Management Group LLC | 6 | 0,00 | 2 | 0,00 | ||||
| 2026-02-17 | 13F | Junto Capital Management LP | 175.635 | 57.348 | ||||||
| 2026-01-14 | 13F | Eastern Bank | 0 | -100,00 | 0 | |||||
| 2026-02-12 | 13F | Penserra Capital Management LLC | 143 | -1,38 | 0 | |||||
| 2026-02-17 | 13F | Boothbay Fund Management, Llc | Call | 0 | -100,00 | 0 | ||||
| 2026-02-17 | 13F | Two Sigma Investments, Lp | 22.099 | -44,49 | 7.216 | -39,46 | ||||
| 2025-10-31 | 13F | Y-Intercept (Hong Kong) Ltd | 0 | -100,00 | 0 | |||||
| 2026-02-17 | 13F | Ameriprise Financial Inc | 171.434 | 16,56 | 55.980 | 27,14 | ||||
| 2026-02-12 | 13F | Renaissance Technologies Llc | 22.538 | -19,79 | 7.359 | -12,51 | ||||
| 2026-02-13 | 13F | Icon Wealth Advisors, LLC | 1.278 | 0,00 | 417 | 9,16 | ||||
| 2025-11-14 | 13F | Natixis | 0 | -100,00 | 0 | |||||
| 2026-01-26 | 13F | KBC Group NV | 748 | 0,00 | 0 | |||||
| 2025-11-13 | 13F | Eisler Capital Management Ltd. | 16.752 | 4.938 | ||||||
| 2026-01-23 | 13F | Zwj Investment Counsel Inc | 102.548 | -10,93 | 33.484 | -2,85 | ||||
| 2025-11-14 | 13F | Millennium Management Llc | Call | 0 | -100,00 | 0 | -100,00 | |||
| 2026-01-27 | 13F | Evergreen Capital Management Llc | 715 | -0,42 | 233 | 8,88 | ||||
| 2026-02-05 | 13F | Bessemer Group Inc | 459.104 | -9,18 | 150 | -1,32 | ||||
| 2026-02-09 | 13F | Annis Gardner Whiting Capital Advisors, LLC | 145 | -25,64 | 47 | -18,97 | ||||
| 2026-02-12 | 13F | Mount Yale Investment Advisors, LLC | 1.010 | 330 | ||||||
| 2026-02-10 | 13F | Bank of New York Mellon Corp | 173.155 | 0,41 | 56.539 | 9,52 | ||||
| 2026-02-02 | 13F | Sachetta, LLC | 0 | -100,00 | 0 | |||||
| 2026-02-11 | 13F | Wellspring Financial Advisors, LLC | 641 | 209 | ||||||
| 2026-02-17 | 13F | ISAM Funds (UK) Ltd | 1.019 | -46,79 | 333 | -42,06 | ||||
| 2026-01-15 | 13F | Fifth Third Wealth Advisors LLC | 912 | 0,11 | 298 | 9,19 | ||||
| 2026-02-13 | 13F | Police & Firemen's Retirement System of New Jersey | 11.547 | -2,08 | 3.770 | 6,80 | ||||
| 2026-02-09 | 13F | Huntington National Bank | 38 | 46,15 | 12 | 71,43 | ||||
| 2026-02-17 | 13F | Gotham Asset Management, LLC | 4.289 | 124,32 | 1.400 | 144,76 | ||||
| 2026-02-11 | 13F | Parallel Advisors, LLC | 563 | 5,83 | 184 | 15,09 | ||||
| 2026-02-13 | 13F | Channing Capital Management, LLC | 28.330 | 0,02 | 9.250 | 9,09 | ||||
| 2026-01-30 | 13F | Jennison Associates Llc | 0 | -100,00 | 0 | |||||
| 2026-02-17 | 13F | Prelude Capital Management, Llc | 635 | 207 | ||||||
| 2026-02-12 | 13F | Rossby Financial, LCC | 8 | 3 | ||||||
| 2026-02-24 | 13F | Bell Investment Advisors, Inc | 9 | 12,50 | 3 | 0,00 | ||||
| 2026-02-11 | 13F | Havemeyer Place LP | 2.680 | 875 | ||||||
| 2026-02-17 | 13F | Worldquant Millennium Advisors Llc | 4.269 | 1.394 | ||||||
| 2026-02-13 | 13F | Ranger Investment Management, L.P. | 80.828 | -0,30 | 26.392 | 8,74 | ||||
| 2026-02-12 | 13F | Voya Investment Management Llc | 253.020 | 14,77 | 82.616 | 25,19 | ||||
| 2026-01-07 | 13F | Massmutual Trust Co Fsb/adv | 155 | -13,89 | 51 | -5,66 | ||||
| 2026-02-13 | 13F | Pinnacle Wealth Planning Services, Inc. | 107 | 35 | ||||||
| 2026-02-03 | 13F | Mitsubishi UFJ Kokusai Asset Management Co., Ltd. | 60 | 0,00 | 20 | 17,65 | ||||
| 2026-01-29 | 13F | Quent Capital, LLC | 1 | 0 | ||||||
| 2026-02-13 | 13F | Thornburg Investment Management Inc | 10.084 | -2,74 | 3.293 | 6,09 | ||||
| 2026-04-08 | 13F | Heritage Family Offices, LLP | 0 | -100,00 | 0 | |||||
| 2026-01-28 | 13F | B. Metzler seel. Sohn & Co. AG | 18.355 | 6,31 | 5.993 | 15,96 | ||||
| 2026-02-13 | 13F | Sterling Capital Management LLC | 2.345 | -63,63 | 766 | -60,36 | ||||
| 2026-02-06 | 13F | Covestor Ltd | 25 | 0,00 | 0 | |||||
| 2026-01-29 | 13F | Vanguard Group Inc | 2.451.650 | -1,35 | 800.513 | 7,60 | ||||
| 2026-02-13 | 13F | Macquarie Group Ltd | 0 | -100,00 | 0 | |||||
| 2025-10-28 | 13F | Richardson Financial Services Inc. | 0 | -100,00 | 0 | |||||
| 2026-02-03 | 13F | SBI Securities Co., Ltd. | 2 | 0,00 | 1 | |||||
| 2026-02-13 | 13F | MAI Capital Management | 33 | -21,43 | 11 | -16,67 | ||||
| 2026-02-10 | 13F | CIBC Asset Management Inc | 829 | 0,00 | 271 | 8,87 | ||||
| 2026-02-13 | 13F | Prudential Financial Inc | 1.700 | -37,04 | 555 | -31,31 | ||||
| 2026-02-19 | 13F | Invesco Ltd. | 923.912 | 31,72 | 301.676 | 43,67 | ||||
| 2026-02-03 | 13F | Crossmark Global Holdings, Inc. | 1.205 | -6,73 | 393 | 1,81 | ||||
| 2026-02-11 | 13F | Primecap Management Co/ca/ | 54.420 | 0,00 | 17.769 | 9,07 | ||||
| 2026-02-12 | 13F | Colonial Trust Co / SC | 12 | 0,00 | 4 | 33,33 | ||||
| 2025-11-05 | 13F | SOUTH STATE Corp | 0 | -100,00 | 0 | |||||
| 2026-02-12 | 13F | Brown Brothers Harriman & Co | 66 | -65,08 | 22 | -62,50 | ||||
| 2026-02-12 | 13F | Jane Street Group, Llc | Call | 4.200 | -16,00 | 1.371 | -8,36 | |||
| 2025-11-12 | 13F | Quantbot Technologies LP | 0 | -100,00 | 0 | |||||
| 2026-02-11 | 13F | Picton Mahoney Asset Management | 47.206 | 31,17 | 15.414 | 154.030,00 | ||||
| 2026-02-12 | 13F | Jane Street Group, Llc | 956 | -87,81 | 312 | -86,71 | ||||
| 2026-02-12 | 13F | Jane Street Group, Llc | Put | 6.200 | -4,62 | 2.024 | 4,06 | |||
| 2026-02-17 | 13F | Optiver Holding B.V. | 0 | -100,00 | 0 | |||||
| 2026-02-18 | 13F | Cim, Llc | 740 | -3,90 | 242 | 4,78 | ||||
| 2026-02-12 | 13F | Callan Family Office, LLC | 1.188 | 388 | ||||||
| 2026-04-06 | 13F | Versant Capital Management, Inc | 93 | 93,75 | 33 | 113,33 | ||||
| 2026-02-12 | 13F | Hm Payson & Co | 205 | 0,00 | 67 | 8,20 | ||||
| 2026-01-26 | 13F | Whittier Trust Co Of Nevada Inc | 129 | 1,57 | 47 | 27,03 | ||||
| 2026-02-02 | 13F | Mutual Advisors, LLC | 1.369 | -2,28 | 447 | 9,29 | ||||
| 2026-01-21 | 13F | Boomfish Wealth Group, LLC | 680 | 0,00 | 222 | 9,36 | ||||
| 2026-02-10 | 13F | Nomura Asset Management Co Ltd | 92 | 0,00 | 30 | 11,11 | ||||
| 2026-02-13 | 13F | LRT Capital Management, LLC | 0 | -100,00 | 0 | |||||
| 2026-02-17 | 13F | Wiley Bros.-aintree Capital, Llc | 4.005 | -13,59 | 1.308 | -5,56 | ||||
| 2025-11-14 | 13F | Texas Permanent School Fund | 0 | -100,00 | 0 | -100,00 | ||||
| 2026-02-17 | 13F | Two Sigma Advisers, Lp | 0 | -100,00 | 0 | |||||
| 2026-02-11 | 13F | Winton Capital Group Ltd | 2.322 | 758 | ||||||
| 2025-11-10 | 13F | Axq Capital, Lp | 0 | -100,00 | 0 | |||||
| 2026-02-10 | 13F/A | Northwestern Mutual Wealth Management Co | 66 | -84,17 | 22 | -83,06 | ||||
| 2026-01-29 | 13F | Teachers Retirement System Of The State Of Kentucky | 7.770 | 0,00 | 3 | 0,00 | ||||
| 2026-02-05 | 13F | Atria Investments Llc | 6.305 | -11,48 | 2.059 | -3,47 | ||||
| 2026-02-06 | 13F | Lloyd Advisory Services, LLC. | 33 | 11 | ||||||
| 2026-02-17 | 13F | Susquehanna International Group, Llp | Call | 16.600 | 71,13 | 5.420 | 86,70 | |||
| 2026-02-03 | 13F | F/M Investments LLC | 6.622 | -52,61 | 2.162 | -48,31 | ||||
| 2026-02-18 | 13F | Vident Advisory, LLC | 0 | -100,00 | 0 | |||||
| 2026-02-11 | 13F | Empowered Funds, LLC | 217 | -96,98 | 71 | -98,33 | ||||
| 2026-02-17 | 13F | Susquehanna International Group, Llp | 2.153 | -80,10 | 703 | -78,32 | ||||
| 2026-02-17 | 13F | Fred Alger Management, Llc | 12.301 | 27,59 | 4.017 | 39,15 | ||||
| 2026-01-23 | 13F | Diversify Advisory Services, LLC | 618 | 217 | ||||||
| 2026-02-17 | 13F | Susquehanna International Group, Llp | Put | 21.900 | -45,79 | 7.151 | -40,88 | |||
| 2026-02-04 | 13F | Swiss Life Asset Management Ltd | 1.265 | 1,77 | 413 | 11,02 | ||||
| 2025-10-28 | 13F | Qrg Capital Management, Inc. | 0 | -100,00 | 0 | |||||
| 2026-02-09 | 13F | Roubaix Capital, LLC | 0 | -100,00 | 0 | |||||
| 2026-02-12 | 13F | Swiss National Bank | 52.580 | 1,70 | 17.168 | 10,93 | ||||
| 2026-02-12 | 13F | New York State Common Retirement Fund | 49.912 | 1,14 | 16.297 | 10,32 | ||||
| 2026-02-17 | 13F | Farringdon Capital, Ltd. | 0 | -100,00 | 0 | |||||
| 2025-11-13 | 13F | Healthcare Of Ontario Pension Plan Trust Fund | 0 | -100,00 | 0 | -100,00 | ||||
| 2026-02-13 | 13F | Citigroup Inc | 132.067 | 21,69 | 43.123 | 32,73 | ||||
| 2025-11-07 | 13F | Beacon Capital Management, LLC | 0 | -100,00 | 0 | |||||
| 2026-02-13 | 13F | Walleye Trading LLC | Call | 200 | 100,00 | 65 | 124,14 | |||
| 2026-02-10 | 13F | Principia Wealth Advisory, LLC | 1 | 0 | ||||||
| 2026-02-13 | 13F | Walleye Trading LLC | 402 | 131 | ||||||
| 2026-02-03 | 13F | Farmers & Merchants Investments Inc | 23 | 0,00 | 8 | 16,67 | ||||
| 2026-02-13 | 13F | Walleye Trading LLC | Put | 300 | -76,92 | 98 | -75,06 | |||
| 2026-02-02 | 13F | Fifth Third Bancorp | 1.308 | -1,58 | 427 | 7,56 | ||||
| 2026-01-27 | 13F | Zurcher Kantonalbank (Zurich Cantonalbank) | 8.576 | 2.800 | ||||||
| 2026-01-23 | 13F | Private Wealth Management Group, LLC | 2 | -85,71 | 1 | -100,00 | ||||
| 2026-02-05 | 13F | Td Private Client Wealth Llc | 3.415 | -24,83 | 1.115 | -17,95 | ||||
| 2026-02-13 | 13F | Barclays Plc | Call | 0 | -100,00 | 0 | -100,00 | |||
| 2026-02-06 | 13F | Larson Financial Group LLC | 137 | 1.612,50 | 45 | 2.100,00 | ||||
| 2026-02-06 | 13F | Envestnet Portfolio Solutions, Inc. | 2.378 | -6,01 | 776 | 2,51 | ||||
| 2026-02-02 | 13F | Danske Bank A/s | 300 | 50,00 | 98 | 64,41 | ||||
| 2026-01-13 | 13F | Capital Investment Advisors, LLC | 0 | -100,00 | 0 | |||||
| 2026-02-06 | 13F | Tortoise Investment Management, LLC | 0 | -100,00 | 0 | |||||
| 2026-01-15 | 13F | Nisa Investment Advisors, Llc | 3.396 | 0,35 | 1.109 | 9,38 | ||||
| 2026-01-30 | 13F | Torren Management, LLC | 124 | 40 | ||||||
| 2026-02-17 | 13F | Woodline Partners LP | 0 | -100,00 | 0 | |||||
| 2026-02-10 | 13F | New Mexico Educational Retirement Board | 5.400 | 0,00 | 2 | 0,00 | ||||
| 2026-04-10 | 13F | Ipswich Investment Management Co., Inc. | 820 | 0,00 | 288 | 7,87 | ||||
| 2026-01-29 | 13F | Nbc Securities, Inc. | 0 | -100,00 | 0 | |||||
| 2026-01-14 | 13F | Spire Wealth Management | 0 | -100,00 | 0 | |||||
| 2026-02-17 | 13F | Select Equity Group, L.P. | 0 | -100,00 | 0 | |||||
| 2026-01-13 | 13F | Mather Group, Llc. | 0 | -100,00 | 0 | |||||
| 2026-01-29 | 13F | DecisionPoint Financial, LLC | 1 | 0,00 | 0 | |||||
| 2026-02-05 | 13F | Amalgamated Bank | 12.202 | 0,60 | 4 | 0,00 | ||||
| 2026-02-17 | 13F | Canada Pension Plan Investment Board | 2.760 | -65,93 | 901 | -62,83 | ||||
| 2026-02-10 | 13F | Root Financial Partners, LLC | 31 | -26,19 | 10 | -16,67 | ||||
| 2026-02-17 | 13F | Amundi | 49.358 | 16.116 | ||||||
| 2025-11-18 | 13F | Cim Investment Mangement Inc | 0 | -100,00 | 0 | |||||
| 2026-02-13 | 13F | Ubs Oconnor Llc | 15.840 | 5.172 | ||||||
| 2026-01-28 | 13F | Universal- Beteiligungs- und Servicegesellschaft mbH | 15.172 | 368,27 | 4.954 | 411,15 | ||||
| 2026-02-17 | 13F | Ancora Advisors, LLC | 34 | 1.600,00 | 11 | |||||
| 2025-10-24 | 13F | Hemington Wealth Management | 19 | 26,67 | 0 | |||||
| 2026-02-17 | 13F | Grantham, Mayo, Van Otterloo & Co. LLC | 10.225 | 3.339 | ||||||
| 2026-02-09 | 13F | Atlantic Trust, LLC | 16 | 128,57 | 5 | 150,00 | ||||
| 2026-04-09 | 13F | Park Place Capital Corp | 69 | 13,11 | 24 | 26,32 | ||||
| 2026-02-12 | 13F | Ci Investments Inc. | 21.156 | 142,17 | 6.908 | 345.250,00 | ||||
| 2025-10-30 | 13F | Twin Peaks Wealth Advisors, LLC | 0 | -100,00 | 0 | |||||
| 2025-11-14 | 13F | Brevan Howard Capital Management LP | 0 | -100,00 | 0 | -100,00 | ||||
| 2026-02-13 | 13F | Public Employees Retirement Association Of Colorado | 2.818 | 0,00 | 1 | |||||
| 2026-02-17 | 13F | Oddo Bhf Asset Management Sas | 0 | -100,00 | 0 | |||||
| 2026-02-26 | 13F | Anchor Investment Management, LLC | 22 | 0,00 | 7 | 16,67 | ||||
| 2026-02-09 | 13F | Key FInancial Inc | 60 | 0,00 | 20 | 11,76 | ||||
| 2026-02-10 | 13F | Intech Investment Management Llc | 6.520 | 19,68 | 2.129 | 30,55 | ||||
| 2026-02-17 | 13F | Balyasny Asset Management Llc | 192.160 | -25,97 | 62.744 | -19,25 | ||||
| 2026-02-06 | 13F | Meiji Yasuda Asset Management Co Ltd. | 619 | 202 | ||||||
| 2026-02-11 | 13F | Twin Tree Management, LP | 0 | -100,00 | 0 | -100,00 | ||||
| 2026-02-17 | 13F | RiverPark Advisors, LLC | 377 | -41,28 | 123 | -35,94 | ||||
| 2025-11-12 | 13F | NewSquare Capital LLC | 0 | -100,00 | 0 | |||||
| 2026-04-08 | 13F | DiNuzzo Private Wealth, Inc. | 6 | 0,00 | 2 | 100,00 | ||||
| 2026-02-17 | 13F | Mercer Global Advisors Inc /adv | 912 | 298 | ||||||
| 2026-02-02 | 13F | Principal Financial Group Inc | 57.325 | -3,11 | 18.718 | 5,69 | ||||
| 2026-02-13 | 13F | Mml Investors Services, Llc | 11.856 | -6,80 | 3.871 | 1,65 | ||||
| 2026-01-23 | 13F | Oak Ridge Investments Llc | 6.468 | -2,74 | 2.112 | 6,08 | ||||
| 2026-02-17 | 13F | D. E. Shaw & Co., Inc. | Put | 0 | -100,00 | 0 | ||||
| 2026-02-06 | 13F | Axxcess Wealth Management, Llc | 712 | -12,32 | 232 | -4,53 | ||||
| 2025-11-14 | 13F | Cubist Systematic Strategies, LLC | Put | 2.600 | -42,22 | 778 | -36,85 | |||
| 2026-02-10 | 13F | Mutual Of America Capital Management Llc | 24.740 | 10,65 | 8.078 | 20,69 | ||||
| 2025-11-14 | 13F | Cubist Systematic Strategies, LLC | Call | 5.600 | -37,78 | 1.676 | -32,01 | |||
| 2026-02-17 | 13F | D. E. Shaw & Co., Inc. | 233.820 | 9,14 | 76.347 | 19,04 | ||||
| 2026-02-17 | 13F | Driehaus Capital Management Llc | 146.485 | 47.830 | ||||||
| 2025-11-14 | 13F | Weiss Asset Management LP | 0 | -100,00 | 0 | -100,00 | ||||
| 2026-02-02 | 13F | Oppenheimer Asset Management Inc. | 7.871 | -5,52 | 2.570 | 3,09 | ||||
| 2026-02-11 | 13F | Rise Advisors, LLC | 0 | -100,00 | 0 | |||||
| 2026-02-11 | 13F | O'shaughnessy Asset Management, Llc | 728 | -26,76 | 238 | -20,20 | ||||
| 2025-11-14 | 13F | Clearline Capital LP | 0 | -100,00 | 0 | |||||
| 2026-01-23 | 13F | Running Oak Capital LLC | 40.492 | -24,50 | 13.221 | -17,65 | ||||
| 2026-02-12 | 13F | Ensign Peak Advisors, Inc | 9.063 | 25,08 | 2.959 | 36,42 | ||||
| 2026-02-13 | 13F | JustInvest LLC | 4.232 | -6,80 | 1.382 | 1,62 | ||||
| 2026-02-17 | 13F | Anomaly Capital Management, LP | 86.148 | 28.129 | ||||||
| 2026-02-17 | 13F | Wealth Watch Advisors, INC | 7 | 0,00 | 2 | 0,00 | ||||
| 2026-02-13 | 13F | Rosenblum Silverman Sutton S F Inc /ca | 0 | -100,00 | 0 | |||||
| 2026-01-29 | 13F | Sanctuary Advisors, LLC | 6.305 | -8,70 | 2.059 | -0,44 | ||||
| 2025-10-22 | 13F | Geneos Wealth Management Inc. | 0 | -100,00 | 0 | |||||
| 2026-01-26 | 13F | Cwm, Llc | 301 | 18,50 | 0 | |||||
| 2026-02-17 | 13F | Jain Global LLC | 0 | -100,00 | 0 | |||||
| 2025-11-14 | 13F | Engineers Gate Manager LP | 0 | -100,00 | 0 | |||||
| 2026-02-13 | 13F | Caxton Associates Llp | 910 | 297 | ||||||
| 2026-02-13 | 13F | SG Capital Management LLC | 25.345 | 8.276 | ||||||
| 2026-02-13 | 13F | Fieldview Capital Management, LLC | 0 | -100,00 | 0 | |||||
| 2025-11-14 | 13F | Numerai GP LLC | 0 | -100,00 | 0 | |||||
| 2026-01-30 | 13F/A | M&t Bank Corp | 5.811 | 5,98 | 1.898 | 15,67 | ||||
| 2026-02-03 | 13F | Everence Capital Management Inc | 700 | 0,00 | 0 | |||||
| 2026-02-18 | 13F/A | Alberta Investment Management Corp | 4.800 | 1.567 | ||||||
| 2026-02-18 | 13F | State of Tennessee, Treasury Department | 8.537 | -4,10 | 2.859 | 7,28 | ||||
| 2026-02-06 | 13F | Cullen/frost Bankers, Inc. | 17 | 30,77 | 6 | 66,67 | ||||
| 2026-02-05 | 13F | Allworth Financial LP | 114 | -19,72 | 37 | -11,90 | ||||
| 2026-02-12 | 13F | McMillan Office, Inc. | 6 | 2 | ||||||
| 2026-02-09 | 13F | Smithfield Trust Co | 129 | 3,20 | 0 | |||||
| 2026-02-13 | 13F | Edgestream Partners, L.P. | 24.486 | 315,37 | 7.995 | 353,23 | ||||
| 2026-02-17 | 13F | Viking Global Investors Lp | 1.088.582 | -21,34 | 355.444 | -14,20 | ||||
| 2026-02-02 | 13F | Truist Financial Corp | 30.807 | -12,09 | 10.059 | -4,11 | ||||
| 2026-02-11 | 13F | Marks Group Wealth Management, Inc | 14.323 | -50,53 | 4.677 | -46,05 | ||||
| 2026-02-13 | 13F | Umb Bank N A/mo | 302 | 1,34 | 99 | 10,11 | ||||
| 2026-02-17 | 13F | Price T Rowe Associates Inc /md/ | 1.798.841 | 2,49 | 587 | 11,81 | ||||
| 2026-02-06 | 13F | Entrust Financial Llc | 45 | 15 | ||||||
| 2026-02-10 | 13F | State of Wyoming | 608 | 501,98 | 199 | 560,00 | ||||
| 2026-01-30 | 13F | New York State Teachers Retirement System | 21.586 | -1,62 | 7 | 16,67 | ||||
| 2026-02-17 | 13F | Palisade Capital Management Llc/nj | 78.115 | 0,03 | 25.506 | 9,11 | ||||
| 2026-01-12 | 13F | DAVENPORT & Co LLC | 1.669 | -48,17 | 545 | -43,51 | ||||
| 2026-02-13 | 13F | Southport Management, L.l.c. | 800 | 261 | ||||||
| 2026-01-26 | 13F | AE Wealth Management LLC | 2.061 | -6,23 | 673 | 2,28 | ||||
| 2026-02-17 | 13F | Tower Research Capital LLC (TRC) | 748 | -23,83 | 244 | -16,72 | ||||
| 2026-02-17 | 13F | Aqr Capital Management Llc | 11.596 | 139,34 | 3.786 | 166,81 | ||||
| 2026-02-13 | 13F | Rafferty Asset Management, LLC | 912 | 1,56 | 298 | 10,82 | ||||
| 2026-01-30 | 13F | Bogart Wealth, LLC | 3 | -40,00 | 1 | -100,00 | ||||
| 2025-11-06 | 13F | MQS Management LLC | 0 | -100,00 | 0 | -100,00 | ||||
| 2026-02-17 | 13F | Freestone Grove Partners LP | 0 | -100,00 | 0 | |||||
| 2025-11-13 | 13F | Artemis Investment Management LLP | 0 | -100,00 | 0 | -100,00 | ||||
| 2026-02-12 | 13F | Sepio Capital, LP | 1.508 | -2,14 | 492 | 6,72 | ||||
| 2026-02-13 | 13F | Great West Life Assurance Co /can/ | 15.018 | -22,11 | 5 | -20,00 | ||||
| 2026-02-13 | 13F | Quarry LP | 85 | 8.400,00 | 28 | |||||
| 2026-01-14 | 13F | Kmg Fiduciary Partners, Llc | 1.534 | 0,00 | 501 | 8,93 | ||||
| 2026-02-17 | 13F | Holocene Advisors, LP | 29.346 | 9.582 | ||||||
| 2026-02-14 | 13F | Rockefeller Capital Management L.P. | 1.231 | 203,20 | 402 | 231,40 | ||||
| 2026-02-11 | 13F | Franklin Resources Inc | 15.049 | -4,04 | 4.914 | 4,67 | ||||
| 2026-02-17 | 13F | Ameriflex Group, Inc. | 0 | -100,00 | 0 | |||||
| 2026-02-12 | 13F | State Board Of Administration Of Florida Retirement System | 26.461 | -1,23 | 8.640 | 7,73 | ||||
| 2026-02-06 | 13F | Bare Financial Services, Inc | 14 | -39,13 | 5 | -33,33 | ||||
| 2025-11-05 | 13F | Fullcircle Wealth Llc | 888 | -2,95 | 256 | -7,27 | ||||
| 2026-01-28 | 13F | Teacher Retirement System Of Texas | 882 | -74,73 | 288 | -72,51 | ||||
| 2026-02-03 | 13F | Diversify Wealth Management, Llc | 2.568 | -27,91 | 916 | -9,67 | ||||
| 2026-02-13 | 13F | SRS Capital Advisors, Inc. | 668 | -34,64 | 218 | -28,52 | ||||
| 2025-11-14 | 13F | National Bank Of Canada /fi/ | 0 | -100,00 | 0 | |||||
| 2025-12-09 | 13F/A | Tudor Investment Corp Et Al | Call | 3.700 | 60,87 | 1.108 | 75,71 | |||
| 2026-02-11 | 13F | Vestor Capital, Llc | 323 | 9,49 | 0 | |||||
| 2025-10-28 | 13F | BRYN MAWR TRUST Co | 36 | 0,00 | 11 | 11,11 | ||||
| 2026-01-23 | 13F | Assetmark, Inc | 313 | 2,62 | 102 | 12,09 | ||||
| 2026-02-09 | 13F | Geode Capital Management, Llc | 497.944 | 0,05 | 162.622 | 9,13 | ||||
| 2026-02-12 | 13F | Commonwealth Equity Services, Llc | 1.523 | -44,19 | 497 | |||||
| 2026-02-06 | 13F | Handelsbanken Fonder AB | 8.298 | 17,57 | 3 | 0,00 | ||||
| 2026-02-05 | 13F | Thrivent Financial For Lutherans | 31.988 | 21,52 | 10 | 42,86 | ||||
| 2025-11-14 | 13F | Twinbeech Capital Lp | 0 | -100,00 | 0 | |||||
| 2026-02-09 | 13F | New Age Alpha Advisors, LLC | 0 | -100,00 | 0 | |||||
| 2026-02-10 | 13F | Norges Bank | 399.397 | 130.411 | ||||||
| 2026-02-02 | 13F | CENTRAL TRUST Co | 10 | 11,11 | 3 | 50,00 | ||||
| 2026-02-17 | 13F | Cartenna Capital, LP | Call | 0 | -100,00 | 0 | ||||
| 2026-02-13 | 13F | Hudson Bay Capital Management LP | 0 | -100,00 | 0 | |||||
| 2026-02-17 | 13F | Cartenna Capital, LP | 0 | -100,00 | 0 | |||||
| 2026-02-17 | 13F | Quantitative Investment Management, LLC | 4.552 | 1 | ||||||
| 2026-01-23 | 13F | Yorktown Management & Research Co Inc | 1.840 | 0,00 | 601 | 9,09 | ||||
| 2026-01-28 | 13F | Arizona State Retirement System | 7.426 | -5,40 | 2.425 | 3,19 | ||||
| 2026-02-17 | 13F | Captrust Financial Advisors | 2.299 | 4,26 | 751 | 13,64 | ||||
| 2026-02-13 | 13F | Segall Bryant & Hamill, Llc | 50.857 | 4,68 | 16.606 | 14,17 | ||||
| 2026-02-17 | 13F | Glenmede Trust Co Na | 967 | 16,79 | 316 | 9,00 | ||||
| 2026-01-23 | 13F | Steigerwald, Gordon & Koch Inc. | 15 | 275,00 | 5 | 300,00 | ||||
| 2026-02-06 | 13F | EverSource Wealth Advisors, LLC | 428 | -12,47 | 140 | -4,79 | ||||
| 2026-01-20 | 13F | Cromwell Holdings LLC | 4 | 0,00 | 1 | 0,00 | ||||
| 2026-02-17 | 13F | Boothbay Fund Management, Llc | 0 | -100,00 | 0 | |||||
| 2026-02-17 | 13F | Janus Henderson Group Plc | 325.645 | -3,46 | 106.331 | 5,29 | ||||
| 2026-02-17 | 13F | Maryland State Retirement & Pension System | 1.409 | 0,00 | 460 | 9,26 |
Other Listings
| DE:SQR | 337,80 € |