Grundlæggende statistik
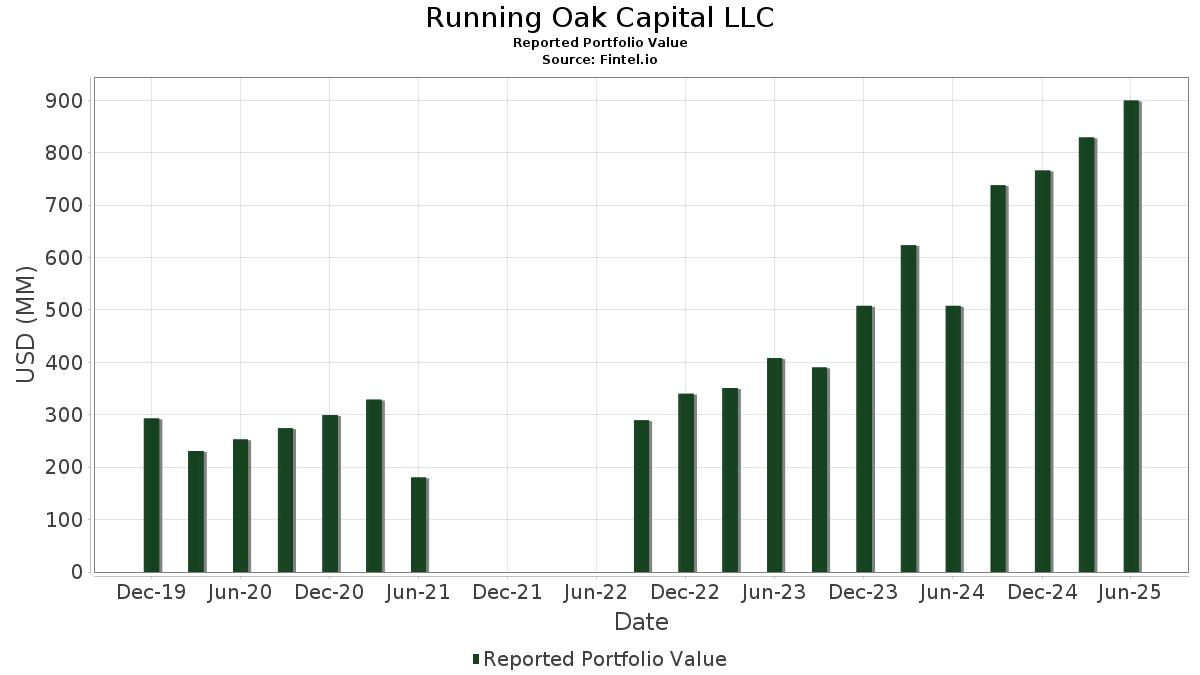
| Porteføljeværdi | $ 891.510.323 |
| Nuværende stillinger | 55 |
Seneste beholdninger, ydeevne, AUM (fra 13F, 13D)
Running Oak Capital LLC har afsløret 55 samlede besiddelser i deres seneste SEC-arkivering. Den seneste porteføljeværdi er beregnet til at være $ 891.510.323 USD. Faktiske aktiver under forvaltning (AUM) er denne værdi plus kontanter (som ikke er oplyst). Running Oak Capital LLCs største beholdninger er EMCOR Group, Inc. (US:EME) , nVent Electric plc (US:NVT) , Curtiss-Wright Corporation (US:CW) , Alphabet Inc. (US:GOOG) , and Leidos Holdings, Inc. (US:LDOS) .
Top øger dette kvartal
Vi bruger ændringen i porteføljeallokeringen, fordi dette er den mest meningsfulde metrik. Ændringer kan skyldes handler eller ændringer i aktiekurser.
| Sikkerhed | Aktier (MM) |
Værdi (MM$) |
Portefølje % | ΔPortefølje % |
|---|
Top falder i dette kvartal
Vi bruger ændringen i porteføljeallokeringen, fordi dette er den mest meningsfulde metrik. Ændringer kan skyldes handler eller ændringer i aktiekurser.
| Sikkerhed | Aktier (MM) |
Værdi (MM$) |
Portefølje % | ΔPortefølje % |
|---|---|---|---|---|
| FDS / FactSet Research Systems Inc. | 0,04 | 11,84 | 0,8783 | -0,9248 |
| DRI / Darden Restaurants, Inc. | 0,08 | 15,13 | 1,1220 | -0,7637 |
| FI / Fiserv, Inc. | 0,11 | 13,91 | 1,0315 | -0,7614 |
| ICE / Intercontinental Exchange, Inc. | 0,10 | 16,37 | 1,2139 | -0,7550 |
| CI / The Cigna Group | 0,05 | 15,09 | 1,1192 | -0,7369 |
| INTU / Intuit Inc. | 0,02 | 16,58 | 1,2297 | -0,7296 |
| HON / Honeywell International Inc. | 0,07 | 15,64 | 1,1601 | -0,7175 |
| SYK / Stryker Corporation | 0,04 | 16,13 | 1,1963 | -0,7103 |
| CSL / Carlisle Companies Incorporated | 0,05 | 15,06 | 1,1168 | -0,7090 |
| BRO / Brown & Brown, Inc. | 0,17 | 15,72 | 1,1657 | -0,7082 |
13F og Fondsarkivering
Denne formular blev indsendt den 2025-11-04 for rapporteringsperioden 2025-09-30. Klik på linkikonet for at se den fulde transaktionshistorik.
Opgrader for at låse op for premium-data og eksportere til Excel ![]() .
.
| Sikkerhed | Type | Gennemsnitlig aktiekurs | Aktier (MM) |
Δ Aktier (%) |
Δ Aktier (%) |
Værdi ($MM) |
Portefølje (%) |
ΔPortefølje (%) |
|
|---|---|---|---|---|---|---|---|---|---|
| EME / EMCOR Group, Inc. | 0,03 | -12,73 | 20,28 | 5,98 | 1,5043 | -0,6231 | |||
| NVT / nVent Electric plc | 0,20 | -15,15 | 20,04 | 14,26 | 1,4862 | -0,4632 | |||
| CW / Curtiss-Wright Corporation | 0,04 | -5,64 | 19,77 | 4,86 | 1,4665 | -0,6296 | |||
| GOOG / Alphabet Inc. | 0,08 | -17,48 | 19,06 | 13,29 | 1,4139 | -0,4566 | |||
| LDOS / Leidos Holdings, Inc. | 0,10 | -10,58 | 18,93 | 7,11 | 1,4043 | -0,5607 | |||
| TJX / The TJX Companies, Inc. | 0,13 | -5,70 | 18,38 | 10,37 | 1,3635 | -0,4880 | |||
| ITT / ITT Inc. | 0,10 | -8,49 | 18,17 | 4,31 | 1,3479 | -0,5889 | |||
| GD / General Dynamics Corporation | 0,05 | -8,70 | 18,13 | 6,74 | 1,3450 | -0,5435 | |||
| PH / Parker-Hannifin Corporation | 0,02 | -6,98 | 17,95 | 0,97 | 1,3316 | -0,6450 | |||
| TDY / Teledyne Technologies Incorporated | 0,03 | -6,25 | 17,94 | 7,24 | 1,3308 | -0,5291 | |||
| ETN / Eaton Corporation plc | 0,05 | -6,04 | 17,90 | -1,49 | 1,3274 | -0,6922 | |||
| CACI / CACI International Inc | 0,04 | -4,77 | 17,86 | -0,36 | 1,3246 | -0,6679 | |||
| J / Jacobs Solutions Inc. | 0,12 | -7,28 | 17,42 | 5,70 | 1,2924 | -0,5402 | |||
| RMD / ResMed Inc. | 0,06 | -3,72 | 17,38 | 2,16 | 1,2894 | -0,6024 | |||
| IQV / IQVIA Holdings Inc. | 0,09 | -8,41 | 17,24 | 10,40 | 1,2784 | -0,4573 | |||
| ICLR / ICON Public Limited Company | 0,10 | -8,28 | 17,21 | 10,35 | 1,2764 | -0,4572 | |||
| PRI / Primerica, Inc. | 0,06 | 0,17 | 17,08 | 1,61 | 1,2672 | -0,6020 | |||
| SSNC / SS&C Technologies Holdings, Inc. | 0,19 | -3,69 | 17,05 | 3,24 | 1,2647 | -0,5713 | |||
| AJG / Arthur J. Gallagher & Co. | 0,05 | 5,51 | 16,95 | 2,09 | 1,2572 | -0,5886 | |||
| AME / AMETEK, Inc. | 0,09 | -2,11 | 16,64 | 1,70 | 1,2344 | -0,5849 | |||
| RBA / RB Global, Inc. | 0,15 | -5,97 | 16,61 | -4,05 | 1,2323 | -0,6926 | |||
| INTU / Intuit Inc. | 0,02 | 8,49 | 16,58 | -5,93 | 1,2297 | -0,7296 | |||
| STE / STERIS plc | 0,07 | -1,90 | 16,53 | 1,05 | 1,2263 | -0,5927 | |||
| V / Visa Inc. | 0,05 | 1,10 | 16,53 | -2,79 | 1,2260 | -0,6644 | |||
| RSG / Republic Services, Inc. | 0,07 | 3,81 | 16,48 | -3,41 | 1,2220 | -0,6740 | |||
| ADP / Automatic Data Processing, Inc. | 0,06 | 3,09 | 16,40 | -1,90 | 1,2161 | -0,6418 | |||
| FELE / Franklin Electric Co., Inc. | 0,17 | -3,40 | 16,39 | 2,47 | 1,2160 | -0,5626 | |||
| BR / Broadridge Financial Solutions, Inc. | 0,07 | -1,86 | 16,37 | -3,80 | 1,2146 | -0,6777 | |||
| ICE / Intercontinental Exchange, Inc. | 0,10 | 0,63 | 16,37 | -7,59 | 1,2139 | -0,7550 | |||
| TSCO / Tractor Supply Company | 0,29 | -5,80 | 16,31 | 1,53 | 1,2096 | -0,5761 | |||
| IR / Ingersoll Rand Inc. | 0,20 | 3,29 | 16,27 | 2,59 | 1,2068 | -0,5562 | |||
| SYK / Stryker Corporation | 0,04 | 0,64 | 16,13 | -5,96 | 1,1963 | -0,7103 | |||
| BDX / Becton, Dickinson and Company | 0,09 | -5,09 | 16,09 | 3,13 | 1,1934 | -0,5409 | |||
| SAIA / Saia, Inc. | 0,05 | -8,43 | 16,06 | 0,04 | 1,1909 | -0,5932 | |||
| TXRH / Texas Roadhouse, Inc. | 0,10 | 6,44 | 16,01 | -6,07 | 1,1873 | -0,7072 | |||
| GGG / Graco Inc. | 0,19 | 0,63 | 15,83 | -0,55 | 1,1745 | -0,5955 | |||
| BRO / Brown & Brown, Inc. | 0,17 | 10,22 | 15,72 | -6,76 | 1,1657 | -0,7082 | |||
| GWW / W.W. Grainger, Inc. | 0,02 | 3,38 | 15,64 | -5,30 | 1,1604 | -0,6760 | |||
| HON / Honeywell International Inc. | 0,07 | 2,45 | 15,64 | -7,40 | 1,1601 | -0,7175 | |||
| WSO / Watsco, Inc. | 0,04 | 6,05 | 15,60 | -2,91 | 1,1573 | -0,6292 | |||
| FCN / FTI Consulting, Inc. | 0,10 | -0,60 | 15,58 | -0,50 | 1,1554 | -0,5851 | |||
| MMC / Marsh & McLennan Companies, Inc. | 0,08 | 6,19 | 15,50 | -2,12 | 1,1499 | -0,6109 | |||
| APD / Air Products and Chemicals, Inc. | 0,06 | -0,72 | 15,13 | -4,01 | 1,1224 | -0,6301 | |||
| DRI / Darden Restaurants, Inc. | 0,08 | 2,11 | 15,13 | -10,82 | 1,1220 | -0,7637 | |||
| CI / The Cigna Group | 0,05 | 3,64 | 15,09 | -9,63 | 1,1192 | -0,7369 | |||
| DOX / Amdocs Limited | 0,18 | 4,61 | 15,08 | -5,91 | 1,1188 | -0,6635 | |||
| CSL / Carlisle Companies Incorporated | 0,05 | 4,07 | 15,06 | -8,32 | 1,1168 | -0,7090 | |||
| ROP / Roper Technologies, Inc. | 0,03 | 5,92 | 15,03 | -6,81 | 1,1151 | -0,6785 | |||
| ACN / Accenture plc | 0,06 | 14,28 | 14,19 | -5,71 | 1,0525 | -0,6205 | |||
| ALC / Alcon Inc. | 0,19 | 6,01 | 14,05 | -10,53 | 1,0424 | -0,7038 | |||
| DECK / Deckers Outdoor Corporation | 0,14 | -6,32 | 14,05 | -7,86 | 1,0423 | -0,6532 | |||
| FI / Fiserv, Inc. | 0,11 | 15,30 | 13,91 | -13,78 | 1,0315 | -0,7614 | |||
| FDS / FactSet Research Systems Inc. | 0,04 | 13,99 | 11,84 | -26,99 | 0,8783 | -0,9248 | |||
| NSC / Norfolk Southern Corporation | 0,03 | -4,14 | 8,61 | 12,51 | 0,6385 | -0,2121 | |||
| UNP / Union Pacific Corporation | 0,04 | -2,58 | 8,28 | 0,08 | 0,6141 | -0,3055 | |||
| BSX / Boston Scientific Corporation | 0,00 | -100,00 | 0,00 | 0,0000 |