Grundlæggende statistik
| Institutionelle ejere | 193 total, 193 long only, 0 short only, 0 long/short - change of 1,05% MRQ |
| Gennemsnitlig porteføljeallokering | 0.2199 % - change of 8,86% MRQ |
| Institutionelle aktier (lange) | 17.650.498 (ex 13D/G) - change of -0,79MM shares -4,29% MRQ |
| Institutionel værdi (lang) | $ 851.775 USD ($1000) |
Institutionelt ejerskab og aktionærer
Invesco Exchange-Traded Fund Trust II - Invesco S&P SmallCap 600 Revenue ETF (US:RWJ) har 193 institutionelle ejere og aktionærer, der har indsendt 13D/G- eller 13F-formularer til Securities Exchange Commission (SEC). Disse institutioner har i alt 17,650,498 aktier. Største aktionærer omfatter LPL Financial LLC, Morgan Stanley, Fusion Family Wealth LLC, Bank Of America Corp /de/, Raymond James Financial Inc, Ameriprise Financial Inc, UBS Group AG, Advisor Group Holdings, Inc., Colony Group, LLC, and Wells Fargo & Company/mn .
Invesco Exchange-Traded Fund Trust II - Invesco S&P SmallCap 600 Revenue ETF (ARCA:RWJ) institutionel ejerskabsstruktur viser aktuelle positioner i virksomheden efter institutioner og fonde, samt seneste ændringer i positionsstørrelse. Større aktionærer kan omfatte individuelle investorer, investeringsforeninger, hedgefonde eller institutioner. Skema 13D angiver, at investoren besidder (eller besidder) mere end 5 % af virksomheden og har til hensigt (eller har til hensigt at) aktivt at forfølge en ændring i forretningsstrategi. Skema 13G indikerer en passiv investering på over 5%.
The share price as of April 24, 2026 is 55,22 / share. Previously, on April 28, 2025, the share price was 38,79 / share. This represents an increase of 42,36% over that period.

Fondens stemningsscore
Fund Sentiment Score (fka Ownership Accumulation Score) finder de aktier, der bliver mest købt af fonde. Det er resultatet af en sofistikeret, multi-faktor kvantitativ model, der identificerer virksomheder med de højeste niveauer af institutionel akkumulering. Scoringsmodellen bruger en kombination af den samlede stigning i oplyste ejere, ændringerne i porteføljeallokeringer i disse ejere og andre målinger. Tallet går fra 0 til 100, hvor højere tal indikerer et højere niveau af akkumulering for sine jævnaldrende, og 50 er gennemsnittet.
Opdateringsfrekvens: Dagligt
Se Ownership Explorer, som giver en liste over højest rangerende virksomheder.
AI+ Ask Fintel’s AI assistant about Invesco Exchange-Traded Fund Trust II - Invesco S&P SmallCap 600 Revenue ETF.
Select a question to share a public post with an AI-crafted answer.
Thinking of good questions…
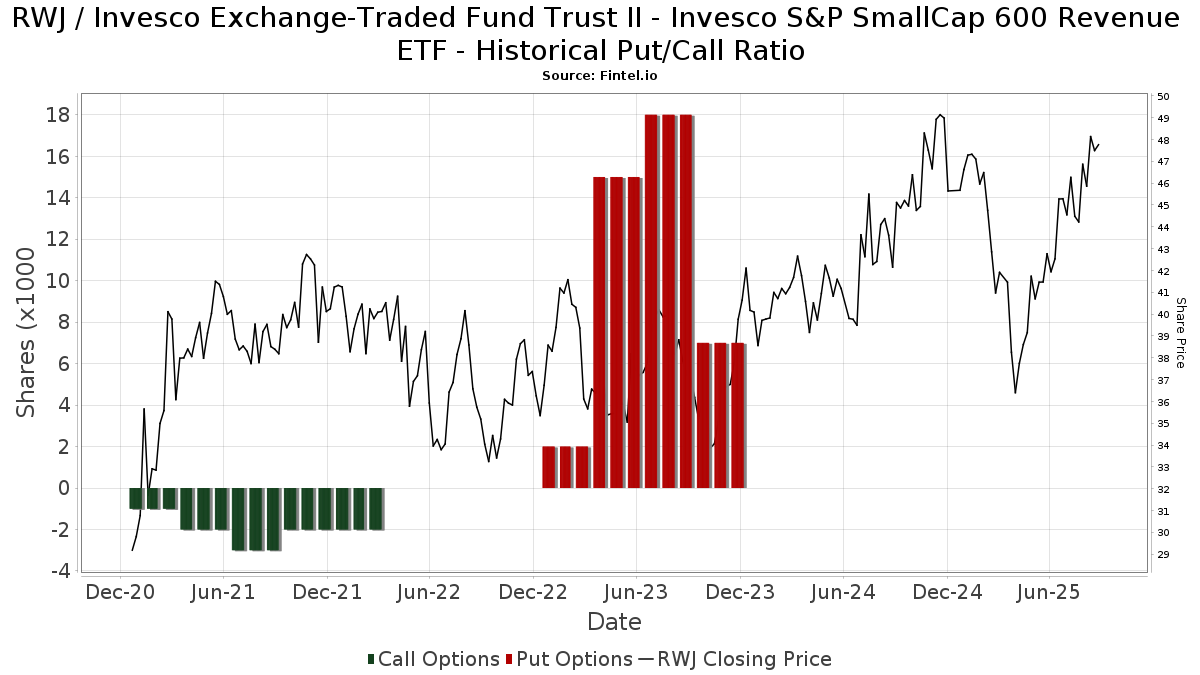
Institutionel Put/Call-forhold
Ud over at indberette standardaktie- og gældsudstedelser skal institutter med mere end 100 mill. aktiver under forvaltning også oplyse deres put- og call-optionsbeholdninger. Da salgsoptioner generelt indikerer negativ stemning, og købsoptioner indikerer positiv stemning, kan vi få en fornemmelse af den overordnede institutionelle stemning ved at plotte forholdet mellem put og kald. Diagrammet til højre viser det historiske put/call-forhold for dette instrument.
Brug af Put/Call Ratio som en indikator for investorernes stemning overvinder en af de vigtigste mangler ved at bruge totalt institutionelt ejerskab, som er, at en betydelig mængde af aktiver under forvaltning investeres passivt for at spore indekser. Passivt forvaltede fonde køber typisk ikke optioner, så indikatoren for put/call-forholdet følger mere nøje følelsen af aktivt forvaltede fonde.
13F og NPORT arkivering
Detaljer om 13F-arkivering er gratis. Detaljer om NP-ansøgninger kræver et premium-medlemskab. Grønne rækker angiver nye positioner. Røde rækker angiver lukkede positioner. Klik på linket ikon for at se den fulde transaktionshistorik.
Opgrader
for at låse premium-data op og eksportere til Excel ![]() .
.
| Fil dato | Kilde | Investor | Type | Gennemsnitlig pris (Øst) |
Aktier | Δ Aktier (%) |
Rapporteret Værdi ($1000) |
Δ Værdi (%) |
Port Alloc (%) |
|
|---|---|---|---|---|---|---|---|---|---|---|
| 2026-02-18 | 13F | Beacon Pointe Advisors, LLC | 7.850 | -1,63 | 382 | -0,78 | ||||
| 2026-04-08 | 13F | Miracle Mile Advisors, LLC | 9.539 | 80,53 | 482 | 87,16 | ||||
| 2026-04-13 | 13F | Hm Payson & Co | 1.254 | 0,00 | 63 | 3,28 | ||||
| 2026-02-11 | 13F | Curio Wealth, Llc | 5 | 0 | ||||||
| 2026-04-14 | 13F | Nbc Securities, Inc. | 268 | 0,00 | 14 | 0,00 | ||||
| 2026-04-09 | 13F | Nelson, Van Denburg & Campbell Wealth Management Group, LLC | 13.878 | 37,07 | 701 | 41,99 | ||||
| 2026-02-11 | 13F | Sunrise Financial Services, LLC | 132.397 | 6.450 | ||||||
| 2026-04-20 | 13F | Kestra Private Wealth Services, Llc | 5.575 | 3,88 | 281 | 7,66 | ||||
| 2026-04-20 | 13F | Obermeyer Wood Investment Counsel, Lllp | 17.284 | 0,05 | 872 | 3,69 | ||||
| 2026-02-17 | 13F | Mercer Global Advisors Inc /adv | 5.543 | -56,86 | 270 | -56,45 | ||||
| 2026-02-17 | 13F | Gladstone Institutional Advisory LLC | 31.423 | 1,28 | 1.531 | 2,14 | ||||
| 2026-02-17 | 13F | Ameriprise Financial Inc | 791.722 | -49,39 | 38.560 | -48,98 | ||||
| 2026-02-04 | 13F | Opinicus Capital, Inc. | 37.028 | 0,08 | 1.804 | 0,95 | ||||
| 2026-02-04 | 13F | Advisor OS, LLC | 7.500 | 0,00 | 365 | 0,83 | ||||
| 2026-02-17 | 13F | Ancora Advisors, LLC | 217.201 | -0,57 | 10.582 | 0,30 | ||||
| 2026-02-12 | 13F | Wealthspire Advisors, LLC | 17.550 | 0,00 | 855 | 0,94 | ||||
| 2026-02-12 | 13F | Great Valley Advisor Group, Inc. | 24.932 | -4,63 | 1.215 | -3,72 | ||||
| 2026-02-13 | 13F | Citigroup Inc | 201 | 0,50 | 10 | 0,00 | ||||
| 2026-04-17 | 13F | Nottingham Advisors, Inc. | 26.680 | 0,00 | 1.347 | 3,62 | ||||
| 2026-01-23 | 13F | Assetmark, Inc | 176 | -0,56 | 9 | 0,00 | ||||
| 2026-02-13 | 13F | MAI Capital Management | 420.428 | 1,07 | 20.483 | 1,95 | ||||
| 2026-02-13 | 13F | Liberty One Investment Management, Llc | 0 | -100,00 | 0 | |||||
| 2026-02-10 | 13F | IAG Wealth Partners, LLC | 0 | -100,00 | 0 | |||||
| 2026-02-17 | 13F | Jones Financial Companies Lllp | 122.047 | 20,15 | 5.946 | 21,64 | ||||
| 2026-04-14 | 13F | Zrc Wealth Management, Llc | 0 | -100,00 | 0 | |||||
| 2026-01-30 | 13F | Citizens Financial Group Inc/ri | 21.063 | -0,03 | 1.026 | 0,88 | ||||
| 2026-02-13 | 13F | Gts Securities Llc | 20.431 | 391,37 | 995 | 397,50 | ||||
| 2025-10-31 | 13F | Sovran Advisors, LLC | 0 | -100,00 | 0 | -100,00 | ||||
| 2026-02-12 | 13F | CIBC Private Wealth Group, LLC | 403 | -1,47 | 20 | 0,00 | ||||
| 2026-02-05 | 13F | Western Wealth Management, LLC | 31.927 | 1,65 | 1.555 | 2,50 | ||||
| 2026-01-15 | 13F | Lodestone Wealth Management LLC | 3.925 | 191 | ||||||
| 2026-02-20 | 13F | Sunbelt Securities, Inc. | 24 | 0,00 | 1 | 0,00 | ||||
| 2026-01-26 | 13F | AE Wealth Management LLC | 239 | -5,91 | 12 | -8,33 | ||||
| 2026-04-23 | 13F | Glass Jacobson Investment Advisors llc | 48 | 0,00 | 2 | 0,00 | ||||
| 2026-02-17 | 13F | Integrity Wealth Advisors, Inc. | 5.972 | -58,58 | 291 | -58,33 | ||||
| 2026-02-17 | 13F | Bank Of America Corp /de/ | 1.235.299 | 2,67 | 60.184 | 3,56 | ||||
| 2026-02-10 | 13F | IFG Advisory, LLC | 14.748 | 719 | ||||||
| 2026-02-17 | 13F | Ameriflex Group, Inc. | 863 | 42 | ||||||
| 2026-02-10 | 13F | Root Financial Partners, LLC | 0 | -100,00 | 0 | |||||
| 2026-02-13 | 13F | Integrated Wealth Concepts LLC | 5.981 | 1,41 | 291 | 2,46 | ||||
| 2026-04-07 | 13F | Farther Finance Advisors, LLC | 4.435 | 0,00 | 224 | 3,70 | ||||
| 2025-11-03 | 13F | Foundations Investment Advisors, LLC | 0 | -100,00 | 0 | |||||
| 2026-02-06 | 13F | Copia Wealth Management | 12.966 | 13,48 | 632 | 14,52 | ||||
| 2026-02-06 | 13F | Larson Financial Group LLC | 11 | 0,00 | 1 | |||||
| 2026-02-13 | 13F | Potentia Wealth | 56.500 | -30,12 | 2.753 | -29,53 | ||||
| 2026-02-04 | 13F | MONECO Advisors, LLC | 56.207 | -17,87 | 2.738 | -17,16 | ||||
| 2026-02-13 | 13F | Kestra Advisory Services, LLC | 0 | -100,00 | 0 | |||||
| 2026-02-09 | 13F | Harbour Investments, Inc. | 123.305 | 10,51 | 6.007 | 11,47 | ||||
| 2026-02-17 | 13F | Aqr Capital Management Llc | 14.681 | 0,00 | 715 | 0,85 | ||||
| 2026-04-24 | 13F | Cyr Financial Inc. | 131.655 | 5,21 | 6.646 | 9,01 | ||||
| 2026-04-14 | 13F | Cathy Pareto & Associates, Inc | 20.358 | -1,89 | 1.028 | 1,68 | ||||
| 2026-02-12 | 13F | Principal Securities, Inc. | 5.177 | -3,40 | 252 | -2,33 | ||||
| 2026-02-03 | 13F | International Assets Investment Management, Llc | 138 | 7 | ||||||
| 2026-02-09 | 13F | Financial Advisory Corp /ut/ /adv | 13.304 | 0,83 | 1 | |||||
| 2026-04-20 | 13F | Sowell Financial Services LLC | 13.636 | -2,93 | 688 | 0,58 | ||||
| 2026-04-21 | 13F | Meridian Financial, LLC | 5.505 | 0,00 | 278 | 3,36 | ||||
| 2026-04-21 | 13F | OneAscent Financial Services LLC | 6.350 | 1,02 | 321 | 4,58 | ||||
| 2026-01-30 | 13F | SK Wealth Management, LLC | 17.617 | -81,51 | 918 | -79,88 | ||||
| 2026-02-04 | 13F | Fusion Family Wealth LLC | 1.478.001 | 2,67 | 72.008 | 3,56 | ||||
| 2026-04-14 | 13F | Wealthcare Advisory Partners LLC | 0 | -100,00 | 0 | |||||
| 2026-02-11 | 13F | Capital Analysts, Inc. | 922 | 0,00 | 0 | |||||
| 2026-02-10 | 13F/A | Northwestern Mutual Wealth Management Co | 327.612 | -2,38 | 15.961 | -1,53 | ||||
| 2026-02-06 | 13F | HighTower Advisors, LLC | 9.198 | 37,08 | 448 | 38,27 | ||||
| 2026-02-13 | 13F | Mariner, LLC | 75.302 | 0,59 | 3.669 | 1,47 | ||||
| 2026-04-14 | 13F | Beacon Investment Advisory Services, Inc. | 1.922 | 97 | ||||||
| 2026-01-30 | 13F | Sigma Planning Corp | 28.344 | -0,39 | 1.381 | 0,44 | ||||
| 2026-04-20 | 13F | SILVER OAK SECURITIES, Inc | 0 | -100,00 | 0 | |||||
| 2026-02-13 | 13F | Ausdal Financial Partners, Inc. | 34.473 | 4,93 | 1.680 | 5,86 | ||||
| 2026-02-17 | 13F | Raymond James Financial Inc | 803.171 | 2,74 | 39.130 | 3,63 | ||||
| 2026-02-10 | 13F | Tidemark, LLC | 350 | -56,36 | 17 | -55,26 | ||||
| 2026-04-10 | 13F | Marshall Financial Group LLC | 12.130 | 0,58 | 612 | 4,26 | ||||
| 2026-01-28 | 13F | Edge Financial Advisors LLC | 28.770 | 0,66 | 1.399 | 1,38 | ||||
| 2025-11-10 | 13F | Lion Street Advisors, LLC | 2.279 | 274 | ||||||
| 2026-02-12 | 13F | Insigneo Advisory Services, Llc | 6.952 | 2,21 | 339 | 3,05 | ||||
| 2026-02-13 | 13F | Aptus Capital Advisors, LLC | 1.755 | -32,47 | 86 | -32,00 | ||||
| 2026-01-26 | 13F | Main Street Group, LTD | 39.533 | -18,50 | 1.926 | -17,76 | ||||
| 2026-02-12 | 13F | Steward Partners Investment Advisory, Llc | 47.342 | -7,77 | 2.307 | -6,98 | ||||
| 2026-02-17 | 13F | Citadel Advisors Llc | 0 | -100,00 | 0 | |||||
| 2026-04-22 | 13F | Janney Montgomery Scott LLC | 22.584 | 2,28 | 1 | 0,00 | ||||
| 2026-02-13 | 13F | Fortis Capital Management LLC | 46.247 | 35,75 | 2.253 | 36,96 | ||||
| 2026-02-10 | 13F | Oxford Wealth Group, LLC | 70.577 | -34,17 | 3.439 | -29,91 | ||||
| 2026-01-22 | 13F | Bartlett & Co. Wealth Management Llc | 15 | 0,00 | 1 | |||||
| 2026-01-29 | 13F | MWA Asset Management | 5.436 | -12,97 | 265 | -12,29 | ||||
| 2026-02-11 | 13F | Jpmorgan Chase & Co | 38.259 | -3,91 | 1.864 | -3,07 | ||||
| 2026-02-10 | 13F | Natixis Advisors, L.p. | 10.395 | 1 | ||||||
| 2026-01-05 | 13F | Chesapeake Asset Management Llc | 0 | -100,00 | 0 | -100,00 | ||||
| 2026-02-17 | 13F | Fairscale Capital, LLC | 36 | 0,00 | 2 | 0,00 | ||||
| 2026-02-06 | 13F | Pnc Financial Services Group, Inc. | 1.125 | 0,00 | 55 | 0,00 | ||||
| 2026-01-20 | 13F | Pine Harbor Wealth Management, LLC | 6.909 | 0,00 | 337 | 0,90 | ||||
| 2026-04-09 | 13F | DHJJ Financial Advisors, Ltd. | 108 | 0,00 | 5 | 0,00 | ||||
| 2026-02-11 | 13F | LPL Financial LLC | 2.840.650 | -2,92 | 138.396 | -2,08 | ||||
| 2026-02-17 | 13F | Private Advisor Group, LLC | 196.918 | -1,20 | 9.594 | -0,34 | ||||
| 2026-01-21 | 13F | Flagship Harbor Advisors, Llc | 3.735 | 182 | ||||||
| 2026-02-04 | 13F | Tsfg, Llc | 11.613 | 0,03 | 1 | |||||
| 2026-01-23 | 13F | Guidance Capital, Inc | 46.324 | 44,74 | 2.467 | 57,07 | ||||
| 2026-02-10 | 13F | Moors & Cabot, Inc. | 10.742 | -28,81 | 523 | -28,16 | ||||
| 2026-01-29 | 13F | Sanctuary Advisors, LLC | 42.936 | -0,81 | 2.092 | 0,05 | ||||
| 2026-02-13 | 13F | Brown Advisory Inc | 14.541 | 7,90 | 708 | 8,92 | ||||
| 2026-01-26 | 13F | Cwm, Llc | 1.657 | -24,92 | 0 | |||||
| 2026-01-29 | 13F | Comerica Bank | 3.537 | 6,44 | 172 | 7,50 | ||||
| 2026-02-17 | 13F | Cetera Investment Advisers | 134.032 | 2,05 | 6.530 | 2,95 | ||||
| 2026-02-02 | 13F | Truist Financial Corp | 20.218 | -12,52 | 985 | -11,74 | ||||
| 2026-02-17 | 13F | Creative Planning | 29.803 | -3,29 | 1.452 | -2,42 | ||||
| 2026-02-05 | 13F | AlphaCore Capital LLC | 927 | 341,43 | 45 | 350,00 | ||||
| 2026-01-14 | 13F | ORG Partners LLC | 3.420 | 41,32 | 167 | 43,10 | ||||
| 2025-11-12 | 13F | Aviso Financial Inc. | 0 | -100,00 | 0 | -100,00 | ||||
| 2026-02-06 | 13F | GPS Wealth Strategies Group, LLC | 0 | -100,00 | 0 | |||||
| 2026-04-13 | 13F | Kmg Fiduciary Partners, Llc | 8.603 | -0,02 | 434 | 3,58 | ||||
| 2026-01-29 | 13F | Klingman & Associates, LLC | 28.269 | 0,00 | 1.377 | 0,88 | ||||
| 2026-04-21 | 13F | Claro Advisors LLC | 15.691 | 0,22 | 792 | 3,94 | ||||
| 2025-11-14 | 13F | Two Sigma Securities, Llc | 0 | -100,00 | 0 | -100,00 | ||||
| 2026-02-12 | 13F | Bank Of Montreal /can/ | 6.828 | 0,01 | 333 | 0,30 | ||||
| 2026-02-26 | 13F | Anchor Investment Management, LLC | 777 | 0,00 | 38 | 0,00 | ||||
| 2026-02-17 | 13F | Russell Investments Group, Ltd. | 196 | -7,11 | 10 | -10,00 | ||||
| 2026-02-17 | 13F | Hilltop Holdings Inc. | 18.837 | 0,19 | 918 | 0,99 | ||||
| 2026-01-12 | 13F | CVA Family Office, LLC | 124 | 0,00 | 6 | 20,00 | ||||
| 2026-02-12 | 13F | Commonwealth Equity Services, Llc | 272.289 | -18,53 | 13.266 | 82.806,25 | ||||
| 2026-04-21 | 13F | Retirement Planning Group, Llc / Ny | 11.825 | -0,98 | 597 | 2,58 | ||||
| 2026-01-27 | 13F | Belpointe Asset Management LLC | 48.880 | 25,31 | 2.381 | 26,38 | ||||
| 2026-01-28 | 13F | Geneos Wealth Management Inc. | 14.758 | -9,70 | 719 | -8,87 | ||||
| 2026-04-20 | 13F | YANKCOM Partnership | 390 | 20 | ||||||
| 2026-02-12 | 13F | Founders Financial Alliance, LLC | 240 | 12 | ||||||
| 2026-02-10 | 13F | Goldman Sachs Group Inc | 60.000 | -15,19 | 2.923 | -14,46 | ||||
| 2026-02-13 | 13F | Mml Investors Services, Llc | 62.527 | 8,43 | 3.046 | 9,37 | ||||
| 2026-02-04 | 13F | Byrne Financial Freedom, Llc | 4.561 | -0,70 | 222 | 0,45 | ||||
| 2026-02-13 | 13F | Wells Fargo & Company/mn | 424.856 | -1,02 | 20.699 | -0,16 | ||||
| 2026-04-15 | 13F | Nations Financial Group Inc, /ia/ /adv | 10.613 | -0,02 | 536 | 3,48 | ||||
| 2026-02-05 | 13F | Pacific Sun Financial Corp | 40.524 | -0,08 | 1.974 | 0,82 | ||||
| 2026-01-23 | 13F | Ogorek Anthony Joseph /ny/ /adv | 422 | 0,24 | 0 | |||||
| 2026-01-12 | 13F | World Equity Group, Inc. | 6.429 | 0,27 | 313 | 1,29 | ||||
| 2026-04-16 | 13F | Balboa Wealth Partners | 4.794 | 14,91 | 242 | 19,21 | ||||
| 2026-02-06 | 13F | Global Retirement Partners, LLC | 21.500 | 3,22 | 1.047 | 4,08 | ||||
| 2026-02-13 | 13F | Alerus Financial Na | 73 | 0,00 | 4 | 0,00 | ||||
| 2026-02-17 | 13F | Strive Financial Group ,LLC | 37.319 | 1.818 | ||||||
| 2026-01-20 | 13F | Stratos Wealth Partners, LTD. | 11.889 | -19,14 | 579 | -18,45 | ||||
| 2026-02-17 | 13F | Warren Averett Asset Management, LLC | 4.469 | 0,00 | 218 | 0,93 | ||||
| 2026-04-08 | 13F | Wealth Enhancement Advisory Services, Llc | 133.650 | -35,32 | 6.779 | -35,46 | ||||
| 2026-02-13 | 13F | Stifel Financial Corp | 37.186 | 72,91 | 1.812 | 74,47 | ||||
| 2026-04-24 | 13F | James Investment Research Inc | 40.984 | -1,03 | 2.069 | 2,53 | ||||
| 2026-04-15 | 13F | Parsons Capital Management Inc/ri | 5.850 | 0,00 | 295 | 3,51 | ||||
| 2026-02-17 | 13F | Captrust Financial Advisors | 8.222 | 0,01 | 401 | 0,76 | ||||
| 2026-01-23 | 13F | Bowman & Co S.C. | 23.197 | 0,05 | 1.130 | 0,98 | ||||
| 2026-02-17 | 13F | Advisor Group Holdings, Inc. | 559.252 | -3,45 | 27.255 | -1,99 | ||||
| 2026-02-11 | 13F | Montis Financial, LLC | 5.030 | -14,70 | 245 | -13,73 | ||||
| 2026-02-11 | 13F | First Command Advisory Services, Inc. | 3.567 | 0,00 | 174 | 0,58 | ||||
| 2026-02-09 | 13F | Valued Retirements, Inc. | 58.859 | -5,82 | 2.868 | 5,99 | ||||
| 2026-02-12 | 13F | Burke & Herbert Bank & Trust Co | 4.726 | 230 | ||||||
| 2026-02-05 | 13F | Atria Investments Llc | 19.953 | -36,01 | 972 | -35,42 | ||||
| 2026-04-14 | 13F | Nova Wealth Management, Inc. | 5.829 | 30,46 | 294 | 35,48 | ||||
| 2026-02-17 | 13F | Fmr Llc | 9.501 | 55,14 | 463 | 56,61 | ||||
| 2026-02-04 | 13F | Pensionmark Financial Group, Llc | 0 | -100,00 | 0 | |||||
| 2026-02-11 | 13F | Fiera Capital Corp | 7.851 | 0,00 | 383 | 0,79 | ||||
| 2025-11-06 | 13F | Financial Advocates Investment Management | 0 | -100,00 | 0 | -100,00 | ||||
| 2026-02-17 | 13F | Hall Capital Management Co Inc | 6.700 | 0,00 | 326 | 0,93 | ||||
| 2026-02-17 | 13F | Susquehanna International Group, Llp | 0 | -100,00 | 0 | |||||
| 2026-02-11 | 13F | Cornerstone Financial Group, LLC /NE/ | 7.355 | 0,29 | 358 | 1,13 | ||||
| 2026-02-12 | 13F | Brinker Capital Investments, LLC | 16.377 | 2,54 | 798 | 3,37 | ||||
| 2026-01-29 | 13F | UBS Group AG | 776.161 | -4,97 | 37.815 | -4,15 | ||||
| 2026-02-23 | 13F | Sonoma Allocations LLC | 45.334 | -1,77 | 2.387 | 8,45 | ||||
| 2026-02-14 | 13F | New Insight Wealth Advisors | 9.615 | -4,26 | 468 | -3,51 | ||||
| 2026-02-17 | 13F | Advisory Services Network, LLC | 0 | -100,00 | 0 | |||||
| 2026-04-16 | 13F | Consolidated Planning Corp | 319.178 | -12,79 | 16.112 | -9,64 | ||||
| 2026-02-12 | 13F | Jane Street Group, Llc | 0 | -100,00 | 0 | |||||
| 2026-02-03 | 13F | Vantage Financial Partners, LLC | 30.532 | -1,20 | 1.488 | -0,34 | ||||
| 2026-04-16 | 13F | Swisher Financial Concepts, Inc. | 10.534 | -2,15 | 532 | 1,34 | ||||
| 2026-02-13 | 13F | Planwiser Financial, Llc | 38.011 | 1.852 | ||||||
| 2026-04-24 | 13F | Key FInancial Inc | 14.112 | 29,07 | 712 | 33,83 | ||||
| 2026-02-11 | 13F | Ameritas Investment Partners, Inc. | 20.009 | 975 | ||||||
| 2026-04-10 | 13F | First Bank & Trust | 31.078 | 38,09 | 1.569 | 43,07 | ||||
| 2026-02-18 | 13F | Garton & Associates Financial Advisors LLC | 6 | 0 | ||||||
| 2026-01-21 | 13F | Prime Capital Investment Advisors, LLC | 34.478 | 1,17 | 1.680 | 2,00 | ||||
| 2026-02-18 | 13F | GWM Advisors LLC | 42.090 | 16,94 | 2.051 | 17,95 | ||||
| 2026-01-26 | 13F | Private Trust Co Na | 622 | -30,89 | 30 | -30,23 | ||||
| 2025-11-06 | 13F | Onyx Bridge Wealth Group LLC | 0 | -100,00 | 0 | |||||
| 2026-02-10 | 13F | Envestnet Asset Management Inc | 120.694 | 3,46 | 5.880 | 4,37 | ||||
| 2026-04-15 | 13F | Merit Financial Group, LLC | 9.344 | 472 | ||||||
| 2025-10-30 | 13F | WFA Asset Management Corp | 226.568 | -11,69 | 10.356 | 0,74 | ||||
| 2026-02-12 | 13F | Titleist Asset Management, Llc | 4.786 | -1,75 | 233 | -0,85 | ||||
| 2026-02-05 | 13F | Bessemer Group Inc | 0 | -100,00 | 0 | |||||
| 2026-02-17 | 13F | Signature Equity Partners, LLC | 360 | 18 | ||||||
| 2026-04-16 | 13F | Annex Advisory Services, LLC | 7.128 | 360 | ||||||
| 2026-02-04 | 13F | Ameritas Advisory Services, LLC | 0 | -100,00 | 0 | |||||
| 2026-02-10 | 13F | Bnp Paribas Arbitrage, Sa | 204 | -98,99 | 10 | -99,08 | ||||
| 2026-04-15 | 13F | Signature Estate & Investment Advisors Llc | 4.748 | 0,34 | 240 | 3,91 | ||||
| 2026-02-13 | 13F | Greenline Wealth Management LLC | 637 | 31 | ||||||
| 2026-01-29 | 13F | S.A. Mason LLC | 8.425 | 0,00 | 410 | 0,99 | ||||
| 2026-02-10 | 13F | Thoroughbred Financial Services, Llc | 27.980 | 0,15 | 1 | 0,00 | ||||
| 2026-02-13 | 13F | Morgan Stanley | 2.214.246 | 5,94 | 107.878 | 6,86 | ||||
| 2026-02-17 | 13F | Wiley Bros.-aintree Capital, Llc | 125.635 | -1,72 | 6.121 | -1,05 | ||||
| 2026-02-13 | 13F | Colony Group, LLC | 525.416 | 15,98 | 25.598 | 16,99 | ||||
| 2026-02-13 | 13F | Marshall Wace, Llp | 7.929 | 386 | ||||||
| 2026-02-14 | 13F | Rockefeller Capital Management L.P. | 43.524 | 16,08 | 2.121 | 17,06 | ||||
| 2025-11-14 | 13F | NorthRock Partners, LLC | 0 | -100,00 | 0 | -100,00 | ||||
| 2026-02-17 | 13F | Equitable Holdings, Inc. | 9.746 | -16,35 | 475 | -15,66 | ||||
| 2026-04-17 | 13F | RFG Advisory, LLC | 8.896 | 449 | ||||||
| 2026-02-06 | 13F | Covestor Ltd | 0 | 0 | ||||||
| 2026-04-23 | 13F | J.w. Cole Advisors, Inc. | 4.468 | 0,38 | 226 | 4,17 | ||||
| 2026-02-18 | 13F | EP Wealth Advisors, Inc. | 8.649 | -23,40 | 421 | -13,73 | ||||
| 2026-02-10 | 13F | Adapt Wealth Advisors, Llc | 21.457 | -38,18 | 1.045 | -37,65 | ||||
| 2026-04-13 | 13F | IFP Advisors, Inc | 130.793 | 27,23 | 6.602 | 31,83 | ||||
| 2026-04-13 | 13F | Creative Financial Designs Inc /adv | 1.948 | 0,00 | 98 | 4,26 | ||||
| 2026-04-24 | 13F | UMA Financial Services, Inc. | 6 | 0,00 | 0 | |||||
| 2026-02-17 | 13F | Royal Bank Of Canada | 140.501 | -43,42 | 6.846 | -42,92 | ||||
| 2026-04-07 | 13F | CoreCap Advisors, LLC | 60.572 | 3,19 | 3.057 | 6,93 | ||||
| 2026-04-09 | 13F | Whitaker-Myers Wealth Managers, LTD. | 6.949 | -4,60 | 351 | -1,13 | ||||
| 2026-02-14 | 13F | Whipplewood Advisors, LLC | 3.270 | 0,00 | 159 | 1,27 | ||||
| 2025-10-27 | 13F | Kiker Wealth Management, LLC | 0 | -100,00 | 0 | -100,00 | ||||
| 2026-02-13 | 13F | Perspective Wealth Advisors Llc | 38.011 | 1.852 | ||||||
| 2026-01-30 | 13F | Us Bancorp \de\ | 2.421 | 7,08 | 118 | 7,34 | ||||
| 2025-11-14 | 13F | Hrt Financial Lp | 0 | -100,00 | 0 | |||||
| 2026-02-04 | 13F | Legacy Financial Advisors, Inc. | 32.637 | 2,07 | 1.590 | 2,98 | ||||
| 2026-04-22 | 13F | Patriot Financial Group Insurance Agency, LLC | 75.170 | 106,09 | 3.795 | 113,51 | ||||
| 2026-04-15 | 13F | Trust Co Of Toledo Na /oh/ | 6.365 | 0,00 | 321 | 3,55 | ||||
| 2026-04-09 | 13F | Tompkins Financial Corp | 456 | 0,00 | 23 | 4,55 | ||||
| 2026-02-05 | 13F | Proactive Wealth Strategies LLC | 6.150 | -2,43 | 300 | -1,64 | ||||
| 2026-02-11 | 13F | Cerity Partners LLC | 20.231 | 2,78 | 986 | 3,68 | ||||
| 2026-02-05 | 13F | Cambridge Investment Research Advisors, Inc. | 119.530 | -13,69 | 6 | -16,67 | ||||
| 2026-02-05 | 13F | Allworth Financial LP | 2.397 | 200,75 | 117 | 205,26 | ||||
| 2026-04-23 | 13F | Oppenheimer & Co Inc | 4.670 | 236 |