Grundlæggende statistik
| Institutionelle aktier (lange) | 62.502.184 - 99,96% (ex 13D/G) - change of 0,75MM shares 1,21% MRQ |
| Institutionel værdi (lang) | $ 1.495.664 USD ($1000) |
Institutionelt ejerskab og aktionærer
uniQure N.V. (US:QURE) har 254 institutionelle ejere og aktionærer, der har indsendt 13D/G- eller 13F-formularer til Securities Exchange Commission (SEC). Disse institutioner har i alt 62,505,625 aktier. Største aktionærer omfatter Fmr Llc, Avoro Capital Advisors LLC, Rtw Investments, Lp, Standard Life Aberdeen plc, State Street Corp, Jpmorgan Chase & Co, Susquehanna International Group, Llp, BlackRock, Inc., Two Sigma Investments, Lp, and MPM Oncology Impact Management LP .
uniQure N.V. (NasdaqGS:QURE) institutionel ejerskabsstruktur viser aktuelle positioner i virksomheden efter institutioner og fonde, samt seneste ændringer i positionsstørrelse. Større aktionærer kan omfatte individuelle investorer, investeringsforeninger, hedgefonde eller institutioner. Skema 13D angiver, at investoren besidder (eller besidder) mere end 5 % af virksomheden og har til hensigt (eller har til hensigt at) aktivt at forfølge en ændring i forretningsstrategi. Skema 13G indikerer en passiv investering på over 5%.
The share price as of March 13, 2026 is 15,53 / share. Previously, on March 14, 2025, the share price was 14,20 / share. This represents an increase of 9,37% over that period.

Fondens stemningsscore
Fund Sentiment Score (fka Ownership Accumulation Score) finder de aktier, der bliver mest købt af fonde. Det er resultatet af en sofistikeret, multi-faktor kvantitativ model, der identificerer virksomheder med de højeste niveauer af institutionel akkumulering. Scoringsmodellen bruger en kombination af den samlede stigning i oplyste ejere, ændringerne i porteføljeallokeringer i disse ejere og andre målinger. Tallet går fra 0 til 100, hvor højere tal indikerer et højere niveau af akkumulering for sine jævnaldrende, og 50 er gennemsnittet.
Opdateringsfrekvens: Dagligt
Se Ownership Explorer, som giver en liste over højest rangerende virksomheder.
AI+ Ask Fintel’s AI assistant about uniQure N.V..
Select a question to share a public post with an AI-crafted answer.
Thinking of good questions…
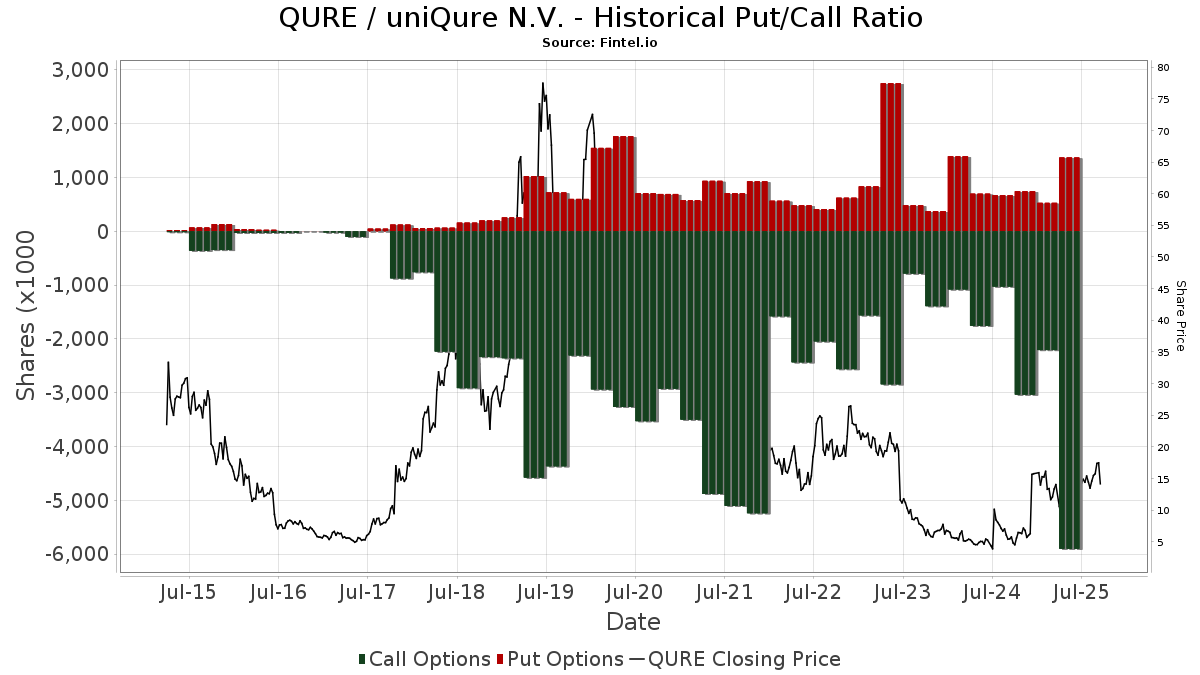
Institutionel Put/Call-forhold
Ud over at indberette standardaktie- og gældsudstedelser skal institutter med mere end 100 mill. aktiver under forvaltning også oplyse deres put- og call-optionsbeholdninger. Da salgsoptioner generelt indikerer negativ stemning, og købsoptioner indikerer positiv stemning, kan vi få en fornemmelse af den overordnede institutionelle stemning ved at plotte forholdet mellem put og kald. Diagrammet til højre viser det historiske put/call-forhold for dette instrument.
Brug af Put/Call Ratio som en indikator for investorernes stemning overvinder en af de vigtigste mangler ved at bruge totalt institutionelt ejerskab, som er, at en betydelig mængde af aktiver under forvaltning investeres passivt for at spore indekser. Passivt forvaltede fonde køber typisk ikke optioner, så indikatoren for put/call-forholdet følger mere nøje følelsen af aktivt forvaltede fonde.
13D/G-arkivering
Vi præsenterer 13D/G ansøgninger separat fra 13F ansøgninger på grund af den forskellige behandling af SEC. 13D/G-ansøgninger kan indgives af grupper af investorer (med én ledende), hvorimod 13F-ansøgninger ikke kan. Dette resulterer i situationer, hvor en investor kan indsende en 13D/G, der rapporterer én værdi for de samlede aktier (der repræsenterer alle de aktier, der ejes af investorgruppen), men derefter indsender en 13F, der rapporterer en anden værdi for de samlede aktier (der udelukkende repræsenterer deres egne) ejendomsret). Det betyder, at aktieejerskab af 13D/G-arkiver og 13F-arkiveringer ofte ikke er direkte sammenlignelige, så vi præsenterer dem separat.
Bemærk: Fra den 16. maj 2021 viser vi ikke længere ejere, der ikke har indsendt en 13D/G inden for det seneste år. Tidligere viste vi den fulde historie af 13D/G-arkiver. Generelt skal enheder, der er forpligtet til at indgive 13D/G-ansøgninger, indgive mindst årligt, før de indsender en afsluttende ansøgning. Dog forlader fonde nogle gange positioner uden at indsende en afsluttende ansøgning (dvs. de afvikler), så visning af den fulde historie resulterede nogle gange i forvirring om det nuværende ejerskab. For at undgå forvirring viser vi nu kun 'aktuelle' ejere - det vil sige - ejere, der har anmeldt inden for det seneste år.
Upgrade to unlock premium data.
| Fil dato | Form | Investor | Forrige Aktier |
Seneste Aktier |
Δ Aktier (Procent) |
Ejendomsret (Procent) |
Δ Ejerskab (Procent) |
|
|---|---|---|---|---|---|---|---|---|
| 2026-02-17 | RTW INVESTMENTS, LP | 4,424,968 | 3,711,462 | -16.12 | 6.00 | -16.67 | ||
| 2026-02-17 | Avoro Capital Advisors LLC | 3,625,000 | 6,150,000 | 69.66 | 9.87 | 49.55 | ||
| 2026-02-17 | EcoR1 Capital, LLC | 3,632,087 | 0 | -100.00 | 0.00 | -100.00 | ||
| 2026-02-13 | SUSQUEHANNA SECURITIES, LLC | 3,536,485 | 5.70 | |||||
| 2026-02-09 | STATE STREET CORP | 174,902 | 3,231,043 | 1,747.34 | 5.20 | 1,200.00 | ||
| 2026-01-29 | Standard Life Aberdeen plc | 2,939,743 | 3,678,640 | 25.13 | 5.91 | 23.90 | ||
| 2025-11-14 | Vestal Point Capital, LP | 3,700,000 | 225,000 | -93.92 | 0.40 | -94.12 | ||
| 2025-11-05 | FMR LLC | 48,782 | 6,059,573 | 12,321.74 | 9.80 | 9,507.84 | ||
| 2025-08-14 | Nantahala Capital Management, LLC | 2,982,013 | 2,051,852 | -31.19 | 3.75 | -38.76 |
13F og NPORT arkivering
Detaljer om 13F-arkivering er gratis. Detaljer om NP-ansøgninger kræver et premium-medlemskab. Grønne rækker angiver nye positioner. Røde rækker angiver lukkede positioner. Klik på linket ikon for at se den fulde transaktionshistorik.
Opgrader
for at låse premium-data op og eksportere til Excel ![]() .
.
| Fil dato | Kilde | Investor | Type | Gennemsnitlig pris (Øst) |
Aktier | Δ Aktier (%) |
Rapporteret Værdi ($1000) |
Δ Værdi (%) |
Port Alloc (%) |
|
|---|---|---|---|---|---|---|---|---|---|---|
| 2026-02-17 | 13F | Resolute Capital Asset Partners LLC | 0 | -100,00 | 0 | -100,00 | ||||
| 2025-11-14 | 13F | Point72 Europe (London) LLP | 1.552 | 91 | ||||||
| 2025-09-24 | NP | SWTSX - Schwab Total Stock Market Index Fund This fund is a listed as child fund of Charles Schwab Investment Management Inc and if that institution has disclosed ownership in this security, then these positions will not be double counted when calculating total shares and total value | 23.627 | 0,00 | 329 | -5,75 | ||||
| 2026-02-10 | 13F | Bank of New York Mellon Corp | 43.309 | 94,99 | 1.036 | -20,06 | ||||
| 2026-02-17 | 13F | J. Goldman & Co LP | Call | 20.300 | -69,93 | 486 | -87,69 | |||
| 2026-01-09 | 13F | SG Americas Securities, LLC | 64.326 | 508,05 | 2 | |||||
| 2026-02-12 | 13F | Aristides Capital LLC | 0 | -100,00 | 0 | |||||
| 2026-01-13 | 13F | CoreCap Advisors, LLC | 19 | 0 | ||||||
| 2026-02-09 | 13F | Sectoral Asset Management Inc | 30.585 | -0,50 | 732 | -59,25 | ||||
| 2026-02-12 | 13F | Hrt Financial Lp | 156.000 | 4 | ||||||
| 2026-02-17 | 13F | Massar Capital Management, LP | 40.529 | 102,64 | 970 | -16,97 | ||||
| 2026-02-13 | 13F | Quinn Opportunity Partners LLC | 10.000 | -90,71 | 239 | -96,19 | ||||
| 2026-01-29 | 13F | Vanguard Group Inc | 1.051.379 | -6,55 | 25.160 | -61,69 | ||||
| 2026-02-11 | 13F | Jpmorgan Chase & Co | 2.934.626 | 155,33 | 70.226 | 4,68 | ||||
| 2026-02-17 | 13F | Atom Investors LP | 78.209 | 65,38 | 1.872 | -32,21 | ||||
| 2026-02-17 | 13F | J. Goldman & Co LP | 20.250 | 485 | ||||||
| 2026-02-17 | 13F | Advisor Group Holdings, Inc. | 587 | 428,83 | 14 | 133,33 | ||||
| 2026-02-17 | 13F | Tudor Investment Corp Et Al | Call | 23.800 | 29,35 | 570 | -47,02 | |||
| 2026-02-17 | 13F | Tudor Investment Corp Et Al | Put | 102.100 | 470,39 | 2.443 | 134,00 | |||
| 2026-02-17 | 13F | Tudor Investment Corp Et Al | 74.036 | 157,81 | 1.772 | 5,67 | ||||
| 2026-02-17 | 13F/A | Militia Capital Partners, LP | 8.500 | -75,71 | 203 | -90,06 | ||||
| 2026-01-23 | 13F | Assetmark, Inc | 18.613 | 445 | ||||||
| 2026-03-09 | 13F | Flax Pond Capital, Llc | 146.498 | 3.506 | ||||||
| 2026-01-27 | 13F | First Horizon Corp | 3 | -99,22 | 0 | -100,00 | ||||
| 2025-09-26 | NP | ISCG - iShares Morningstar Small-Cap Growth ETF | 6.145 | 86 | ||||||
| 2026-02-13 | 13F | Peak6 Llc | Put | 7.000 | 168 | |||||
| 2026-01-30 | 13F | Torren Management, LLC | 1.169 | 28 | ||||||
| 2026-02-03 | 13F | SBI Securities Co., Ltd. | 280 | -75,40 | 7 | -90,91 | ||||
| 2026-02-13 | 13F | Peak6 Llc | Call | 179.500 | 1.517,12 | 4.295 | 563,83 | |||
| 2025-11-14 | 13F | 683 Capital Management, LLC | Put | 0 | -100,00 | 0 | -100,00 | |||
| 2026-02-17 | 13F | Woodline Partners LP | 0 | -100,00 | 0 | |||||
| 2026-02-06 | 13F | Handelsbanken Fonder AB | 14.900 | 0 | ||||||
| 2026-02-17 | 13F | Northern Trust Corp | 168.820 | 10,75 | 4.040 | -54,60 | ||||
| 2026-02-13 | 13F | Y-Intercept (Hong Kong) Ltd | 45.778 | 101,63 | 1.095 | -17,36 | ||||
| 2025-11-13 | 13F | Pale Fire Capital SE | 0 | -100,00 | 0 | -100,00 | ||||
| 2026-01-14 | 13F | ORG Partners LLC | 114 | 3 | ||||||
| 2026-02-17 | 13F | Clearline Capital LP | 83.681 | 2.002 | ||||||
| 2025-11-14 | 13F | Avidity Partners Management LP | 0 | -100,00 | 0 | |||||
| 2026-02-13 | 13F | Lord, Abbett & Co. Llc | 0 | -100,00 | 0 | |||||
| 2026-02-17 | 13F | Jones Financial Companies Lllp | 418 | -31,36 | 10 | -69,70 | ||||
| 2026-02-17 | 13F | StemPoint Capital LP | 43.485 | -91,67 | 1.041 | -96,59 | ||||
| 2026-02-13 | 13F | Umb Bank N A/mo | 200 | 0,00 | 5 | -63,64 | ||||
| 2026-02-13 | 13F | Macquarie Group Ltd | 0 | -100,00 | 0 | |||||
| 2026-02-17 | 13F | Engineers Gate Manager LP | 43.356 | 1.038 | ||||||
| 2026-01-28 | 13F | Klp Kapitalforvaltning As | 8.400 | 0,00 | 201 | -58,98 | ||||
| 2026-02-17 | 13F | Moore Capital Management, Lp | 75.000 | 1.795 | ||||||
| 2026-02-17 | 13F | Susquehanna International Group, Llp | Put | 498.800 | -43,57 | 11.936 | -76,87 | |||
| 2026-01-28 | 13F | Teacher Retirement System Of Texas | 0 | -100,00 | 0 | |||||
| 2026-02-17 | 13F | Susquehanna International Group, Llp | Call | 2.251.400 | 147,84 | 53.876 | 1,61 | |||
| 2026-02-17 | 13F | Orbimed Advisors Llc | 737.400 | 60,83 | 17.646 | -34,07 | ||||
| 2026-02-17 | 13F | Susquehanna International Group, Llp | 1.218.350 | 440,19 | 29.155 | 121,48 | ||||
| 2026-02-17 | 13F | Longaeva Partners L.P. | 0 | -100,00 | 0 | |||||
| 2026-02-11 | 13F | Group One Trading, L.p. | Put | 110.700 | -76,10 | 2.649 | -90,20 | |||
| 2026-02-13 | 13F | MAI Capital Management | 28 | 154,55 | 1 | |||||
| 2026-02-11 | 13F | Group One Trading, L.p. | Call | 845.800 | 95,33 | 20.240 | -19,92 | |||
| 2026-02-12 | 13F | BlackRock, Inc. | 1.974.988 | 36,57 | 47.261 | -44,01 | ||||
| 2026-02-13 | 13F | Stifel Financial Corp | 45.987 | -21,09 | 1.100 | -67,66 | ||||
| 2026-01-20 | 13F | Signaturefd, Llc | 249 | 0,00 | 6 | -64,29 | ||||
| 2026-02-13 | 13F | Walleye Trading LLC | 7.657 | -83,82 | 183 | -93,37 | ||||
| 2026-02-13 | 13F | JustInvest LLC | 12.356 | -0,67 | 296 | -59,37 | ||||
| 2026-02-13 | 13F | Walleye Trading LLC | Put | 18.200 | 1.416,67 | 436 | 521,43 | |||
| 2026-02-13 | 13F | Walleye Trading LLC | Call | 23.900 | 1,27 | 572 | -58,53 | |||
| 2026-02-13 | 13F | Walleye Capital LLC | 78.996 | -23,24 | 1.890 | -68,53 | ||||
| 2026-02-13 | 13F | Walleye Capital LLC | Call | 33.600 | 18,31 | 804 | -51,48 | |||
| 2025-11-14 | 13F | Susquehanna Fundamental Investments, Llc | 0 | -100,00 | 0 | -100,00 | ||||
| 2026-02-17 | 13F | Bellevue Group AG | 4.763 | 0,00 | 114 | -59,35 | ||||
| 2026-01-30 | 13F | Us Bancorp \de\ | 6.171 | 775,32 | 148 | 258,54 | ||||
| 2026-02-17 | 13F | California State Teachers Retirement System | 35.947 | 14,81 | 860 | -52,93 | ||||
| 2026-02-17 | 13F | Janus Henderson Group Plc | 16.900 | -15,08 | 404 | -65,20 | ||||
| 2026-02-12 | 13F | Ensign Peak Advisors, Inc | 3.650 | 21,67 | 87 | -50,29 | ||||
| 2026-02-03 | 13F | Mitsubishi UFJ Kokusai Asset Management Co., Ltd. | 8.098 | -47,59 | 189 | -79,02 | ||||
| 2026-01-08 | 13F | Grove Bank & Trust | 0 | -100,00 | 0 | -100,00 | ||||
| 2026-02-13 | 13F | Walleye Capital LLC | Put | 29.300 | 1.231,82 | 701 | 447,66 | |||
| 2026-02-11 | 13F | LPL Financial LLC | 21.969 | -52,36 | 526 | -80,49 | ||||
| 2026-02-12 | 13F | Jane Street Group, Llc | Put | 36.500 | -92,78 | 873 | -97,04 | |||
| 2026-02-13 | 13F | DLD Asset Management, LP | Call | 10.000 | -83,44 | 239 | -93,22 | |||
| 2026-02-13 | 13F | Wells Fargo & Company/mn | 70.236 | 547,75 | 1.681 | 165,82 | ||||
| 2026-02-12 | 13F | Jane Street Group, Llc | Call | 354.400 | -44,50 | 8.481 | -77,25 | |||
| 2025-11-14 | 13F | Integral Health Asset Management, LLC | 600.000 | -55,56 | 35.022 | 86,10 | ||||
| 2026-01-14 | 13F | Hennion & Walsh Asset Management, Inc. | 67.739 | 31,24 | 1.621 | -46,22 | ||||
| 2025-11-14 | 13F | Main Management ETF Advisors, LLC | 0 | -100,00 | 0 | |||||
| 2026-02-17 | 13F | Owl Creek Asset Management, L.P. | 0 | -100,00 | 0 | -100,00 | ||||
| 2025-11-14 | 13F | Goldman Sachs Group Inc | Call | 0 | -100,00 | 0 | -100,00 | |||
| 2026-02-11 | 13F | Parallel Advisors, LLC | 848 | 20 | ||||||
| 2026-02-17 | 13F | Apis Capital Advisors, LLC | 0 | -100,00 | 0 | |||||
| 2026-02-17 | 13F | Two Sigma Advisers, Lp | 1.110.400 | 171,16 | 26.572 | 11,17 | ||||
| 2026-02-10 | 13F | Monaco Asset Management SAM | 25.000 | -37,36 | 598 | -74,32 | ||||
| 2026-02-17 | 13F | Ikarian Capital, LLC | Call | 105.400 | -80,32 | 2.522 | -91,93 | |||
| 2026-02-17 | 13F | Ikarian Capital, LLC | 91.060 | 55,37 | 2.179 | -36,31 | ||||
| 2025-11-13 | 13F | UBS Group AG | Call | 0 | -100,00 | 0 | -100,00 | |||
| 2026-02-13 | 13F | Citigroup Inc | 184.765 | 1.496,24 | 4.421 | 554,96 | ||||
| 2026-02-12 | 13F | Ci Investments Inc. | 37.841 | -20,23 | 906 | 45.150,00 | ||||
| 2026-02-13 | 13F | Citigroup Inc | Call | 30.000 | 0,00 | 718 | -59,05 | |||
| 2026-02-13 | 13F | Citigroup Inc | Put | 30.000 | 0,00 | 718 | -59,05 | |||
| 2026-02-13 | 13F | Exome Asset Management LLC | 0 | -100,00 | 0 | |||||
| 2026-02-12 | 13F | Soleus Capital Management, L.P. | 0 | -100,00 | 0 | |||||
| 2026-02-13 | 13F | Schroder Investment Management Group | 55.015 | 1.308 | ||||||
| 2026-02-13 | 13F | Smartleaf Asset Management LLC | 2.000 | 48 | ||||||
| 2026-02-18 | 13F/A | ADAR1 Capital Management, LLC | Call | 30.000 | -85,00 | 718 | -93,86 | |||
| 2026-02-18 | 13F/A | ADAR1 Capital Management, LLC | 235.155 | 76,39 | 5.627 | -27,68 | ||||
| 2026-02-23 | 13F | Virtu Financial LLC | 0 | -100,00 | 0 | -100,00 | ||||
| 2026-02-17 | 13F | Catalio Capital Management, LP | 288.345 | 1,91 | 6.900 | -58,22 | ||||
| 2026-01-28 | 13F | Arizona State Retirement System | 11.141 | 5,96 | 267 | -56,61 | ||||
| 2025-11-14 | 13F | Jane Street Group, Llc | 0 | -100,00 | 0 | -100,00 | ||||
| 2026-02-17 | 13F | Readystate Asset Management Lp | 361.560 | 8.652 | ||||||
| 2026-02-06 | 13F | Profund Advisors Llc | 59.463 | 248,06 | 1.423 | 42,63 | ||||
| 2026-02-10 | 13F/A | Northwestern Mutual Wealth Management Co | 3 | 0 | ||||||
| 2026-02-06 | 13F | Larson Financial Group LLC | 8 | 0,00 | 0 | |||||
| 2026-02-17 | 13F | Polymer Capital Management (US) LLC | 0 | -100,00 | 0 | |||||
| 2026-02-13 | 13F | Velan Capital Investment Management LP | 0 | -100,00 | 0 | |||||
| 2026-01-30 | 13F | Pekin Hardy Strauss, Inc. | 29.300 | 701 | ||||||
| 2026-02-11 | 13F | BIT Capital GmbH | 31.614 | 757 | ||||||
| 2026-02-17 | 13F | Cresset Asset Management, LLC | 0 | -100,00 | 0 | -100,00 | ||||
| 2026-02-17 | 13F | Rtw Investments, Lp | 3.711.462 | -16,12 | 88.815 | -65,61 | ||||
| 2025-09-29 | NP | BBC - Virtus LifeSci Biotech Clinical Trials ETF | 7.610 | -30,27 | 106 | -34,78 | ||||
| 2026-02-11 | 13F | Havemeyer Place LP | 29.655 | 710 | ||||||
| 2026-02-05 | 13F | Qsemble Capital Management, LP | 15.931 | 381 | ||||||
| 2026-02-03 | 13F | Washington Trust Advisors, Inc. | 0 | -100,00 | 0 | |||||
| 2026-02-10 | 13F | Clear Harbor Asset Management, LLC | 16.900 | 141,43 | 404 | -0,98 | ||||
| 2026-02-17 | 13F | Sig Brokerage, Lp | Put | 11.000 | 83,33 | 263 | -24,86 | |||
| 2026-02-13 | 13F | Sofinnova Investments, Inc. | 176.513 | 28,97 | 4.224 | -47,13 | ||||
| 2026-02-17 | 13F | Sig Brokerage, Lp | Call | 31.000 | -39,22 | 742 | -75,10 | |||
| 2026-02-13 | 13F | SRS Capital Advisors, Inc. | 6 | -91,04 | 0 | -100,00 | ||||
| 2026-02-17 | 13F | Logos Global Management LP | 675.000 | 125,00 | 16.153 | -7,76 | ||||
| 2026-02-10 | 13F | Clear Harbor Asset Management, LLC | Put | 1.000 | 24 | |||||
| 2026-02-17 | 13F | Jump Financial, LLC | 306.131 | 7.326 | ||||||
| 2026-02-13 | 13F | Maverick Capital Ltd | 661.820 | 15.837 | ||||||
| 2026-02-09 | 13F | Legal & General Group Plc | 31.964 | -10,27 | 765 | -63,25 | ||||
| 2026-02-05 | 13F | Allworth Financial LP | 174 | 0,00 | 4 | -60,00 | ||||
| 2026-02-13 | 13F | Sei Investments Co | 13.938 | -79,28 | 333 | -91,52 | ||||
| 2026-02-17 | 13F | Ally Bridge Group (NY) LLC | Call | 200.000 | 4.786 | |||||
| 2026-01-29 | 13F | Pictet Asset Management Holding SA | 0 | -100,00 | 0 | -100,00 | ||||
| 2026-02-12 | 13F | Silverarc Capital Management, Llc | 126.047 | -72,30 | 3.016 | -88,64 | ||||
| 2026-02-12 | 13F | Silverarc Capital Management, Llc | Call | 720.800 | 17.249 | |||||
| 2026-02-17 | 13F | Sphera Funds Management Ltd. | 0 | -100,00 | 0 | |||||
| 2026-02-13 | 13F | Centiva Capital, LP | Call | 268.300 | 14,85 | 6.420 | -52,92 | |||
| 2026-01-29 | 13F | IMC-Chicago, LLC | Put | 106.900 | 2.558 | |||||
| 2026-02-12 | 13F | Marex Group plc | 85.993 | -1,00 | 2.058 | -59,42 | ||||
| 2026-02-13 | 13F | Ubs Asset Management Americas Inc | 80.249 | 1.920 | ||||||
| 2026-01-29 | 13F | IMC-Chicago, LLC | Call | 236.400 | 5.657 | |||||
| 2026-02-17 | 13F | Sphera Funds Management Ltd. | Put | 0 | -100,00 | 0 | ||||
| 2026-02-10 | 13F | State of Wyoming | 161 | 4 | ||||||
| 2026-02-13 | 13F | Hudson Bay Capital Management LP | Put | 0 | -100,00 | 0 | -100,00 | |||
| 2026-02-17 | 13F | Lighthouse Investment Partners, LLC | 12.500 | 299 | ||||||
| 2025-11-14 | 13F | Millennium Management Llc | Call | 0 | -100,00 | 0 | -100,00 | |||
| 2026-02-13 | 13F | Ashford Capital Management Inc | 10.000 | 239 | ||||||
| 2026-02-17 | 13F | MIRAE ASSET GLOBAL ETFS HOLDINGS Ltd. | 44.250 | 18,67 | 1.057 | -51,51 | ||||
| 2025-09-24 | NP | FHLC - Fidelity MSCI Health Care Index ETF This fund is a listed as child fund of Fmr Llc and if that institution has disclosed ownership in this security, then these positions will not be double counted when calculating total shares and total value | 17.331 | 241 | ||||||
| 2025-09-26 | NP | BIPIX - Biotechnology Ultrasector Profund Investor Class | 8.698 | -10,01 | 121 | -14,79 | ||||
| 2026-02-17 | 13F | Artia Global Partners LP | 1.023.539 | 55,35 | 24.493 | -36,31 | ||||
| 2026-02-13 | 13F | FORA Capital, LLC | 13.313 | 319 | ||||||
| 2026-02-06 | 13F | EverSource Wealth Advisors, LLC | 109 | 0,00 | 3 | -66,67 | ||||
| 2026-02-06 | 13F | Diamond Hill Capital Management Inc | 33.333 | 0,00 | 798 | -59,02 | ||||
| 2026-02-13 | 13F | Morgan Stanley | 716.927 | 122,99 | 17.156 | -8,58 | ||||
| 2026-02-17 | 13F | Raymond James Financial Inc | 0 | -100,00 | 0 | |||||
| 2026-02-13 | 13F | Headlands Technologies LLC | 39.616 | -30,99 | 948 | -71,70 | ||||
| 2025-09-26 | NP | FZROX - Fidelity ZERO Total Market Index Fund This fund is a listed as child fund of Fmr Llc and if that institution has disclosed ownership in this security, then these positions will not be double counted when calculating total shares and total value | 22.801 | 1,26 | 317 | -4,52 | ||||
| 2026-02-17 | 13F | Persistent Asset Partners Ltd | 11.014 | 264 | ||||||
| 2026-02-17 | 13F | Perceptive Advisors Llc | 0 | -100,00 | 0 | |||||
| 2026-02-17 | 13F | Bank Of America Corp /de/ | 329.525 | 11,65 | 7.886 | -54,23 | ||||
| 2026-02-17 | 13F | Cape Investment Advisory, Inc. | 40 | 1 | ||||||
| 2026-02-13 | 13F/A | Virtus ETF Advisers LLC | 0 | -100,00 | 0 | |||||
| 2025-09-29 | NP | PRFZ - Invesco FTSE RAFI US 1500 Small-Mid ETF This fund is a listed as child fund of Invesco Ltd. and if that institution has disclosed ownership in this security, then these positions will not be double counted when calculating total shares and total value | 49.146 | -33,87 | 684 | -37,59 | ||||
| 2026-02-13 | 13F | Diametric Capital, LP | 11.822 | 119,62 | 283 | -10,19 | ||||
| 2026-02-13 | 13F | Voss Capital, LLC | 210.000 | 68,00 | 5.025 | -31,13 | ||||
| 2026-01-15 | 13F/A | Persistent Asset Partners Ltd | Call | 0 | -100,00 | 0 | -100,00 | |||
| 2026-02-17 | 13F | Price T Rowe Associates Inc /md/ | 208.646 | -77,15 | 5 | -92,45 | ||||
| 2026-02-13 | 13F | Manufacturers Life Insurance Company, The | 0 | -100,00 | 0 | |||||
| 2025-11-14 | 13F | Wolverine Trading, Llc | 20.098 | 45,73 | 1.194 | 524,61 | ||||
| 2025-11-14 | 13F | Wolverine Trading, Llc | Call | 111.100 | 105,36 | 6.599 | 781,04 | |||
| 2025-11-14 | 13F | Wolverine Trading, Llc | Put | 92.300 | 368,53 | 5.483 | 1.908,06 | |||
| 2025-09-24 | NP | CSMIX - Columbia Small Cap Value Fund I Class A | 391.190 | 2,11 | 5.445 | -3,70 | ||||
| 2026-02-17 | 13F | Gilder Gagnon Howe & Co Llc | 0 | -100,00 | 0 | |||||
| 2026-02-17 | 13F | Balyasny Asset Management Llc | 135.644 | -59,29 | 3.246 | -83,32 | ||||
| 2026-02-13 | 13F | Atika Capital Management LLC | 0 | -100,00 | 0 | |||||
| 2026-02-13 | 13F | Rhenman & Partners Asset Management AB | 79.375 | 1.899 | ||||||
| 2026-01-16 | 13F | Tema Etfs Llc | 0 | -100,00 | 0 | -100,00 | ||||
| 2026-02-10 | 13F | Goldman Sachs Group Inc | 1.167.608 | 76,32 | 27.941 | -27,72 | ||||
| 2026-02-12 | 13F | Brinker Capital Investments, LLC | 10.768 | 258 | ||||||
| 2026-02-17 | 13F | Burkehill Global Management, LP | 0 | -100,00 | 0 | |||||
| 2025-11-13 | 13F/A | Peak6 Llc | 0 | -100,00 | 0 | -100,00 | ||||
| 2026-02-12 | 13F | Financial Engines Advisors L.L.C. | 0 | -100,00 | 0 | |||||
| 2026-02-09 | 13F | Geode Capital Management, Llc | 776.071 | 7,54 | 18.578 | -55,91 | ||||
| 2026-02-06 | 13F | IFP Advisors, Inc | 1.989 | 48 | -18,97 | |||||
| 2026-02-17 | 13F | Whitefort Capital Management, LP | 459.000 | 10.984 | ||||||
| 2026-02-17 | 13F | Advisor Group Holdings, Inc. | Call | 1 | 1 | |||||
| 2026-02-13 | 13F | Mml Investors Services, Llc | 33.937 | 812 | ||||||
| 2026-02-17 | 13F | Coppell Advisory Solutions LLC | 0 | -100,00 | 0 | |||||
| 2026-02-11 | 13F | Franklin Resources Inc | 746.602 | -62,46 | 17.866 | -84,61 | ||||
| 2026-01-16 | 13F | Standard Life Aberdeen plc | 3.678.640 | 25,13 | 88.030 | -48,70 | ||||
| 2026-02-17 | 13F | PFM Health Sciences, LP | 39.499 | -14,79 | 945 | -65,06 | ||||
| 2026-02-13 | 13F | Vontobel Holding Ltd. | 11.933 | 286 | ||||||
| 2026-02-13 | 13F | Motiv8 Investments LLC | 45 | 0 | ||||||
| 2026-02-03 | 13F | Ballentine Partners, LLC | 0 | -100,00 | 0 | |||||
| 2026-01-29 | 13F | Nbc Securities, Inc. | 2 | 0 | ||||||
| 2026-02-02 | 13F | Montag A & Associates Inc | 5 | 0 | ||||||
| 2025-09-26 | NP | PTH - Invesco DWA Healthcare Momentum ETF This fund is a listed as child fund of Invesco Ltd. and if that institution has disclosed ownership in this security, then these positions will not be double counted when calculating total shares and total value | 104.316 | -45,23 | 1.452 | -48,33 | ||||
| 2026-02-17 | 13F | Persistent Asset Partners Ltd | Put | 688 | 0,00 | 180 | 22,45 | |||
| 2026-02-12 | 13F | Steward Partners Investment Advisory, Llc | 250 | 0,00 | 6 | -64,29 | ||||
| 2026-02-17 | 13F | Algert Global Llc | 72.150 | 216,31 | 2 | 0,00 | ||||
| 2026-02-13 | 13F | Birchview Capital, LP | 30.789 | -60,89 | 737 | -83,98 | ||||
| 2026-02-13 | 13F | Hudson Bay Capital Management LP | 125.500 | 2.806,44 | 3.003 | 1.091,67 | ||||
| 2026-01-26 | 13F | Mirae Asset Global Investments Co., Ltd. | 3.027 | 42,72 | 72 | -41,46 | ||||
| 2025-11-14 | 13F | EcoR1 Capital, LLC | Call | 0 | -100,00 | 0 | -100,00 | |||
| 2026-02-09 | 13F | Jefferies Financial Group Inc. | 90.542 | 0,00 | 2.167 | -59,01 | ||||
| 2026-02-17 | 13F | Avoro Capital Advisors LLC | 6.150.000 | 38,38 | 147.170 | -43,27 | ||||
| 2026-02-12 | 13F | Quadrant Capital Group Llc | 187 | 0,00 | 4 | -60,00 | ||||
| 2026-02-13 | 13F | Eventide Asset Management, Llc | 498.212 | 11.922 | ||||||
| 2026-02-17 | 13F | Freestone Grove Partners LP | 12.984 | 311 | ||||||
| 2026-02-17 | 13F | Boxer Capital Management, LLC | 290.000 | -63,75 | 6.940 | -85,14 | ||||
| 2026-02-17 | 13F | Point72 Asset Management, L.P. | 24.439 | -90,38 | 585 | -96,06 | ||||
| 2026-02-12 | 13F | Rosalind Advisors, Inc. | 0 | -100,00 | 0 | -100,00 | ||||
| 2026-02-12 | 13F | Commonwealth Equity Services, Llc | 0 | -100,00 | 0 | |||||
| 2026-02-17 | 13F | Ameriprise Financial Inc | 70.796 | -55,46 | 1.694 | -81,74 | ||||
| 2025-10-15 | 13F | Future Financial Wealth Managment LLC | 0 | -100,00 | 0 | -100,00 | ||||
| 2026-02-12 | 13F | Rosalind Advisors, Inc. | Call | 100.000 | 95 | |||||
| 2026-02-13 | 13F | Centiva Capital, LP | Put | 0 | -100,00 | 0 | -100,00 | |||
| 2025-09-25 | NP | ISCB - iShares Morningstar Small-Cap ETF | 2.094 | 29 | ||||||
| 2026-02-12 | 13F | Senvest Management, LLC | 50.000 | 1.196 | ||||||
| 2026-02-17 | 13F | Capital Fund Management S.a. | 82.978 | 1.986 | ||||||
| 2026-01-30 | 13F | Jennison Associates Llc | 1.371.190 | 37,19 | 32.813 | -43,76 | ||||
| 2026-02-11 | 13F | Winton Capital Group Ltd | 48.185 | 17,59 | 1.153 | -51,78 | ||||
| 2026-02-11 | 13F | Deutsche Bank Ag\ | 4.621 | 98,33 | 111 | -19,12 | ||||
| 2026-02-13 | 13F | State Street Corp | 3.231.043 | 123,75 | 77.319 | -8,27 | ||||
| 2026-02-17 | 13F | Farallon Capital Management Llc | 14.000 | -97,52 | 335 | -98,98 | ||||
| 2026-02-17 | 13F | Superstring Capital Management Lp | 0 | -100,00 | 0 | |||||
| 2026-01-08 | 13F | Versant Capital Management, Inc | 85 | -48,48 | 2 | -77,78 | ||||
| 2026-02-10 | 13F | Envestnet Asset Management Inc | 99.593 | 762,35 | 2.383 | 253,56 | ||||
| 2026-02-17 | 13F | Suvretta Capital Management, Llc | 1.216.734 | 29.116 | ||||||
| 2026-02-13 | 13F | Charles Schwab Investment Management Inc | 362.878 | 1,45 | 8.684 | -58,41 | ||||
| 2026-02-17 | 13F | Scientech Research LLC | 10.203 | -65,17 | 244 | -85,72 | ||||
| 2025-11-14 | 13F | Diadema Partners Lp | Call | 0 | -100,00 | 0 | -100,00 | |||
| 2026-02-17 | 13F | Eversept Partners, LP | 62.820 | -92,84 | 1.503 | -97,07 | ||||
| 2025-11-14 | 13F | Centiva Capital, LP | 0 | -100,00 | 0 | -100,00 | ||||
| 2026-02-17 | 13F | Rangeley Capital, LLC | 8.500 | 203 | ||||||
| 2026-02-17 | 13F | Diadema Partners Lp | 45.000 | 1.077 | ||||||
| 2025-09-26 | NP | FZIPX - Fidelity ZERO Extended Market Index Fund This fund is a listed as child fund of Fmr Llc and if that institution has disclosed ownership in this security, then these positions will not be double counted when calculating total shares and total value | 15.009 | 0,00 | 209 | -5,88 | ||||
| 2025-09-29 | NP | LABU - Direxion Daily S&P Biotech Bull 3X Shares Direxion Daily S&P Biotech Bull 3X Shares | 77.118 | 3,18 | 1.073 | -2,72 | ||||
| 2026-02-17 | 13F | Diadema Partners Lp | Put | 301.800 | 0,60 | 7.222 | -58,76 | |||
| 2026-02-06 | 13F | Cullen/frost Bankers, Inc. | 34 | 1 | ||||||
| 2026-02-06 | 13F | Eagle Health Investments LP | 205.247 | 4.912 | ||||||
| 2026-01-20 | 13F | Toth Financial Advisory Corp | 100 | -39,39 | 2 | -77,78 | ||||
| 2026-02-17 | 13F | Cinctive Capital Management LP | Call | 35.000 | 838 | |||||
| 2026-02-13 | 13F | DLD Asset Management, LP | Put | 0 | -100,00 | 0 | -100,00 | |||
| 2026-02-05 | 13F | Requisite Capital Management, LLC | 0 | -100,00 | 0 | |||||
| 2026-02-17 | 13F | Lion Point Capital, LP | 14.700 | 352 | ||||||
| 2026-02-17 | 13F | Freshford Capital Management, LLC | 229.613 | 5.495 | ||||||
| 2026-02-17 | 13F | T. Rowe Price Investment Management, Inc. | 0 | -100,00 | 0 | |||||
| 2026-02-09 | 13F | Huntington National Bank | 2 | 0,00 | 0 | |||||
| 2026-02-12 | 13F | Patient Square Capital LP | 0 | -100,00 | 0 | |||||
| 2026-02-12 | 13F | Campbell & CO Investment Adviser LLC | 0 | -100,00 | 0 | |||||
| 2026-02-12 | 13F | CIBC Private Wealth Group, LLC | 850 | 0,00 | 20 | -59,18 | ||||
| 2026-02-17 | 13F | Monimus Capital Management, Lp | 25.878 | 619 | ||||||
| 2026-02-12 | 13F | BRYN MAWR TRUST Co | 0 | -100,00 | 0 | -100,00 | ||||
| 2026-02-17 | 13F | Sig Brokerage, Lp | 0 | -100,00 | 0 | -100,00 | ||||
| 2026-02-10 | 13F | Lido Advisors, LLC | 5.544 | 0,00 | 324 | 0,00 | ||||
| 2025-11-14 | 13F | Cubist Systematic Strategies, LLC | 62.365 | 3.640 | ||||||
| 2026-02-17 | 13F | Shay Capital LLC | 41.073 | 17,36 | 983 | -51,91 | ||||
| 2026-02-10 | 13F | Quantbot Technologies LP | 5.444 | 130 | ||||||
| 2026-02-13 | 13F | Squarepoint Ops LLC | 176.000 | -3,24 | 4.212 | -60,34 | ||||
| 2026-02-12 | 13F | Monashee Investment Management LLC | 0 | -100,00 | 0 | |||||
| 2025-09-26 | NP | Templeton Global Income Fund | Short | -3.441 | -48 | |||||
| 2026-02-17 | 13F | Delaware Management Holdings, Inc. | 258.211 | 6.179 | ||||||
| 2026-02-13 | 13F | Greenline Wealth Management LLC | 52 | 1 | ||||||
| 2026-02-17 | 13F | Ancora Advisors, LLC | 0 | -100,00 | 0 | |||||
| 2025-09-26 | NP | REBYX - U.S. Small Cap Equity Fund Class Y | 16.417 | 0,00 | 229 | -5,79 | ||||
| 2026-01-29 | 13F | Comerica Bank | 637 | 56,51 | 15 | -34,78 | ||||
| 2026-02-17 | 13F | Fred Alger Management, Llc | 344.878 | -73,27 | 8.253 | -89,04 | ||||
| 2026-02-10 | 13F | Daiwa Securities Group Inc. | 158 | 0,00 | 0 | |||||
| 2026-02-17 | 13F | SummitTX Capital, L.P. | 27.708 | 386,28 | 663 | 99,70 | ||||
| 2026-01-26 | 13F | Private Trust Co Na | 0 | -100,00 | 0 | |||||
| 2026-02-05 | 13F | Tejara Capital Ltd | 42.000 | 1.005 | ||||||
| 2025-11-14 | 13F | Skopos Labs, Inc. | 0 | -100,00 | 0 | |||||
| 2026-02-17 | 13F | Tower Research Capital LLC (TRC) | 76 | -92,71 | 2 | -98,33 | ||||
| 2026-02-17 | 13F | Boothbay Fund Management, Llc | Call | 39.300 | -82,06 | 940 | -92,65 | |||
| 2026-02-11 | 13F | Nationale-Nederlanden Powszechne Towarzystwo Emerytalne S.A. | 521.677 | 0,00 | 12.484 | -59,00 | ||||
| 2026-02-17 | 13F | Boothbay Fund Management, Llc | 30.448 | -22,73 | 729 | -68,33 | ||||
| 2026-02-10 | 13F | Td Asset Management Inc | 23.734 | -75,05 | 568 | -89,79 | ||||
| 2025-11-14 | 13F | Point72 Hong Kong Ltd | 0 | -100,00 | 0 | |||||
| 2026-02-13 | 13F | Transamerica Financial Advisors, Inc. | 71 | 2 | ||||||
| 2026-02-12 | 13F | Principal Securities, Inc. | 0 | -100,00 | 0 | |||||
| 2026-02-13 | 13F | Sofinnova Investments, Inc. | Call | 0 | -100,00 | 0 | -100,00 | |||
| 2026-02-13 | 13F/A | Tyro Capital Management LLC | 663.929 | 15.888 | ||||||
| 2026-02-17 | 13F | D. E. Shaw & Co., Inc. | 131.956 | 305,56 | 3.158 | 66,25 | ||||
| 2026-02-17 | 13F | D. E. Shaw & Co., Inc. | Call | 11.200 | -92,07 | 268 | -96,75 | |||
| 2026-02-13 | 13F | Sofinnova Investments, Inc. | Put | 0 | -100,00 | 0 | -100,00 | |||
| 2026-01-28 | 13F | WPG Advisers, LLC | 10 | -94,90 | 0 | -100,00 | ||||
| 2026-02-17 | 13F | Darwin Global Management, Ltd. | 0 | -100,00 | 0 | |||||
| 2026-02-19 | 13F | Invesco Ltd. | 0 | -100,00 | 0 | -100,00 | ||||
| 2026-02-03 | 13F | Privium Fund Management B.V. | 416.270 | 7,84 | 9.961 | -55,79 | ||||
| 2026-01-29 | 13F | UBS Group AG | 491.454 | 139,75 | 11.760 | -1,71 | ||||
| 2026-02-17 | 13F | Parkman Healthcare Partners LLC | 257.382 | -25,47 | 6.159 | -69,45 | ||||
| 2026-02-13 | 13F | Marshall Wace, Llp | 21.159 | 506 | ||||||
| 2026-02-11 | 13F | Fiera Capital Corp | 768.510 | 18.390 | ||||||
| 2026-02-13 | 13F | Caitong International Asset Management Co., Ltd | 0 | -100,00 | 0 | |||||
| 2026-02-17 | 13F | Voleon Capital Management Lp | 20.243 | 484 | ||||||
| 2026-02-17 | 13F | NEOS Investment Management LLC | 0 | -100,00 | 0 | |||||
| 2026-02-12 | 13F | New York State Common Retirement Fund | 147.549 | 3.531 | ||||||
| 2026-02-17 | 13F | Virtus Investment Advisers, Inc. | 13.636 | 91,62 | 326 | -21,45 | ||||
| 2026-02-04 | 13F | NAN FUNG TRINITY (HK) Ltd | 115.494 | 2.764 | ||||||
| 2026-02-13 | 13F | Rafferty Asset Management, LLC | 164.937 | 99,06 | 3.947 | -18,40 | ||||
| 2025-11-14 | 13F | National Bank Of Canada /fi/ | 0 | -100,00 | 0 | -100,00 | ||||
| 2026-02-17 | 13F | State Of Wisconsin Investment Board | 19.390 | 443,44 | 464 | 123,08 | ||||
| 2025-11-12 | 13F/A | Norges Bank | 0 | -100,00 | 0 | |||||
| 2026-02-26 | 13F | Seven Fleet Capital Management LP | 8.742 | 209 | ||||||
| 2026-02-11 | 13F | Group One Trading, L.p. | 0 | -100,00 | 0 | -100,00 | ||||
| 2026-01-09 | 13F | Assenagon Asset Management S.A. | 606.923 | 14.524 | ||||||
| 2026-02-13 | 13F | Sassicaia Capital Advisers Llc | 10.400 | -35,00 | 249 | -73,42 | ||||
| 2026-02-17 | 13F | Citadel Advisors Llc | Call | 812.400 | 200,89 | 19.441 | 23,36 | |||
| 2026-02-17 | 13F | Citadel Advisors Llc | 469.300 | 9,21 | 11.230 | -55,23 | ||||
| 2026-02-06 | 13F | Mraz, Amerine & Associates, Inc. | 8.495 | -8,84 | 203 | -62,62 | ||||
| 2026-02-17 | 13F | Citadel Advisors Llc | Put | 483.200 | -20,00 | 11.563 | -67,20 | |||
| 2026-02-17 | 13F | Royal Bank Of Canada | 85.640 | -59,49 | 2.050 | -83,39 | ||||
| 2026-02-17 | 13F | Graham Capital Management, L.P. | 9.013 | 216 | ||||||
| 2026-01-05 | 13F | GAMMA Investing LLC | 8 | 100,00 | 0 | |||||
| 2026-02-17 | 13F | Creative Planning | 0 | -100,00 | 0 | |||||
| 2026-02-11 | 13F | Simplex Trading, Llc | 110.675 | 62,77 | 2.648 | 88.166,67 | ||||
| 2026-02-13 | 13F | First Turn Management, LLC | 321.655 | 7.697 | ||||||
| 2026-02-11 | 13F | Simplex Trading, Llc | Call | 475.300 | 104,34 | 11.374 | 87.384,62 | |||
| 2026-02-11 | 13F | Simplex Trading, Llc | Put | 295.800 | -23,37 | 7.078 | 32.072,73 | |||
| 2026-02-17 | 13F | Creek Drive Management Group LLC | Call | 300.000 | 780 | |||||
| 2026-02-17 | 13F | Cetera Investment Advisers | 8.366 | 200 | ||||||
| 2026-01-12 | 13F | Salem Investment Counselors Inc | 0 | -100,00 | 0 | -100,00 | ||||
| 2026-01-23 | 13F | Bellevue Asset Management, Llc | 0 | -100,00 | 0 | |||||
| 2026-02-13 | 13F | Siren, L.L.C. | 0 | -100,00 | 0 | |||||
| 2026-02-17 | 13F | Millennium Management Llc | Put | 30.000 | 0,00 | 718 | -59,05 | |||
| 2026-02-17 | 13F | Millennium Management Llc | 803.605 | 319,42 | 19.230 | 71,96 | ||||
| 2026-02-13 | 13F | Deep Track Capital, LP | 0 | -100,00 | 0 | -100,00 | ||||
| 2026-02-17 | 13F | Vestal Point Capital, LP | 0 | -100,00 | 0 | |||||
| 2026-01-30 | 13F | Activest Wealth Management | 5.000 | 0,00 | 120 | -59,11 | ||||
| 2026-01-26 | 13F | Cwm, Llc | 247 | 0,00 | 0 | |||||
| 2026-01-23 | 13F | Farther Finance Advisors, LLC | 114 | 3 | ||||||
| 2026-02-12 | 13F | Voya Investment Management Llc | 28.850 | -71,75 | 690 | -88,42 | ||||
| 2025-09-26 | NP | RTSSX - Tax-Managed U.S. Mid & Small Cap Fund Class S | 42.913 | -39,97 | 597 | -43,41 | ||||
| 2026-01-21 | 13F | Palumbo Wealth Management LLC | 0 | -100,00 | 0 | -100,00 | ||||
| 2026-01-27 | 13F | Zurcher Kantonalbank (Zurich Cantonalbank) | 19.007 | -4,47 | 455 | -60,90 | ||||
| 2026-02-06 | 13F | Entrust Financial Llc | 190 | 5 | ||||||
| 2026-02-13 | 13F | Nantahala Capital Management, LLC | 699.298 | -30,59 | 16.734 | -71,54 | ||||
| 2026-01-08 | 13F | Sanders Morris Harris Llc | 0 | -100,00 | 0 | -100,00 | ||||
| 2026-02-13 | 13F | Barclays Plc | Put | 162.500 | -14,61 | 3.889 | -65,00 | |||
| 2026-02-13 | 13F | Barclays Plc | Call | 287.500 | 208,48 | 6.880 | 26,45 | |||
| 2026-02-13 | 13F | Alyeska Investment Group, L.P. | 151.058 | 277,64 | 3.615 | 54,84 | ||||
| 2026-02-02 | 13F | Total Clarity Wealth Management, Inc. | 0 | -100,00 | 0 | |||||
| 2026-02-13 | 13F | Barclays Plc | 209.790 | 81,54 | 5.020 | -25,57 | ||||
| 2025-10-30 | 13F | Covestor Ltd | 0 | -100,00 | 0 | |||||
| 2026-02-04 | 13F | LRI Investments, LLC | 0 | -100,00 | 0 | |||||
| 2026-02-17 | 13F | Caption Management, LLC | Call | 635.000 | 66,67 | 15.196 | -31,67 | |||
| 2025-09-23 | NP | FBDIX - Franklin Biotechnology Discovery Fund Class A | 568.800 | -18,32 | 7.918 | -22,97 | ||||
| 2026-02-17 | 13F | Caption Management, LLC | 177.277 | -61,32 | 4.242 | -84,14 | ||||
| 2026-02-17 | 13F | Caption Management, LLC | Put | 217.400 | -58,02 | 5.202 | -82,79 | |||
| 2026-02-17 | 13F | 683 Capital Management, LLC | 384.950 | -64,02 | 9.212 | -85,25 | ||||
| 2026-02-17 | 13F | 683 Capital Management, LLC | Call | 750.100 | 17.950 | |||||
| 2026-01-29 | 13F | China Universal Asset Management Co., Ltd. | 10.150 | 5,54 | 243 | -56,86 | ||||
| 2026-02-17 | 13F | Fmr Llc | 6.240.936 | 2,99 | 149.346 | -57,78 | ||||
| 2026-02-17 | 13F | Ra Capital Management, L.p. | 0 | -100,00 | 0 | -100,00 | ||||
| 2026-02-11 | 13F | Gordian Capital Singapore Pte Ltd | 0 | -100,00 | 0 | |||||
| 2026-02-17 | 13F | Boone Capital Management Llc | 0 | -100,00 | 0 | |||||
| 2026-02-14 | 13F | Rockefeller Capital Management L.P. | 247 | -75,30 | 6 | -91,38 | ||||
| 2025-09-26 | NP | ISCV - iShares Morningstar Small-Cap Value ETF | 4.486 | 21,18 | 62 | 195,24 | ||||
| 2026-02-13 | 13F | Affinity Asset Advisors, LLC | Call | 800.000 | 19.144 | |||||
| 2026-02-13 | 13F | Affinity Asset Advisors, LLC | 50.000 | -83,33 | 1.196 | -93,17 | ||||
| 2026-02-10 | 13F | Bnp Paribas Arbitrage, Sa | 221.343 | -42,60 | 5.297 | -76,47 | ||||
| 2026-02-12 | 13F | Swiss National Bank | 79.000 | 3,54 | 1.890 | -57,56 | ||||
| 2026-02-13 | 13F | Verition Fund Management LLC | 0 | -100,00 | 0 | |||||
| 2026-02-19 | 13F | CI Private Wealth, LLC | 0 | -100,00 | 0 | -100,00 | ||||
| 2026-02-12 | 13F | Knott David M Jr | 4.000 | 100,00 | 96 | -18,10 | ||||
| 2026-02-17 | 13F | Nomura Holdings Inc | 15.584 | 373 | ||||||
| 2026-02-17 | 13F | Nomura Holdings Inc | Call | 25.200 | 603 | |||||
| 2026-02-17 | 13F | Nomura Holdings Inc | Put | 47.200 | -52,75 | 1.129 | -80,64 | |||
| 2025-11-14 | 13F | Toronto Dominion Bank | 0 | -100,00 | 0 | |||||
| 2026-02-17 | 13F | Prelude Capital Management, Llc | 15.739 | 29,43 | 377 | -46,97 | ||||
| 2026-02-05 | 13F | DnB Asset Management AS | 27.342 | 131,67 | 654 | -4,94 | ||||
| 2026-02-17 | 13F | EcoR1 Capital, LLC | 0 | -100,00 | 0 | |||||
| 2026-02-17 | 13F | Schonfeld Strategic Advisors LLC | 122.529 | -34,89 | 2.932 | -73,31 | ||||
| 2026-02-06 | 13F | Global Retirement Partners, LLC | 67 | -77,67 | 2 | -94,12 | ||||
| 2026-02-10 | 13F | SCS Capital Management LLC | 0 | -100,00 | 0 | |||||
| 2026-02-17 | 13F | Russell Investments Group, Ltd. | 23.707 | -84,18 | 567 | -93,52 | ||||
| 2026-01-30 | 13F | Sigma Planning Corp | 0 | -100,00 | 0 | |||||
| 2026-01-27 | 13F | Gf Fund Management Co. Ltd. | 1.223 | 3,64 | 29 | -57,35 | ||||
| 2026-02-17 | 13F | MPM Oncology Impact Management LP | 1.381.628 | 33.062 | ||||||
| 2026-01-16 | 13F | FNY Investment Advisers, LLC | 2.080 | 25,76 | 0 | |||||
| 2026-01-16 | 13F | FNY Investment Advisers, LLC | Call | 23 | 0 | |||||
| 2025-09-26 | NP | FLXSX - Fidelity Flex Small Cap Index Fund This fund is a listed as child fund of Fmr Llc and if that institution has disclosed ownership in this security, then these positions will not be double counted when calculating total shares and total value | 10.933 | 152 | ||||||
| 2026-02-17 | 13F | Aquatic Capital Management LLC | 0 | -100,00 | 0 | |||||
| 2026-02-11 | 13F | Westfield Capital Management Co Lp | 0 | -100,00 | 0 | |||||
| 2026-02-17 | 13F | Susquehanna Portfolio Strategies, LLC | 28.708 | -2,84 | 687 | -60,21 | ||||
| 2026-02-17 | 13F | Two Sigma Investments, Lp | 1.451.284 | 61,70 | 34.729 | -33,71 |