Grundlæggende statistik
| Institutionelle ejere | 372 total, 372 long only, 0 short only, 0 long/short - change of 2,47% MRQ |
| Gennemsnitlig porteføljeallokering | 0.1836 % - change of -4,55% MRQ |
| Institutionelle aktier (lange) | 7.152.968 (ex 13D/G) - change of 0,06MM shares 0,80% MRQ |
| Institutionel værdi (lang) | $ 1.581.895 USD ($1000) |
Institutionelt ejerskab og aktionærer
First Trust Exchange-Traded Fund - First Trust NASDAQ-100-Technology Sector Index Fund (US:QTEC) har 372 institutionelle ejere og aktionærer, der har indsendt 13D/G- eller 13F-formularer til Securities Exchange Commission (SEC). Disse institutioner har i alt 7,152,968 aktier. Største aktionærer omfatter Bank Of America Corp /de/, LPL Financial LLC, Morgan Stanley, Wells Fargo & Company/mn, Raymond James Financial Inc, UBS Group AG, Royal Bank Of Canada, Envestnet Asset Management Inc, Advisor Group Holdings, Inc., and Allworth Financial LP .
First Trust Exchange-Traded Fund - First Trust NASDAQ-100-Technology Sector Index Fund (NasdaqGM:QTEC) institutionel ejerskabsstruktur viser aktuelle positioner i virksomheden efter institutioner og fonde, samt seneste ændringer i positionsstørrelse. Større aktionærer kan omfatte individuelle investorer, investeringsforeninger, hedgefonde eller institutioner. Skema 13D angiver, at investoren besidder (eller besidder) mere end 5 % af virksomheden og har til hensigt (eller har til hensigt at) aktivt at forfølge en ændring i forretningsstrategi. Skema 13G indikerer en passiv investering på over 5%.
The share price as of March 6, 2026 is 221,03 / share. Previously, on March 7, 2025, the share price was 183,78 / share. This represents an increase of 20,27% over that period.

Fondens stemningsscore
Fund Sentiment Score (fka Ownership Accumulation Score) finder de aktier, der bliver mest købt af fonde. Det er resultatet af en sofistikeret, multi-faktor kvantitativ model, der identificerer virksomheder med de højeste niveauer af institutionel akkumulering. Scoringsmodellen bruger en kombination af den samlede stigning i oplyste ejere, ændringerne i porteføljeallokeringer i disse ejere og andre målinger. Tallet går fra 0 til 100, hvor højere tal indikerer et højere niveau af akkumulering for sine jævnaldrende, og 50 er gennemsnittet.
Opdateringsfrekvens: Dagligt
Se Ownership Explorer, som giver en liste over højest rangerende virksomheder.
AI+ Ask Fintel’s AI assistant about First Trust Exchange-Traded Fund - First Trust NASDAQ-100-Technology Sector Index Fund.
Select a question to share a public post with an AI-crafted answer.
Thinking of good questions…
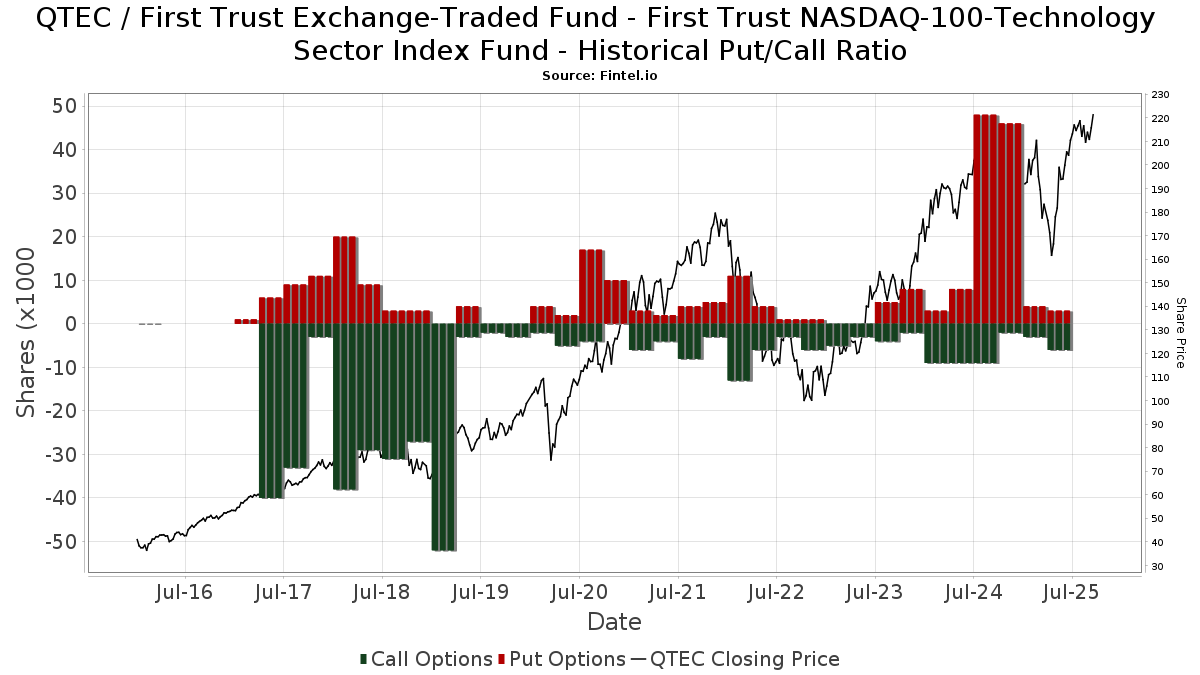
Institutionel Put/Call-forhold
Ud over at indberette standardaktie- og gældsudstedelser skal institutter med mere end 100 mill. aktiver under forvaltning også oplyse deres put- og call-optionsbeholdninger. Da salgsoptioner generelt indikerer negativ stemning, og købsoptioner indikerer positiv stemning, kan vi få en fornemmelse af den overordnede institutionelle stemning ved at plotte forholdet mellem put og kald. Diagrammet til højre viser det historiske put/call-forhold for dette instrument.
Brug af Put/Call Ratio som en indikator for investorernes stemning overvinder en af de vigtigste mangler ved at bruge totalt institutionelt ejerskab, som er, at en betydelig mængde af aktiver under forvaltning investeres passivt for at spore indekser. Passivt forvaltede fonde køber typisk ikke optioner, så indikatoren for put/call-forholdet følger mere nøje følelsen af aktivt forvaltede fonde.
13D/G-arkivering
Vi præsenterer 13D/G ansøgninger separat fra 13F ansøgninger på grund af den forskellige behandling af SEC. 13D/G-ansøgninger kan indgives af grupper af investorer (med én ledende), hvorimod 13F-ansøgninger ikke kan. Dette resulterer i situationer, hvor en investor kan indsende en 13D/G, der rapporterer én værdi for de samlede aktier (der repræsenterer alle de aktier, der ejes af investorgruppen), men derefter indsender en 13F, der rapporterer en anden værdi for de samlede aktier (der udelukkende repræsenterer deres egne) ejendomsret). Det betyder, at aktieejerskab af 13D/G-arkiver og 13F-arkiveringer ofte ikke er direkte sammenlignelige, så vi præsenterer dem separat.
Bemærk: Fra den 16. maj 2021 viser vi ikke længere ejere, der ikke har indsendt en 13D/G inden for det seneste år. Tidligere viste vi den fulde historie af 13D/G-arkiver. Generelt skal enheder, der er forpligtet til at indgive 13D/G-ansøgninger, indgive mindst årligt, før de indsender en afsluttende ansøgning. Dog forlader fonde nogle gange positioner uden at indsende en afsluttende ansøgning (dvs. de afvikler), så visning af den fulde historie resulterede nogle gange i forvirring om det nuværende ejerskab. For at undgå forvirring viser vi nu kun 'aktuelle' ejere - det vil sige - ejere, der har anmeldt inden for det seneste år.
Upgrade to unlock premium data.
| Fil dato | Form | Investor | Forrige Aktier |
Seneste Aktier |
Δ Aktier (Procent) |
Ejendomsret (Procent) |
Δ Ejerskab (Procent) |
|
|---|---|---|---|---|---|---|---|---|
| 2025-05-07 | FIRST TRUST PORTFOLIOS LP | 4,182,638 | 5,116 | -99.88 | 0.04 | -99.81 |
13F og NPORT arkivering
Detaljer om 13F-arkivering er gratis. Detaljer om NP-ansøgninger kræver et premium-medlemskab. Grønne rækker angiver nye positioner. Røde rækker angiver lukkede positioner. Klik på linket ikon for at se den fulde transaktionshistorik.
Opgrader
for at låse premium-data op og eksportere til Excel ![]() .
.
| Fil dato | Kilde | Investor | Type | Gennemsnitlig pris (Øst) |
Aktier | Δ Aktier (%) |
Rapporteret Værdi ($1000) |
Δ Værdi (%) |
Port Alloc (%) |
|
|---|---|---|---|---|---|---|---|---|---|---|
| 2026-01-26 | 13F | Asset Dedication, LLC | 4.296 | 0,00 | 989 | 0,20 | ||||
| 2026-01-26 | 13F | Keystone Wealth Services, LLC | 0 | -100,00 | 0 | |||||
| 2026-01-29 | 13F | Ashton Thomas Private Wealth, LLC | 1.108 | 10,69 | 255 | 11,35 | ||||
| 2026-02-17 | 13F | Palogic Value Management, L.P. | 1.277 | 0,00 | 294 | 0,00 | ||||
| 2026-01-26 | 13F | Icapital Wealth Llc | 5.228 | 0,00 | 1.204 | 0,33 | ||||
| 2026-01-29 | 13F | Kestra Private Wealth Services, Llc | 8.478 | 9,66 | 1.952 | 9,92 | ||||
| 2026-02-12 | 13F | Rossby Financial, LCC | 219 | -6,01 | 50 | -5,66 | ||||
| 2026-02-10 | 13F | Belvedere Trading LLC | Call | 0 | -100,00 | 0 | ||||
| 2026-02-10 | 13F | Belvedere Trading LLC | 0 | -100,00 | 0 | |||||
| 2026-02-10 | 13F | Triglav Skladi, D.o.o. | 365 | 0,00 | 84 | 1,20 | ||||
| 2026-02-03 | 13F | International Assets Investment Management, Llc | 7.458 | 0,57 | 1.717 | 9,37 | ||||
| 2026-02-11 | 13F | J.w. Cole Advisors, Inc. | 7.542 | 16,05 | 365 | -75,60 | ||||
| 2026-02-17 | 13F | Cetera Investment Advisers | 84.390 | -0,97 | 19.427 | -0,72 | ||||
| 2026-02-10 | 13F | Belvedere Trading LLC | Put | 0 | -100,00 | 0 | ||||
| 2026-02-17 | 13F | Northern Trust Corp | 1.167 | -10,71 | 269 | -10,67 | ||||
| 2026-02-09 | 13F | Prospera Financial Services Inc | 18.516 | 2,64 | 4.262 | 2,92 | ||||
| 2026-02-10 | 13F | Kesler, Norman & Wride, LLC | 4.289 | -5,24 | 987 | 15,85 | ||||
| 2026-01-28 | 13F | WMG Financial Advisors, LLC | 0 | -100,00 | 0 | |||||
| 2026-02-13 | 13F | Delos Wealth Advisors, LLC | 12.099 | 1,58 | 2.785 | 1,87 | ||||
| 2026-02-17 | 13F | Aqr Capital Management Llc | 1.757 | 404 | ||||||
| 2026-01-09 | 13F | jvl associates llc | 1.115 | -4,29 | 257 | -4,12 | ||||
| 2026-02-23 | 13F | Virtu Financial LLC | 26.012 | 30,28 | 6 | 25,00 | ||||
| 2025-11-17 | 13F | Avondale Wealth Management | 0 | -100,00 | 0 | |||||
| 2026-02-04 | 13F | Win Advisors, Inc | 0 | -100,00 | 0 | |||||
| 2026-01-21 | 13F | Sound Income Strategies, LLC | 5.926 | 1.404 | ||||||
| 2026-01-22 | 13F | Apollon Wealth Management, LLC | 5.530 | 5,94 | 1.273 | 6,26 | ||||
| 2026-01-15 | 13F | Santori & Peters, Inc. | 10.033 | 0,75 | 2.310 | 1,01 | ||||
| 2026-02-18 | 13F | Onyx Bridge Wealth Group LLC | 960 | 0,00 | 221 | 0,45 | ||||
| 2026-02-12 | 13F | Moneta Group Investment Advisors Llc | 1.043 | -6,62 | 240 | -6,25 | ||||
| 2026-02-13 | 13F | HFG Advisors, Inc. | 1.433 | 0,00 | 330 | 0,00 | ||||
| 2025-11-12 | 13F | Transce3nd, LLC | 0 | -100,00 | 0 | |||||
| 2026-02-03 | 13F | SBI Securities Co., Ltd. | 54 | 3,85 | 12 | 9,09 | ||||
| 2025-10-31 | 13F | PFG Investments, LLC | 0 | -100,00 | 0 | -100,00 | ||||
| 2026-02-02 | 13F | CENTRAL TRUST Co | 182 | 0,00 | 42 | 0,00 | ||||
| 2026-02-10 | 13F | Envestnet Asset Management Inc | 174.416 | -7,50 | 40.152 | -7,26 | ||||
| 2026-02-04 | 13F | Concentrum Wealth Management | 21.092 | 4,44 | 4.856 | 4,72 | ||||
| 2026-02-17 | 13F | Regal Investment Advisors LLC | 10.284 | -10,03 | 2.368 | -9,79 | ||||
| 2026-02-12 | 13F | Brinker Capital Investments, LLC | 3.191 | 18,98 | 735 | 19,35 | ||||
| 2026-02-10 | 13F | Novak & Powell Financial Services, Inc. | 10.867 | 0,00 | 2.502 | 0,24 | ||||
| 2026-01-14 | 13F | Wealthcare Advisory Partners LLC | 4.368 | -9,17 | 1.006 | -8,97 | ||||
| 2026-02-13 | 13F | Integrated Wealth Concepts LLC | 29.787 | -24,50 | 6.857 | -24,31 | ||||
| 2026-01-30 | 13F | Bogart Wealth, LLC | 167 | 0,00 | 38 | 0,00 | ||||
| 2026-02-10 | 13F | Bnp Paribas Arbitrage, Sa | 13.100 | 0,00 | 3.016 | 0,27 | ||||
| 2026-01-12 | 13F | Daymark Wealth Partners, Llc | 30.614 | 0,93 | 7.048 | 1,19 | ||||
| 2026-02-03 | 13F | Total Investment Management Inc | 944 | 0,00 | 217 | 0,46 | ||||
| 2026-02-13 | 13F | Change Path, LLC | 3.319 | -2,55 | 764 | -2,30 | ||||
| 2026-02-11 | 13F | Monetary Management Group Inc | 150 | 0,00 | 35 | 0,00 | ||||
| 2026-02-06 | 13F | Creative Financial Designs Inc /adv | 111 | 0,00 | 26 | 0,00 | ||||
| 2026-03-06 | 13F | Hsbc Holdings Plc | 19.854 | 262,50 | 4.596 | 268,27 | ||||
| 2026-02-06 | 13F | Blackston Financial Advisory Group, LLC | 1.875 | 2,52 | 432 | 2,62 | ||||
| 2026-01-23 | 13F | Transcend Wealth Collective, Llc | 2.333 | -8,37 | 537 | -8,05 | ||||
| 2025-11-14 | 13F | Jane Street Group, Llc | 0 | -100,00 | 0 | -100,00 | ||||
| 2026-01-26 | 13F | Cwm, Llc | 1.140 | -8,06 | 0 | |||||
| 2026-02-03 | 13F | Ridgeline Wealth Planning, LLC | 1.937 | 0,00 | 446 | 0,23 | ||||
| 2026-01-26 | 13F | Sather Financial Group Inc | 875 | 0,00 | 201 | 0,50 | ||||
| 2026-02-11 | 13F | Jpmorgan Chase & Co | 4.560 | -41,89 | 1.050 | -41,75 | ||||
| 2026-02-05 | 13F | Cambridge Investment Research Advisors, Inc. | 95.802 | -0,47 | 22 | 0,00 | ||||
| 2026-02-17 | 13F | Bank Of America Corp /de/ | 1.171.481 | 51,84 | 269.687 | 52,24 | ||||
| 2026-02-10 | 13F | IFG Advisory, LLC | 3.893 | 896 | ||||||
| 2026-02-17 | 13F | Jones Financial Companies Lllp | 22.828 | 7,81 | 5.255 | 8,75 | ||||
| 2026-01-16 | 13F | Ronald Blue Trust, Inc. | 91 | -14,15 | 21 | -16,67 | ||||
| 2026-02-13 | 13F | Wells Fargo & Company/mn | 476.678 | -0,17 | 109.736 | 0,09 | ||||
| 2026-02-13 | 13F | Sofos Investments, Inc. | 50 | 0,00 | 12 | 0,00 | ||||
| 2026-02-10 | 13F | Sfmg, Llc | 21.287 | -3,06 | 4.901 | -2,80 | ||||
| 2026-02-17 | 13F | Vertex Planning Partners, LLC | 0 | -100,00 | 0 | |||||
| 2026-01-21 | 13F | Wealthbridge Capital Management, Llc | 2.074 | 0,83 | 478 | 1,06 | ||||
| 2026-01-23 | 13F | Journey Beyond Wealth, LLC | 14.767 | -18,64 | 3.399 | -18,43 | ||||
| 2026-02-12 | 13F | Logan Capital Management Inc | 0 | -100,00 | 0 | |||||
| 2026-01-21 | 13F | Crews Bank & Trust | 623 | 0,00 | 143 | 0,00 | ||||
| 2026-01-30 | 13F | Archer Investment Corp | 58 | 0,00 | 13 | 0,00 | ||||
| 2026-02-11 | 13F | Parallel Advisors, LLC | 3.350 | 0,00 | 771 | 0,26 | ||||
| 2026-01-26 | 13F | Merit Financial Group, LLC | 1.071 | 0,00 | 247 | 0,41 | ||||
| 2026-02-12 | 13F | BlackRock, Inc. | 1.206 | 0,00 | 278 | 0,36 | ||||
| 2026-01-08 | 13F | Old Port Advisors | 1.607 | -3,13 | 370 | -2,89 | ||||
| 2026-01-12 | 13F | Salem Investment Counselors Inc | 0 | -100,00 | 0 | |||||
| 2025-11-03 | 13F | Activest Wealth Management | 0 | -100,00 | 0 | |||||
| 2026-01-12 | 13F | Ayalon Holdings Ltd. | 12.356 | 0,00 | 3 | 0,00 | ||||
| 2026-02-05 | 13F | PCG Wealth Advisors, LLC | 13.929 | 0,72 | 3.207 | 0,98 | ||||
| 2026-02-17 | 13F | IHT Wealth Management, LLC | 3.601 | -1,64 | 829 | -1,43 | ||||
| 2026-02-11 | 13F | Hilton Head Capital Partners, LLC | 119 | 27 | ||||||
| 2026-02-06 | 13F | Gsa Capital Partners Llp | 0 | -100,00 | 0 | |||||
| 2026-02-02 | 13F | Sun Financial Inc | 13.127 | 3.022 | ||||||
| 2026-01-07 | 13F | Cyndeo Wealth Partners, LLC | 9.697 | -2,40 | 2.232 | -2,15 | ||||
| 2026-02-12 | 13F | Laurel Oak Wealth Management, Llc | 1.868 | 430 | ||||||
| 2026-02-18 | 13F | EP Wealth Advisors, Inc. | 78.799 | 6,90 | 18.140 | 15,63 | ||||
| 2026-02-17 | 13F | National Asset Management, Inc. | 3.639 | -1,36 | 838 | -1,06 | ||||
| 2026-02-17 | 13F | Coppell Advisory Solutions LLC | 5.466 | 1,35 | 1.274 | 2,83 | ||||
| 2026-02-05 | 13F | Tucker Asset Management Llc | 461 | 106 | ||||||
| 2026-01-27 | 13F/A | Capital Performance Advisors Llp | 6.156 | 1.417 | ||||||
| 2026-01-26 | 13F | Midland Wealth Advisors Llc | 9.405 | 1,50 | 2.165 | 1,79 | ||||
| 2026-01-23 | 13F | Fifth Third Securities, Inc. | 2.064 | 1,88 | 475 | 2,15 | ||||
| 2026-02-12 | 13F | Hm Payson & Co | 815 | 0,00 | 188 | 0,00 | ||||
| 2026-02-13 | 13F | Colony Group, LLC | 4.775 | 29,33 | 1.099 | 29,75 | ||||
| 2026-01-15 | 13F | Guided Capital Wealth Management, LLC | 0 | -100,00 | 0 | |||||
| 2025-10-09 | 13F | Pacifica Partners Inc. | 0 | -100,00 | 0 | |||||
| 2026-01-15 | 13F | Brookstone Capital Management | 3.192 | 186,28 | 735 | 187,84 | ||||
| 2025-11-03 | 13F | Capital Wealth Alliance, LLC | 0 | -100,00 | 0 | -100,00 | ||||
| 2026-01-14 | 13F | Southland Equity Partners LLC | 60.581 | -0,73 | 13.946 | -0,47 | ||||
| 2026-02-12 | 13F | Principal Securities, Inc. | 9.551 | -0,32 | 2.199 | -0,09 | ||||
| 2025-11-12 | 13F | CIBC Bancorp USA Inc. | 6.629 | 1.522 | ||||||
| 2026-02-17 | 13F | Two Sigma Investments, Lp | 0 | -100,00 | 0 | |||||
| 2026-01-21 | 13F | Register Financial Advisors LLC | 2.890 | -4,71 | 665 | -4,45 | ||||
| 2026-02-06 | 13F | Larson Financial Group LLC | 71 | -22,83 | 16 | -23,81 | ||||
| 2026-02-06 | 13F | Pnc Financial Services Group, Inc. | 8.199 | -2,22 | 1.888 | -1,97 | ||||
| 2026-02-06 | 13F | McKinley Carter Wealth Services, Inc. | 5.167 | 0,00 | 1.189 | 0,25 | ||||
| 2026-01-23 | 13F | DHJJ Financial Advisors, Ltd. | 2 | 0,00 | 0 | |||||
| 2026-02-09 | 13F | TradeWell Securities, LLC. | 9.557 | 2,12 | 2.200 | 1,57 | ||||
| 2026-02-13 | 13F | Golden State Wealth Management, LLC | 468 | 0,00 | 108 | 0,00 | ||||
| 2026-02-17 | 13F | Russell Investments Group, Ltd. | 1.183 | -0,08 | 272 | 0,37 | ||||
| 2026-02-03 | 13F | Navellier & Associates Inc | 6.174 | 239,60 | 1.421 | 240,77 | ||||
| 2026-02-04 | 13F | Topsail Wealth Management, LLC | 1.115 | 0,00 | 257 | 0,00 | ||||
| 2026-02-18 | 13F | Caitlin John, LLC | 21 | 0,00 | 5 | 0,00 | ||||
| 2026-01-22 | 13F | Brookwood Investment Group LLC | 1.827 | -0,27 | 421 | 0,00 | ||||
| 2026-02-18 | 13F | First Citizens Bank & Trust Co | 0 | -100,00 | 0 | |||||
| 2026-01-28 | 13F | HB Wealth Management, LLC | 1.097 | 0,00 | 253 | 0,40 | ||||
| 2026-02-13 | 13F/A | Abound Financial, Llc | 901 | -20,48 | 207 | -20,38 | ||||
| 2026-01-21 | 13F | Newbridge Financial Services Group, Inc. | 59 | 0,00 | 14 | 0,00 | ||||
| 2026-02-11 | 13F | First Command Advisory Services, Inc. | 170 | 0,00 | 39 | 0,00 | ||||
| 2026-02-17 | 13F | Creative Planning | 45.332 | -21,36 | 10.436 | -21,16 | ||||
| 2026-01-05 | 13F | Park Avenue Securities Llc | 6.416 | -1,32 | 1 | 0,00 | ||||
| 2026-01-28 | 13F | Migdal Insurance & Financial Holdings Ltd. | 4.249 | -22,73 | 1 | -100,00 | ||||
| 2026-01-05 | 13F | Rosenberg Matthew Hamilton | 8 | 0,00 | 2 | 0,00 | ||||
| 2026-02-02 | 13F | Total Clarity Wealth Management, Inc. | 3.726 | -0,96 | 858 | -0,70 | ||||
| 2026-01-13 | 13F | CoreCap Advisors, LLC | 2.385 | -20,07 | 549 | -19,85 | ||||
| 2026-02-13 | 13F | Ausdal Financial Partners, Inc. | 13.620 | -11,44 | 3.135 | -11,21 | ||||
| 2026-02-17 | 13F | United Capital Financial Advisers, Llc | 1.654 | 0,00 | 381 | 0,26 | ||||
| 2026-01-08 | 13F | Maridea Wealth Management LLC | 24.038 | -4,82 | 5.534 | -7,52 | ||||
| 2026-02-02 | 13F | Truist Financial Corp | 70.791 | -2,26 | 16.297 | -2,01 | ||||
| 2025-11-12 | 13F | Traction Financial Partners, LLC | 0 | -100,00 | 0 | |||||
| 2026-02-09 | 13F | Harbour Investments, Inc. | 38.665 | 3,19 | 8.901 | 3,46 | ||||
| 2026-01-20 | 13F | Trust Co Of Toledo Na /oh/ | 444 | 0,00 | 102 | 0,99 | ||||
| 2026-02-17 | 13F | Signature Equity Partners, LLC | 125 | 29 | ||||||
| 2026-02-13 | 13F | Transamerica Financial Advisors, Inc. | 125 | 29 | ||||||
| 2026-03-05 | 13F | Gunpowder Capital Management, LLC dba Oliver Wealth Management | 52 | 12 | ||||||
| 2026-02-14 | 13F | Rockefeller Capital Management L.P. | 10.722 | 36,08 | 2.468 | 36,43 | ||||
| 2025-11-14 | 13F | Moors & Cabot, Inc. | 0 | -100,00 | 0 | |||||
| 2026-01-14 | 13F | Kraft, Davis & Associates, LLC | 61.707 | 44,06 | 14.758 | 45,75 | ||||
| 2026-02-02 | 13F | Oppenheimer & Co Inc | 3.354 | -18,57 | 772 | -18,31 | ||||
| 2026-02-04 | 13F | Atlantic Union Bankshares Corp | 89 | 0,00 | 20 | 0,00 | ||||
| 2025-11-13 | 13F | Wells Fargo & Company/mn | Put | 0 | -100,00 | 0 | -100,00 | |||
| 2026-02-06 | 13F | Tanglewood Legacy Advisors, LLC | 506 | 0,00 | 116 | 0,00 | ||||
| 2026-02-13 | 13F | Evelyn Partners Investment Management (Europe) Ltd | 3.717 | -6,07 | 856 | -5,84 | ||||
| 2026-02-09 | 13F | Frazier Financial Advisors, LLC | 74 | 17 | ||||||
| 2026-02-05 | 13F | Castle Rock Wealth Management, LLC | 3.204 | -1,02 | 729 | -3,44 | ||||
| 2026-02-02 | 13F | Aurora Private Wealth, Inc. | 9.466 | 95,14 | 2 | 100,00 | ||||
| 2026-02-04 | 13F | Nwm Advisors, Llc | 20.481 | 4.715 | ||||||
| 2026-02-05 | 13F | Maxele Advisors, LLC | 29.637 | -0,90 | 6.823 | -0,64 | ||||
| 2026-02-11 | 13F | Sunrise Financial Services, LLC | 858 | 198 | ||||||
| 2026-02-17 | 13F | Jump Financial, LLC | 50.686 | 11.668 | ||||||
| 2026-02-10 | 13F | Goldman Sachs Group Inc | 0 | -100,00 | 0 | |||||
| 2025-11-14 | 13F | Knightsbridge Asset Management, Llc | 1.700 | 0,00 | 390 | 8,03 | ||||
| 2026-02-09 | 13F | Keating Financial Advisory Services, Inc. | 35 | 8 | ||||||
| 2025-11-14 | 13F | Skopos Labs, Inc. | 0 | -100,00 | 0 | |||||
| 2026-02-06 | 13F | Cullen/frost Bankers, Inc. | 1.441 | 4,12 | 332 | 4,42 | ||||
| 2025-10-30 | 13F | WFA Asset Management Corp | 311 | 0,00 | 59 | -3,28 | ||||
| 2026-01-20 | 13F | Sovran Advisors, LLC | 1.054 | -15,41 | 250 | -16,44 | ||||
| 2026-01-27 | 13F | Belpointe Asset Management LLC | 15.398 | -10,83 | 3.545 | -10,59 | ||||
| 2026-01-14 | 13F | Spire Wealth Management | 873 | -1,58 | 201 | -1,48 | ||||
| 2026-01-29 | 13F | Concurrent Investment Advisors, LLC | 13.580 | 69,07 | 3.126 | 69,52 | ||||
| 2025-11-14 | 13F | Old Mission Capital Llc | 0 | -100,00 | 0 | |||||
| 2026-02-13 | 13F | Aptus Capital Advisors, LLC | 1.418 | 3,43 | 326 | 3,82 | ||||
| 2026-01-14 | 13F | Nova Wealth Management, Inc. | 46 | 0,00 | 11 | 0,00 | ||||
| 2026-02-17 | 13F | Citadel Advisors Llc | 0 | -100,00 | 0 | |||||
| 2026-01-21 | 13F | Sowell Financial Services LLC | 15.615 | -0,46 | 3.595 | -0,19 | ||||
| 2026-02-17 | 13F | Royal Bank Of Canada | 184.306 | 7,43 | 42.428 | 7,71 | ||||
| 2026-02-17 | 13F | Trexquant Investment LP | 962 | -2,24 | 221 | -1,78 | ||||
| 2025-10-23 | 13F | Creative Capital Management Investments LLC | 0 | -100,00 | 0 | |||||
| 2026-02-17 | 13F | Clark Capital Management Group, Inc. | 1.837 | 3,38 | 423 | 3,43 | ||||
| 2026-02-09 | 13F | Thrive Capital Management, LLC | 1.502 | -25,24 | 346 | -25,16 | ||||
| 2025-11-04 | 13F | Legend Financial Advisors, Inc. | 0 | -100,00 | 0 | |||||
| 2026-02-13 | 13F | SRS Capital Advisors, Inc. | 2.908 | 669 | ||||||
| 2026-02-05 | 13F | AMJ Financial Wealth Management | 2.641 | 25,94 | 608 | 26,20 | ||||
| 2026-01-12 | 13F | RVW Wealth, LLC | 85.690 | -2,88 | 19.727 | -2,63 | ||||
| 2026-01-20 | 13F | Signaturefd, Llc | 952 | 0,00 | 219 | 0,46 | ||||
| 2026-01-30 | 13F | Us Bancorp \de\ | 8.468 | -5,16 | 1.949 | -4,93 | ||||
| 2026-02-11 | 13F | Paragon Private Wealth Management, LLC | 8.451 | -2,04 | 1.946 | -1,77 | ||||
| 2026-02-18 | 13F | Plotkin Financial Advisors, LLC | 0 | -100,00 | 0 | |||||
| 2026-01-15 | 13F | Royal Fund Management, LLC | 2.219 | 1,74 | 511 | 2,00 | ||||
| 2026-02-12 | 13F | Renaissance Technologies Llc | 6.500 | 1.496 | ||||||
| 2026-02-05 | 13F | Stonebridge Financial Planning Group, LLC | 3.053 | -1,36 | 703 | -1,13 | ||||
| 2026-02-02 | 13F | Oak Harbor Wealth Partners, Llc | 2.140 | 0,00 | 493 | 0,20 | ||||
| 2026-01-07 | 13F | TruWealth Advisors, LLC | 1.874 | 0,00 | 431 | 0,23 | ||||
| 2026-02-17 | 13F | NewSquare Capital LLC | 66.164 | -33,66 | 15.232 | -33,49 | ||||
| 2026-01-23 | 13F | ABLE Financial Group, LLC | 1.377 | 1,03 | 317 | 1,28 | ||||
| 2026-01-06 | 13F | Nelson, Van Denburg & Campbell Wealth Management Group, LLC | 1.836 | -1,34 | 423 | -1,17 | ||||
| 2026-02-17 | 13F | Susquehanna International Group, Llp | 4.320 | 115,35 | 995 | 116,09 | ||||
| 2026-01-29 | 13F | D.a. Davidson & Co. | 14.751 | -1,33 | 3.396 | -1,08 | ||||
| 2026-02-10 | 13F | Argent Trust Co | 2.225 | 0,00 | 512 | 0,39 | ||||
| 2026-01-14 | 13F | ORG Wealth Partners, LLC | 203 | 0,00 | 47 | 0,00 | ||||
| 2026-01-20 | 13F | Stratos Wealth Partners, LTD. | 12.652 | 1,61 | 2.913 | 1,89 | ||||
| 2026-03-03 | 13F | NWF Advisory Services Inc. | 890 | 0,00 | 205 | 0,00 | ||||
| 2026-02-17 | 13F | Snowden Capital Advisors LLC | 14.785 | -2,05 | 3.404 | -1,82 | ||||
| 2026-02-12 | 13F | Steward Partners Investment Advisory, Llc | 5.233 | -3,65 | 1.205 | -3,45 | ||||
| 2026-01-30 | 13F | Wealthfront Advisers Llc | 12.530 | 10,48 | 2.885 | 10,75 | ||||
| 2026-01-23 | 13F | Assetmark, Inc | 40.498 | 6,20 | 9.323 | 6,49 | ||||
| 2026-02-04 | 13F | Rollins Financial Advisors, LLC | 7.524 | -0,17 | 1.732 | 0,12 | ||||
| 2026-02-17 | 13F | Susquehanna International Group, Llp | Call | 2.000 | 42,86 | 460 | 43,30 | |||
| 2026-01-12 | 13F | DAVENPORT & Co LLC | 2.109 | -4,09 | 486 | -3,77 | ||||
| 2026-02-03 | 13F | Acorn Financial Advisory Services Inc /adv | 1.522 | -0,07 | 350 | 0,29 | ||||
| 2026-01-29 | 13F | Eagle Wealth Advisors LLC | 3.753 | 864 | ||||||
| 2026-01-26 | 13F | AE Wealth Management LLC | 13.755 | -5,46 | 3.166 | -5,21 | ||||
| 2026-02-17 | 13F/A | Kovack Advisors, Inc. | 937 | 216 | ||||||
| 2026-02-12 | 13F | Investor's Fiduciary Advisor Network, LLC | 4.157 | -2,44 | 1 | |||||
| 2026-01-29 | 13F | Quadcap Wealth Management, LLC | 1.908 | 0,95 | 439 | 1,39 | ||||
| 2026-01-13 | 13F | Signature Securities Group Corporation | 1.284 | 1,50 | 296 | 1,72 | ||||
| 2026-02-11 | 13F | LPL Financial LLC | 632.066 | 4,44 | 145.508 | 4,71 | ||||
| 2026-01-08 | 13F | Dagco, Inc. | 702 | 0,00 | 162 | 0,00 | ||||
| 2026-01-07 | 13F | Lake Street Financial Llc | 1.037 | -0,77 | 239 | -0,42 | ||||
| 2026-02-17 | 13F | Fmr Llc | 6.788 | -5,55 | 1.563 | -5,33 | ||||
| 2026-01-09 | 13F | First Heartland Consultants, Inc. | 928 | -58,53 | 214 | -58,48 | ||||
| 2026-01-28 | 13F | N.E.W. Advisory Services LLC | 40 | 100,00 | 9 | 125,00 | ||||
| 2026-02-05 | 13F | Cornerstone Wealth Management, LLC | 2.805 | 0,00 | 646 | 0,16 | ||||
| 2026-02-13 | 13F | Baird Financial Group, Inc. | 48.577 | -4,69 | 11.183 | -4,45 | ||||
| 2026-02-17 | 13F | Private Advisor Group, LLC | 35.533 | -12,72 | 8.180 | -12,49 | ||||
| 2026-02-12 | 13F | StoneX Group Inc. | 2.272 | 4,36 | 523 | 4,81 | ||||
| 2026-01-23 | 13F | Farther Finance Advisors, LLC | 4.678 | -1,95 | 1.077 | -1,74 | ||||
| 2026-02-11 | 13F | O'shaughnessy Asset Management, Llc | 149 | 34 | ||||||
| 2025-11-10 | 13F | Kovitz Investment Group Partners, LLC | 0 | -100,00 | 0 | |||||
| 2026-02-02 | 13F | Mutual Advisors, LLC | 2.129 | 59,48 | 490 | 55,06 | ||||
| 2026-01-22 | 13F | Harwood Advisory Group, LLC | 674 | -3,71 | 155 | -3,12 | ||||
| 2026-01-29 | 13F | Sanctuary Advisors, LLC | 2.980 | -1,00 | 686 | -0,72 | ||||
| 2026-01-28 | 13F | Chicago Partners Investment Group LLC | 5.404 | 0,90 | 1.290 | -0,92 | ||||
| 2026-02-10 | 13F | Welch & Forbes Llc | 2.493 | 0,00 | 574 | 0,17 | ||||
| 2026-01-07 | 13F | Central Pacific Bank - Trust Division | 26 | 0,00 | 6 | 0,00 | ||||
| 2026-01-15 | 13F | Elser Financial Planning, Inc | 5.783 | 0,00 | 1.331 | -1,55 | ||||
| 2026-02-12 | 13F | CIBC Private Wealth Group, LLC | 6.629 | 0,00 | 1.526 | 0,26 | ||||
| 2026-02-06 | 13F | Evoke Wealth, Llc | 880 | 0,00 | 203 | 0,00 | ||||
| 2026-02-13 | 13F | National Bank Of Canada /fi/ | 1.720 | 0,00 | 396 | 0,25 | ||||
| 2026-02-10 | 13F | Syntegra Private Wealth Group, LLC | 38.769 | -68,01 | 8.925 | -67,93 | ||||
| 2026-01-28 | 13F | Leelyn Smith, LLC | 1.653 | -14,88 | 381 | -14,61 | ||||
| 2026-02-13 | 13F | B&D White Capital Company, LLC | 11.147 | 0,00 | 2.566 | 0,27 | ||||
| 2026-02-13 | 13F | Smartleaf Asset Management LLC | 212 | 341,67 | 49 | 345,45 | ||||
| 2026-02-13 | 13F | MAI Capital Management | 2.025 | -3,89 | 466 | -3,52 | ||||
| 2026-02-17 | 13F | Fwl Investment Management, Llc | 7.463 | 1,47 | 1.718 | 1,72 | ||||
| 2026-02-09 | 13F | Huntington National Bank | 0 | |||||||
| 2026-02-05 | 13F | Allworth Financial LP | 120.004 | -4,84 | 27.626 | -4,60 | ||||
| 2026-02-17 | 13F | Minichmacgregor Wealth Management, Llc | 1.141 | -0,78 | 263 | -0,76 | ||||
| 2026-02-18 | 13F | GWM Advisors LLC | 32.877 | 15,21 | 7.569 | 15,51 | ||||
| 2026-02-10 | 13F | Bbr Partners, Llc | 11.888 | 0,00 | 2.737 | 0,26 | ||||
| 2026-01-13 | 13F | Mather Group, Llc. | 1.935 | -30,37 | 445 | -30,25 | ||||
| 2026-01-30 | 13F | Caldwell Trust Co | 30 | 0,00 | 7 | 0,00 | ||||
| 2026-02-11 | 13F | Gateway Wealth Partners, LLC | 11.485 | 15,67 | 2.644 | 15,97 | ||||
| 2026-01-23 | 13F | Clear Creek Financial Management, LLC | 1.786 | -0,50 | 411 | -0,24 | ||||
| 2026-02-17 | 13F | Ameriprise Financial Inc | 78.790 | 1,13 | 18.138 | 1,22 | ||||
| 2026-02-10 | 13F | Godfrey Financial Associates, Inc. | 200 | 46 | ||||||
| 2026-02-12 | 13F | Empower Advisory Group, LLC | 1.650 | 30,23 | 380 | 30,69 | ||||
| 2026-01-16 | 13F | Genesee Capital Advisors, LLC | 869 | 200 | ||||||
| 2026-02-06 | 13F | Lloyd Advisory Services, LLC. | 9 | 2 | ||||||
| 2026-01-28 | 13F | Geneos Wealth Management Inc. | 13.145 | 8,30 | 3.026 | 8,58 | ||||
| 2025-11-14 | 13F | Susquehanna International Group, Llp | Put | 0 | -100,00 | 0 | -100,00 | |||
| 2026-02-13 | 13F | Element Wealth, LLC | 6.876 | -8,50 | 1.583 | -8,29 | ||||
| 2026-02-13 | 13F | Arkadios Wealth Advisors | 10.726 | -0,78 | 2.469 | -0,48 | ||||
| 2026-01-12 | 13F | Horizon Financial Services, Llc | 50 | 0,00 | 12 | 0,00 | ||||
| 2026-02-12 | 13F | Wealthspire Advisors, LLC | 942 | 0,00 | 217 | 0,00 | ||||
| 2026-02-13 | 13F | Kestra Advisory Services, LLC | 0 | -100,00 | 0 | |||||
| 2025-10-28 | 13F | MeadowBrook Investment Advisors LLC | 0 | -100,00 | 0 | -100,00 | ||||
| 2026-02-12 | 13F | Triumph Capital Management | 297 | -2,30 | 68 | -1,45 | ||||
| 2026-01-21 | 13F | Y.D. More Investments Ltd | 260 | 0,00 | 60 | 0,00 | ||||
| 2026-02-13 | 13F | Gts Securities Llc | 6.799 | -60,66 | 1.565 | -60,58 | ||||
| 2026-02-13 | 13F | Mariner, LLC | 45.645 | -1,94 | 10.508 | -1,68 | ||||
| 2026-01-29 | 13F | UBS Group AG | 272.008 | 5,13 | 62.619 | 5,41 | ||||
| 2026-02-10 | 13F/A | Northwestern Mutual Wealth Management Co | 48.534 | 0,98 | 11.173 | 1,24 | ||||
| 2026-02-13 | 13F | Pine Valley Investments Ltd Liability Co | 4.111 | 1,73 | 946 | 2,05 | ||||
| 2026-02-13 | 13F | Stifel Financial Corp | 59.278 | -1,33 | 13.646 | -1,07 | ||||
| 2026-02-17 | 13F | Gladstone Institutional Advisory LLC | 2.089 | 1,65 | 481 | 1,91 | ||||
| 2026-01-15 | 13F | Nilsine Partners, LLC | 5.953 | -42,01 | 1.370 | -41,88 | ||||
| 2026-01-26 | 13F | United Advisor Group, LLC | 3.088 | 2,35 | 711 | 2,60 | ||||
| 2026-02-17 | 13F | Eddie Patel Inc | 2.666 | 614 | ||||||
| 2025-11-14 | 13F | Capstone Investment Advisors, Llc | 5.673 | -66,18 | 1.303 | -63,53 | ||||
| 2026-02-04 | 13F | Pensionmark Financial Group, Llc | 12.174 | -11,21 | 2.644 | -16,04 | ||||
| 2026-02-10 | 13F | Beaton Management Co. Inc. | 2.150 | 0,00 | 0 | |||||
| 2026-02-03 | 13F | RFG Advisory, LLC | 10.843 | 34,68 | 2.496 | 35,06 | ||||
| 2026-02-06 | 13F | Fortis Group Advisors, LLC | 170 | 0,00 | 39 | 0,00 | ||||
| 2026-01-23 | 13F | HBW Advisory Services LLC | 5.486 | 169,98 | 1.263 | 171,03 | ||||
| 2026-02-17 | 13F | Cresset Asset Management, LLC | 4.136 | 0,00 | 952 | 0,32 | ||||
| 2026-01-12 | 13F | Focus Financial Network, Inc. | 16.095 | 13,23 | 3.705 | 13,55 | ||||
| 2026-02-03 | 13F | RWM Asset Management, LLC | 1.515 | 0,00 | 364 | 4,61 | ||||
| 2026-02-06 | 13F | HighTower Advisors, LLC | 8.574 | 0,01 | 1.974 | 0,25 | ||||
| 2026-02-05 | 13F | Stephens Inc /ar/ | 2.920 | 24,63 | 672 | 25,14 | ||||
| 2026-02-17 | 13F | Wiley Bros.-aintree Capital, Llc | 1.881 | 4,04 | 433 | 4,34 | ||||
| 2026-02-17 | 13F | Cape Investment Advisory, Inc. | 4 | -89,19 | 1 | -100,00 | ||||
| 2026-02-06 | 13F | Reliant Investment Partners, LLC | 1.170 | 0,00 | 269 | -1,10 | ||||
| 2025-11-10 | 13F | IFS Group,LLC | 1.279 | 296 | ||||||
| 2026-01-26 | 13F | Whittier Trust Co | 681 | 0,00 | 165 | 3,80 | ||||
| 2026-01-29 | 13F | Comerica Bank | 1.294 | -35,24 | 298 | -35,15 | ||||
| 2026-02-17 | 13F | Mpwm Advisory Solutions, Llc | 0 | -100,00 | 0 | |||||
| 2026-02-05 | 13F | Fingerlakes Wealth Management, Inc. | 2.459 | -17,98 | 566 | -17,88 | ||||
| 2026-02-03 | 13F | Diversify Wealth Management, Llc | 1.920 | 0,00 | 459 | -1,29 | ||||
| 2026-02-06 | 13F | Vestmark Advisory Solutions, Inc. | 26.015 | -2,02 | 5.989 | -1,77 | ||||
| 2026-02-13 | 13F | Centaurus Financial, Inc. | 0 | -100,00 | 0 | |||||
| 2026-02-17 | 13F | MGB Wealth Management, LLC | 15.417 | -4,69 | 3.553 | -4,36 | ||||
| 2026-02-17 | 13F | Equitable Holdings, Inc. | 2.863 | 44,82 | 659 | 45,47 | ||||
| 2026-01-28 | 13F | Financial Perspectives, Inc | 35 | 8 | ||||||
| 2026-02-17 | 13F | GeoWealth Management, LLC | 1.060 | -77,88 | 244 | -77,82 | ||||
| 2026-02-13 | 13F | Mml Investors Services, Llc | 19.250 | -0,24 | 4.431 | 0,02 | ||||
| 2026-02-02 | 13F | Robertson Stephens Wealth Management, LLC | 3.059 | -9,42 | 704 | -9,16 | ||||
| 2026-02-05 | 13F | Atria Investments Llc | 21.990 | -8,58 | 5.062 | -8,35 | ||||
| 2026-01-26 | 13F | Nations Financial Group Inc, /ia/ /adv | 975 | 224 | ||||||
| 2026-02-11 | 13F | Miller Investment Management, LP | 0 | -100,00 | 0 | |||||
| 2026-02-05 | 13F | Avantax Planning Partners, Inc. | 1.296 | 0,00 | 298 | 0,34 | ||||
| 2026-02-17 | 13F | Captrust Financial Advisors | 10.252 | 0,38 | 2.360 | 0,64 | ||||
| 2026-02-13 | 13F | J Hagan Capital, Inc. | 1.138 | -77,71 | 262 | -77,65 | ||||
| 2026-02-13 | 13F | Jacobi Capital Management LLC | 6.221 | -3,49 | 1.432 | -3,24 | ||||
| 2026-02-03 | 13F | Luken Investment Analytics, LLC | 160 | 0,00 | 37 | 0,00 | ||||
| 2026-02-12 | 13F | Bank Of Montreal /can/ | 892 | 0,00 | 205 | 0,49 | ||||
| 2026-02-02 | 13F | Benjamin Edwards Inc | 21.833 | 0,85 | 5.028 | 1,09 | ||||
| 2025-10-08 | 13F | Patriot Financial Group Insurance Agency, LLC | 0 | -100,00 | 0 | -100,00 | ||||
| 2026-01-27 | 13F | Morey & Quinn Wealth Partners, LLC | 1.075 | 0,00 | 248 | 0,41 | ||||
| 2026-02-17 | 13F | Mercer Global Advisors Inc /adv | 5.725 | -4,68 | 1.318 | -4,42 | ||||
| 2026-02-05 | 13F | L & S Advisors Inc | 1.763 | 0,00 | 406 | 0,25 | ||||
| 2026-02-13 | 13F | Resources Investment Advisors, LLC. | 17.336 | -2,88 | 3.991 | -2,64 | ||||
| 2026-02-05 | 13F | BlueChip Wealth Advisors LLC | 2.235 | 15,56 | 515 | 15,77 | ||||
| 2026-02-05 | 13F | Pacific Sun Financial Corp | 5.837 | 0,34 | 1.344 | 0,60 | ||||
| 2026-02-06 | 13F | Global Retirement Partners, LLC | 19.877 | -6,79 | 4.576 | -6,56 | ||||
| 2026-01-27 | 13F | Purus Wealth Management, LLC | 1.173 | 0,00 | 270 | 0,37 | ||||
| 2026-02-03 | 13F | Cassaday & Co Wealth Management LLC | 2.050 | 472 | ||||||
| 2026-02-17 | 13F | Ameriflex Group, Inc. | 25 | -50,00 | 6 | -54,55 | ||||
| 2026-02-09 | 13F | MTM Investment Management, LLC | 14.405 | 0,00 | 3.316 | 0,27 | ||||
| 2026-02-17 | 13F | Tower Research Capital LLC (TRC) | 7.201 | 221,62 | 1.658 | 222,37 | ||||
| 2026-02-09 | 13F | Hartland & Co., LLC | 694 | -1,84 | 160 | -1,85 | ||||
| 2026-02-05 | 13F | Three Cord True Wealth Management, LLC | 1.567 | 0,00 | 361 | 0,28 | ||||
| 2026-01-26 | 13F | Private Trust Co Na | 122 | -94,25 | 28 | -94,25 | ||||
| 2026-01-05 | 13F | GAMMA Investing LLC | 5 | 0,00 | 1 | 0,00 | ||||
| 2026-02-11 | 13F | Cerity Partners LLC | 2.394 | 0,00 | 551 | 0,36 | ||||
| 2026-02-13 | 13F | Citigroup Inc | 61.413 | 271,05 | 14.138 | 272,03 | ||||
| 2026-01-20 | 13F | Thurston, Springer, Miller, Herd & Titak, Inc. | 32 | 7 | ||||||
| 2026-02-13 | 13F | Tradewinds, LLC. | 1.299 | -5,60 | 299 | -5,08 | ||||
| 2026-02-17 | 13F | Optiver Holding B.V. | 0 | -100,00 | 0 | |||||
| 2026-02-17 | 13F | Two Sigma Securities, Llc | 1.313 | -53,88 | 302 | -53,75 | ||||
| 2026-02-03 | 13F | Ballentine Partners, LLC | 882 | 0,00 | 203 | 0,50 | ||||
| 2026-02-10 | 13F | Tidemark, LLC | 91 | 0,00 | 21 | 0,00 | ||||
| 2026-02-12 | 13F | Jane Street Group, Llc | Call | 1.000 | 230 | |||||
| 2026-01-20 | 13F | AdvisorNet Financial, Inc | 9 | 0,00 | 2 | 0,00 | ||||
| 2026-01-29 | 13F | Quest 10 Wealth Builders, Inc. | 201 | 0,00 | 46 | 0,00 | ||||
| 2026-02-06 | 13F | IFP Advisors, Inc | 12.257 | 5,98 | 2.822 | 6,25 | ||||
| 2026-01-07 | 13F | Holistic Financial Partners | 18.872 | 4,96 | 4.345 | 5,23 | ||||
| 2026-02-10 | 13F | REAP Financial Group, LLC | 172 | 0,00 | 40 | 0,00 | ||||
| 2026-02-10 | 13F | Texas Yale Capital Corp. | 21.418 | 0,00 | 4.931 | 0,26 | ||||
| 2026-02-13 | 13F | Evelyn Partners Investment Management LLP | 175 | 40 | ||||||
| 2026-02-17 | 13F | Modern Wealth Management, LLC | 2.401 | -0,41 | 553 | -0,18 | ||||
| 2026-01-07 | 13F | TCP Asset Management, LLC | 1.971 | -3,71 | 454 | -3,62 | ||||
| 2026-02-03 | 13F | Koshinski Asset Management, Inc. | 889 | 0,00 | 205 | 0,00 | ||||
| 2026-02-13 | 13F | First Trust Advisors Lp | 987 | 227 | ||||||
| 2026-01-28 | 13F | Kingswood Wealth Advisors, Llc | 3.177 | 731 | ||||||
| 2026-02-09 | 13F | Kingsview Wealth Management, LLC | 6.078 | 0,55 | 1.399 | 0,79 | ||||
| 2025-11-05 | 13F | Moloney Securities Asset Management, LLC | 905 | 208 | ||||||
| 2026-02-06 | 13F | Addison Advisors LLC | 91 | 0,00 | 21 | 0,00 | ||||
| 2026-02-05 | 13F | Kapstone Financial Advisors LLC | 1.441 | -1,50 | 332 | -1,19 | ||||
| 2025-11-14 | 13F | Brass Tax Wealth Management, Inc | 29.805 | -2,65 | 6.843 | 5,03 | ||||
| 2026-02-03 | 13F | Financial Partners Group, Inc | 8.561 | -0,59 | 2.016 | 1,97 | ||||
| 2026-02-12 | 13F | Betterment LLC | 2.236 | -0,04 | 1 | |||||
| 2026-01-09 | 13F | Peterson Wealth Advisors, LLC | 2.749 | -28,87 | 633 | -29,62 | ||||
| 2026-02-10 | 13F | Savant Capital, LLC | 0 | -100,00 | 0 | |||||
| 2026-01-30 | 13F | Sigma Planning Corp | 1.223 | -48,24 | 281 | -48,15 | ||||
| 2026-02-13 | 13F | 1832 Asset Management L.P. | 944 | 0,00 | 217 | 0,46 | ||||
| 2026-02-10 | 13F | Measured Wealth Private Client Group, LLC | 14 | 3 | ||||||
| 2026-01-08 | 13F | Wealth Enhancement Advisory Services, Llc | 8.465 | 1,45 | 2.045 | 5,36 | ||||
| 2026-01-28 | 13F | Atwood & Palmer Inc | 200 | 0,00 | 46 | 2,22 | ||||
| 2026-02-06 | 13F | Envestnet Portfolio Solutions, Inc. | 4.803 | -2,16 | 1.106 | -1,95 | ||||
| 2026-02-09 | 13F | Integrity Alliance, Llc. | 971 | 224 | ||||||
| 2026-02-19 | 13F | CI Private Wealth, LLC | 1.060 | 3,21 | 244 | 3,83 | ||||
| 2026-01-14 | 13F | Baugh & Associates, LLC | 992 | -0,10 | 220 | 0,46 | ||||
| 2026-02-03 | 13F | Apeiron RIA LLC | 6.920 | -2,69 | 1.649 | 0,06 | ||||
| 2025-11-07 | 13F | Synovus Financial Corp | 3.102 | -4,05 | 712 | 3,49 | ||||
| 2026-01-26 | 13F | Whittier Trust Co Of Nevada Inc | 2.073 | 61,57 | 501 | 67,22 | ||||
| 2026-02-11 | 13F | Janney Montgomery Scott LLC | 94.971 | 0,81 | 22 | 0,00 | ||||
| 2026-02-13 | 13F | Centerpoint Advisors, LLC | 120 | 13,21 | 0 | |||||
| 2026-02-17 | 13F | Qube Research & Technologies Ltd | 19 | 4 | ||||||
| 2026-02-11 | 13F | Capital Analysts, Inc. | 0 | -100,00 | 0 | |||||
| 2026-01-29 | 13F | Nbc Securities, Inc. | 891 | 23,92 | 205 | 24,24 | ||||
| 2026-02-02 | 13F | CX Institutional | 2.367 | -21,18 | 1 | |||||
| 2026-01-20 | 13F | Accel Wealth Management | 3.593 | -3,49 | 827 | -3,16 | ||||
| 2026-01-21 | 13F | Summa Corp. | 962 | 0,00 | 223 | 0,91 | ||||
| 2026-02-17 | 13F | Pinnacle Family Advisors, LLC | 1.273 | -50,51 | 293 | -50,34 | ||||
| 2025-11-12 | 13F | Headlands Technologies LLC | 0 | -100,00 | 0 | |||||
| 2026-02-04 | 13F | Ameritas Advisory Services, LLC | 0 | -100,00 | 0 | |||||
| 2026-02-17 | 13F | Ancora Advisors, LLC | 69 | 0,00 | 16 | 0,00 | ||||
| 2026-02-13 | 13F | Excelsior Advisor Network LLC | 870 | 200 | ||||||
| 2026-02-17 | 13F | Advisor Group Holdings, Inc. | 134.494 | -25,29 | 30.971 | -21,40 | ||||
| 2026-02-17 | 13F | Bank Hapoalim Bm | 5.236 | 82,95 | 1 | |||||
| 2026-02-12 | 13F | Great Valley Advisor Group, Inc. | 31.028 | -0,60 | 7.143 | -0,33 | ||||
| 2026-02-12 | 13F | Summit Financial, LLC | 9.123 | -4,04 | 2.100 | -3,80 | ||||
| 2026-02-17 | 13F | Raymond James Financial Inc | 328.434 | 2,09 | 75.609 | 2,36 | ||||
| 2026-02-17 | 13F | LaSalle St. Investment Advisors, LLC | 0 | -100,00 | 0 | |||||
| 2026-02-03 | 13F | NewEdge Wealth, LLC | 5.478 | -2,44 | 1.261 | -5,47 | ||||
| 2026-01-16 | 13F | Trust Co Of Vermont | 230 | 48,39 | 53 | 48,57 | ||||
| 2026-02-10 | 13F | IAG Wealth Partners, LLC | 89 | 0,00 | 20 | 0,00 | ||||
| 2026-02-10 | 13F | Bank of New York Mellon Corp | 10.356 | 0,09 | 2.384 | 0,38 | ||||
| 2026-02-18 | 13F | Pacific Excel Wealth Advisors, Inc. | 1.934 | 445 | ||||||
| 2026-02-06 | 13F | Copia Wealth Management | 636 | 0,00 | 146 | 0,00 | ||||
| 2026-01-23 | 13F | Mainsail Financial Group, LLC | 35.136 | 2,07 | 8.089 | 2,33 | ||||
| 2026-01-27 | 13F | PFG Advisors | 3.771 | -6,40 | 868 | -6,16 | ||||
| 2026-01-28 | 13F | Davis Capital Management | 89 | -13,59 | 20 | -13,04 | ||||
| 2026-02-17 | 13F | Warren Averett Asset Management, LLC | 29.399 | 6.768 | ||||||
| 2026-02-14 | 13F | POM Investment Strategies, LLC | 7 | 0,00 | 2 | 0,00 | ||||
| 2026-02-13 | 13F | Baltimore-Washington Financial Advisors, Inc. | 1.419 | 0,00 | 327 | 0,31 | ||||
| 2026-01-07 | 13F | Harbor Investment Advisory, Llc | 1.475 | 0,00 | 340 | 0,30 | ||||
| 2026-02-09 | 13F | Sensible Money, LLC | 4.266 | 0,00 | 982 | 0,31 | ||||
| 2026-02-12 | 13F | Hrt Financial Lp | 2.980 | 1 | ||||||
| 2026-01-26 | 13F | Iams Wealth Management, Llc | 10.005 | -4,84 | 2.303 | -4,60 | ||||
| 2026-02-12 | 13F | Wedbush Securities Inc | 8.570 | 10,82 | 2 | 0,00 | ||||
| 2026-02-13 | 13F | Marshall Wace, Llp | 0 | -100,00 | 0 | |||||
| 2026-02-12 | 13F | Commonwealth Equity Services, Llc | 61.171 | -11,55 | 14.082 | 93.780,00 | ||||
| 2026-01-28 | 13F | Diversified Enterprises, LLC | 7.307 | 0,00 | 1.682 | 0,30 | ||||
| 2026-02-17 | 13F | Citadel Advisors Llc | Call | 1.800 | 100,00 | 414 | 100,97 | |||
| 2026-02-13 | 13F | Morgan Stanley | 621.138 | 0,77 | 142.992 | 1,03 | ||||
| 2026-01-14 | 13F | Catalyst Private Wealth, Llc | 1.251 | 0,00 | 288 | 0,00 | ||||
| 2026-02-17 | 13F | Advisory Services Network, LLC | 0 | -100,00 | 0 | |||||
| 2025-10-28 | 13F | BRYN MAWR TRUST Co | 231 | 0,00 | 53 | 8,16 | ||||
| 2026-01-26 | 13F | Paradigm Financial Partners, Llc | 923 | -7,79 | 212 | -7,42 | ||||
| 2026-02-13 | 13F | Flow Traders U.s. Llc | 0 | -100,00 | 0 | |||||
| 2026-02-20 | 13F | Sunbelt Securities, Inc. | 812 | 0,00 | 187 | 0,54 | ||||
| 2026-02-13 | 13F | Asset Allocation Strategies LLC | 1.301 | 299 | ||||||
| 2026-02-17 | 13F | Harvest Investment Services, LLC | 955 | 1,06 | 220 | 1,39 | ||||
| 2026-02-03 | 13F | Anfield Capital Management, LLC | 21 | 0,00 | 5 | 0,00 | ||||
| 2026-02-06 | 13F | GPS Wealth Strategies Group, LLC | 0 | -100,00 | 0 | |||||
| 2026-02-17 | 13F | Blair William & Co/il | 6.066 | -0,95 | 1.396 | -0,71 | ||||
| 2026-02-03 | 13F | Centerpoint Advisory Group | 1.817 | -2,31 | 418 | -2,11 | ||||
| 2026-02-06 | 13F | Signature Estate & Investment Advisors Llc | 2.357 | -1,38 | 543 | -1,09 | ||||
| 2026-02-11 | 13F | Hughes Financial Services, LLC | 116 | 0,00 | 27 | -3,70 | ||||
| 2026-02-11 | 13F | OneAscent Financial Services LLC | 7.987 | -5,39 | 1.839 | -5,16 |