Grundlæggende statistik
| Institutionelle ejere | 229 total, 222 long only, 1 short only, 6 long/short - change of -4,96% MRQ |
| Gennemsnitlig porteføljeallokering | 0.0597 % - change of -7,81% MRQ |
| Institutionelle aktier (lange) | 82.392.780 (ex 13D/G) - change of -7,92MM shares -8,77% MRQ |
| Institutionel værdi (lang) | $ 183.011 USD ($1000) |
Institutionelt ejerskab og aktionærer
Prospect Capital Corporation (US:PSEC) har 229 institutionelle ejere og aktionærer, der har indsendt 13D/G- eller 13F-formularer til Securities Exchange Commission (SEC). Disse institutioner har i alt 82,392,780 aktier. Største aktionærer omfatter Van Eck Associates Corp, Two Sigma Advisers, Lp, Two Sigma Investments, Lp, Marshall Wace, Llp, UBS Group AG, Gendell Jeffrey L, Legal & General Group Plc, Private Management Group Inc, Morgan Stanley, and Millennium Management Llc .
Prospect Capital Corporation (NasdaqGS:PSEC) institutionel ejerskabsstruktur viser aktuelle positioner i virksomheden efter institutioner og fonde, samt seneste ændringer i positionsstørrelse. Større aktionærer kan omfatte individuelle investorer, investeringsforeninger, hedgefonde eller institutioner. Skema 13D angiver, at investoren besidder (eller besidder) mere end 5 % af virksomheden og har til hensigt (eller har til hensigt at) aktivt at forfølge en ændring i forretningsstrategi. Skema 13G indikerer en passiv investering på over 5%.
The share price as of March 18, 2026 is 2,60 / share. Previously, on March 19, 2025, the share price was 4,26 / share. This represents a decline of 38,97% over that period.

Fondens stemningsscore
Fund Sentiment Score (fka Ownership Accumulation Score) finder de aktier, der bliver mest købt af fonde. Det er resultatet af en sofistikeret, multi-faktor kvantitativ model, der identificerer virksomheder med de højeste niveauer af institutionel akkumulering. Scoringsmodellen bruger en kombination af den samlede stigning i oplyste ejere, ændringerne i porteføljeallokeringer i disse ejere og andre målinger. Tallet går fra 0 til 100, hvor højere tal indikerer et højere niveau af akkumulering for sine jævnaldrende, og 50 er gennemsnittet.
Opdateringsfrekvens: Dagligt
Se Ownership Explorer, som giver en liste over højest rangerende virksomheder.
AI+ Ask Fintel’s AI assistant about Prospect Capital Corporation.
Select a question to share a public post with an AI-crafted answer.
Thinking of good questions…
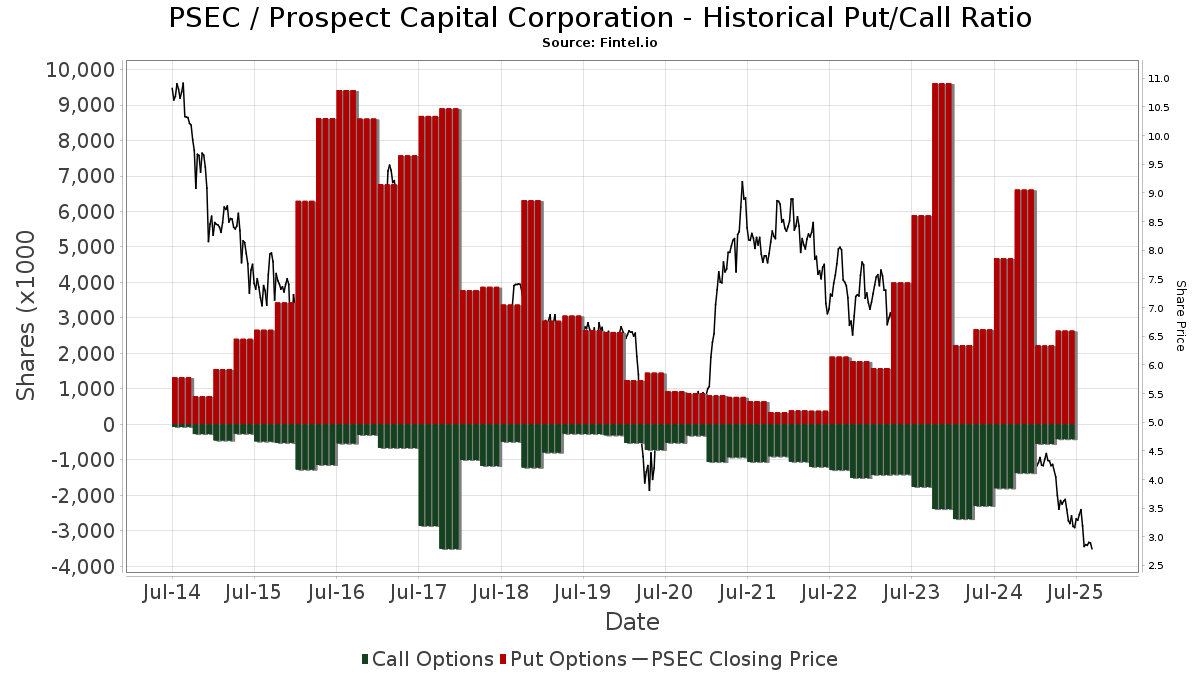
Institutionel Put/Call-forhold
Ud over at indberette standardaktie- og gældsudstedelser skal institutter med mere end 100 mill. aktiver under forvaltning også oplyse deres put- og call-optionsbeholdninger. Da salgsoptioner generelt indikerer negativ stemning, og købsoptioner indikerer positiv stemning, kan vi få en fornemmelse af den overordnede institutionelle stemning ved at plotte forholdet mellem put og kald. Diagrammet til højre viser det historiske put/call-forhold for dette instrument.
Brug af Put/Call Ratio som en indikator for investorernes stemning overvinder en af de vigtigste mangler ved at bruge totalt institutionelt ejerskab, som er, at en betydelig mængde af aktiver under forvaltning investeres passivt for at spore indekser. Passivt forvaltede fonde køber typisk ikke optioner, så indikatoren for put/call-forholdet følger mere nøje følelsen af aktivt forvaltede fonde.
13D/G-arkivering
Vi præsenterer 13D/G ansøgninger separat fra 13F ansøgninger på grund af den forskellige behandling af SEC. 13D/G-ansøgninger kan indgives af grupper af investorer (med én ledende), hvorimod 13F-ansøgninger ikke kan. Dette resulterer i situationer, hvor en investor kan indsende en 13D/G, der rapporterer én værdi for de samlede aktier (der repræsenterer alle de aktier, der ejes af investorgruppen), men derefter indsender en 13F, der rapporterer en anden værdi for de samlede aktier (der udelukkende repræsenterer deres egne) ejendomsret). Det betyder, at aktieejerskab af 13D/G-arkiver og 13F-arkiveringer ofte ikke er direkte sammenlignelige, så vi præsenterer dem separat.
Bemærk: Fra den 16. maj 2021 viser vi ikke længere ejere, der ikke har indsendt en 13D/G inden for det seneste år. Tidligere viste vi den fulde historie af 13D/G-arkiver. Generelt skal enheder, der er forpligtet til at indgive 13D/G-ansøgninger, indgive mindst årligt, før de indsender en afsluttende ansøgning. Dog forlader fonde nogle gange positioner uden at indsende en afsluttende ansøgning (dvs. de afvikler), så visning af den fulde historie resulterede nogle gange i forvirring om det nuværende ejerskab. For at undgå forvirring viser vi nu kun 'aktuelle' ejere - det vil sige - ejere, der har anmeldt inden for det seneste år.
Upgrade to unlock premium data.
| Fil dato | Form | Investor | Forrige Aktier |
Seneste Aktier |
Δ Aktier (Procent) |
Ejendomsret (Procent) |
Δ Ejerskab (Procent) |
|
|---|---|---|---|---|---|---|---|---|
| 2026-03-03 | John & Daria Barry Foundation | 130,310,032 | 26.90 |
13F og NPORT arkivering
Detaljer om 13F-arkivering er gratis. Detaljer om NP-ansøgninger kræver et premium-medlemskab. Grønne rækker angiver nye positioner. Røde rækker angiver lukkede positioner. Klik på linket ikon for at se den fulde transaktionshistorik.
Opgrader
for at låse premium-data op og eksportere til Excel ![]() .
.
| Fil dato | Kilde | Investor | Type | Gennemsnitlig pris (Øst) |
Aktier | Δ Aktier (%) |
Rapporteret Værdi ($1000) |
Δ Værdi (%) |
Port Alloc (%) |
|
|---|---|---|---|---|---|---|---|---|---|---|
| 2026-02-11 | 13F | LeClair Wealth Partners LLC | 239.118 | 491,36 | 619 | 457,66 | ||||
| 2026-01-14 | 13F | Exchange Traded Concepts, Llc | 162.859 | 16,72 | 422 | 9,92 | ||||
| 2026-02-12 | 13F | Concorde Asset Management, LLC | 304.280 | 40,12 | 788 | 31,33 | ||||
| 2026-01-20 | 13F | Arta Finance Wealth Management LLC | 62.717 | 162 | ||||||
| 2026-02-02 | 13F | Millstone Evans Group, LLC | 0 | -100,00 | 0 | |||||
| 2025-10-28 | 13F | Littlejohn Financial Services, Inc. | 0 | -100,00 | 0 | |||||
| 2026-02-11 | 13F | Private Management Group Inc | 3.224.849 | 8.352 | ||||||
| 2026-02-13 | 13F | Kestra Advisory Services, LLC | 0 | -100,00 | 0 | |||||
| 2026-02-17 | 13F | Parvin Asset Management, LLC | 30 | 0 | ||||||
| 2026-02-10 | 13F | Goldman Sachs Group Inc | 33.085 | -79,63 | 86 | -80,94 | ||||
| 2025-11-14 | 13F | Wolverine Trading, Llc | Put | 27.700 | -20,63 | 73 | -33,64 | |||
| 2026-02-13 | 13F | Great West Life Assurance Co /can/ | 409.227 | 3,97 | 1 | 0,00 | ||||
| 2026-02-04 | 13F | Pensionmark Financial Group, Llc | 27.191 | 6 | ||||||
| 2026-02-10 | 13F | Foundations Investment Advisors, LLC | 12.075 | 31 | ||||||
| 2025-11-14 | 13F | Wolverine Trading, Llc | Call | 10.600 | -47,00 | 28 | -57,14 | |||
| 2026-02-18 | 13F | Onyx Bridge Wealth Group LLC | 15.672 | 41 | ||||||
| 2026-02-05 | 13F | Cambridge Investment Research Advisors, Inc. | 358.070 | 27,70 | 1 | |||||
| 2026-02-10 | 13F | Lido Advisors, LLC | 88.783 | 3,55 | 245 | 2,51 | ||||
| 2026-02-17 | 13F | Boothbay Fund Management, Llc | 12.784 | 33 | ||||||
| 2026-01-26 | 13F | AE Wealth Management LLC | 0 | -100,00 | 0 | |||||
| 2026-01-21 | 13F | Newbridge Financial Services Group, Inc. | 7.157 | 19 | ||||||
| 2026-02-13 | 13F | Tcfg Wealth Management, Llc | 275.333 | 1,15 | 713 | -4,68 | ||||
| 2026-02-17 | 13F | Advisory Services Network, LLC | 0 | -100,00 | 0 | |||||
| 2025-11-05 | 13F | Moloney Securities Asset Management, LLC | 105.639 | -12,14 | 291 | -24,08 | ||||
| 2026-03-11 | 13F | Leonteq Securities AG | 0 | -100,00 | 0 | |||||
| 2026-01-13 | 13F | CoreCap Advisors, LLC | 1.009 | 3 | ||||||
| 2026-02-12 | 13F | Quadrant Capital Group Llc | 1.762 | 466,56 | 5 | |||||
| 2026-02-17 | 13F | Balyasny Asset Management Llc | 0 | -100,00 | 0 | -100,00 | ||||
| 2026-02-17 | 13F | Qube Research & Technologies Ltd | 174.452 | -23,27 | 452 | -27,84 | ||||
| 2026-02-17 | 13F | Two Sigma Securities, Llc | 0 | -100,00 | 0 | -100,00 | ||||
| 2026-02-17 | 13F | Citadel Advisors Llc | 52.699 | -94,43 | 136 | -94,77 | ||||
| 2026-02-11 | 13F | XML Financial, LLC | 87.115 | -86,56 | 226 | -87,37 | ||||
| 2026-02-17 | 13F | Citadel Advisors Llc | Put | 253.000 | -55,10 | 655 | -57,71 | |||
| 2026-02-17 | 13F | Two Sigma Advisers, Lp | 8.944.200 | 32,05 | 23.165 | 24,37 | ||||
| 2026-02-17 | 13F | Citadel Advisors Llc | Call | 58.100 | -11,57 | 150 | -16,67 | |||
| 2026-02-02 | 13F | Truist Financial Corp | 153.940 | 0,00 | 399 | -5,91 | ||||
| 2026-02-12 | 13F | Commonwealth Equity Services, Llc | 663.035 | 8,60 | 1.717 | 171.600,00 | ||||
| 2026-02-17 | 13F | Susquehanna International Group, Llp | Call | 0 | -100,00 | 0 | ||||
| 2026-01-14 | 13F | ORG Partners LLC | 5 | 0,00 | 0 | |||||
| 2026-02-06 | 13F | Creative Financial Designs Inc /adv | 10.400 | 5,47 | 27 | -3,70 | ||||
| 2026-02-13 | 13F | Citigroup Inc | 10 | 0,00 | 0 | |||||
| 2026-01-14 | 13F | Wealthcare Advisory Partners LLC | 11.999 | 5,47 | 31 | 0,00 | ||||
| 2026-02-11 | 13F | LPL Financial LLC | 821.147 | -6,97 | 2.127 | -12,40 | ||||
| 2026-01-30 | 13F | BancorpSouth Bank | 41.184 | 5,13 | 107 | -0,93 | ||||
| 2025-10-10 | 13F | Ridgeline Wealth, LLC | 0 | -100,00 | 0 | |||||
| 2026-02-10 | 13F | IFG Advisory, LLC | 0 | -100,00 | 0 | |||||
| 2026-02-17 | 13F | Strive Financial Group ,LLC | 757 | 2 | ||||||
| 2026-01-29 | 13F | UBS Group AG | 4.989.986 | 44,50 | 12.924 | 36,10 | ||||
| 2026-02-04 | 13F | Hallmark Capital Management Inc | 0 | -100,00 | 0 | |||||
| 2025-10-06 | 13F | NWF Advisory Services Inc. | 10.100 | 0,00 | 54 | -1,82 | ||||
| 2026-02-03 | 13F | Denali Advisors Llc | 85.301 | -18,71 | 221 | -23,61 | ||||
| 2026-01-14 | 13F | Generali Investments CEE, investicni spolecnost, a.s. | 101.234 | 0,00 | 262 | -5,76 | ||||
| 2026-01-23 | 13F | KG&L Capital Management,LLC | 10.043 | -2,27 | 26 | -7,14 | ||||
| 2026-01-26 | 13F | Cwm, Llc | 18.753 | 2,78 | 0 | |||||
| 2026-02-17 | 13F | Bank Of America Corp /de/ | 254.670 | -59,50 | 660 | -61,89 | ||||
| 2026-02-05 | 13F | Stephens Inc /ar/ | 16.421 | 0,00 | 43 | -6,67 | ||||
| 2026-02-10 | 13F | Bnp Paribas Arbitrage, Sa | 456.999 | -9,39 | 1.184 | -14,65 | ||||
| 2026-02-10 | 13F | Catalyst Capital Advisors LLC | 200.742 | 0,00 | 520 | -5,98 | ||||
| 2026-02-17 | 13F | Aquatic Capital Management LLC | 0 | -100,00 | 0 | -100,00 | ||||
| 2025-10-21 | 13F | American National Bank | 0 | -100,00 | 0 | |||||
| 2026-02-17 | 13F | Massar Capital Management, LP | 23.184 | 60 | ||||||
| 2026-02-13 | 13F/A | Virtus ETF Advisers LLC | 0 | -100,00 | 0 | |||||
| 2026-01-21 | 13F | Sound Income Strategies, LLC | 400 | 0,00 | 1 | 0,00 | ||||
| 2026-02-12 | 13F | BlackRock, Inc. | 2.387.587 | 0,74 | 6.184 | -5,13 | ||||
| 2026-02-17 | 13F | Dark Forest Capital Management Lp | 0 | -100,00 | 0 | |||||
| 2026-01-20 | 13F | Stratos Wealth Partners, LTD. | 0 | -100,00 | 0 | |||||
| 2026-02-06 | 13F | Larson Financial Group LLC | 0 | 0 | ||||||
| 2026-01-07 | 13F | Hilltop National Bank | 380 | 0,00 | 1 | -100,00 | ||||
| 2026-01-07 | 13F | Next Level Private LLC | 20.035 | -39,73 | 52 | -44,57 | ||||
| 2026-02-13 | 13F | SRS Capital Advisors, Inc. | 0 | -100,00 | 0 | |||||
| 2026-01-30 | 13F | Wealthfront Advisers Llc | 49.092 | 24,75 | 127 | 17,59 | ||||
| 2026-02-04 | 13F | Ameritas Advisory Services, LLC | 0 | -100,00 | 0 | |||||
| 2026-02-17 | 13F | Point72 Asset Management, L.P. | 1.065.592 | 2.760 | ||||||
| 2026-02-17 | 13F | Brevan Howard Capital Management LP | 127.007 | -38,93 | 329 | -42,56 | ||||
| 2026-01-07 | 13F | Aventura Private Wealth, LLC | 9.162 | 0,00 | 24 | -8,00 | ||||
| 2025-09-26 | NP | LBO - WHITEWOLF Publicly Listed Private Equity ETF | 95.763 | 8,33 | 297 | -6,03 | ||||
| 2026-01-29 | 13F | Nbc Securities, Inc. | 200 | 0,00 | 1 | |||||
| 2026-01-22 | 13F | Bfsg, Llc | 10.510 | 27 | ||||||
| 2026-02-13 | 13F | Brian Low Financial Group, Llc | 10.000 | 26 | ||||||
| 2026-01-09 | 13F | Teamwork Financial Advisors, LLC | 0 | -100,00 | 0 | |||||
| 2026-02-11 | 13F | Commonwealth Retirement Investments LLC | 5.790 | 15 | ||||||
| 2026-02-17 | 13F | Jump Financial, LLC | 95.704 | 248 | ||||||
| 2025-11-14 | 13F | Hrt Financial Lp | 0 | -100,00 | 0 | |||||
| 2026-02-17 | 13F | Royal Bank Of Canada | 56.828 | -3,09 | 147 | -8,70 | ||||
| 2026-01-09 | 13F | Tactive Advisors, LLC | 578.837 | -1,19 | 1.499 | -6,95 | ||||
| 2026-02-20 | 13F | Sunbelt Securities, Inc. | 29.344 | 0,00 | 76 | -5,00 | ||||
| 2026-02-12 | 13F | CIBC Private Wealth Group, LLC | 1 | 0,00 | 0 | |||||
| 2026-01-27 | 13F | Evergreen Capital Management Llc | 11.734 | 30 | ||||||
| 2026-02-06 | 13F | Gsa Capital Partners Llp | 174.627 | 0 | ||||||
| 2026-02-23 | 13F | Virtu Financial LLC | 0 | -100,00 | 0 | |||||
| 2026-02-09 | 13F | Cypress Capital Management LLC (WY) | 2.145 | 0,00 | 6 | 0,00 | ||||
| 2025-11-14 | 13F | Point72 Europe (London) LLP | 1.924 | 5 | ||||||
| 2026-02-17 | 13F | Rpo Llc | 25.568 | 66 | ||||||
| 2026-02-17 | 13F | Cape Investment Advisory, Inc. | 559 | 0,00 | 1 | 0,00 | ||||
| 2026-02-10 | 13F | Carnegie Lake Advisors LLC | 0 | -100,00 | 0 | |||||
| 2026-01-09 | 13F | 180 Wealth Advisors, Llc | 346.097 | 64,00 | 896 | 54,48 | ||||
| 2026-02-06 | 13F | Csenge Advisory Group | 42.460 | -3,33 | 110 | -9,17 | ||||
| 2026-01-26 | 13F | Harbor Asset Planning, Inc. | 0 | -100,00 | 0 | |||||
| 2026-02-09 | 13F | Annis Gardner Whiting Capital Advisors, LLC | 5 | 0,00 | 0 | |||||
| 2026-01-15 | 13F | Founders Capital Management | 4.000 | 0,00 | 10 | -9,09 | ||||
| 2026-02-10 | 13F | Cravens & Co Advisors, LLC | 20.000 | 0,00 | 56 | 1,82 | ||||
| 2025-11-04 | 13F | OneAscent Investment Solutions LLC | 0 | -100,00 | 0 | |||||
| 2026-02-05 | 13F | Allworth Financial LP | 26.222 | -10,08 | 68 | -16,25 | ||||
| 2026-02-05 | 13F | IMG Wealth Management, Inc. | 381 | 1 | ||||||
| 2026-02-13 | 13F | Mariner, LLC | 12.520 | -65,21 | 32 | -67,35 | ||||
| 2026-02-05 | 13F | DnB Asset Management AS | 401.659 | 0,00 | 1.044 | -5,43 | ||||
| 2026-02-06 | 13F | GPS Wealth Strategies Group, LLC | 0 | -100,00 | 0 | |||||
| 2026-02-09 | 13F | Harbour Investments, Inc. | 38.975 | -16,27 | 101 | -21,87 | ||||
| 2026-02-12 | 13F | Steward Partners Investment Advisory, Llc | 4.358 | -37,87 | 11 | -42,11 | ||||
| 2026-02-11 | 13F | Flagship Wealth Advisors, Llc | 0 | -100,00 | 0 | |||||
| 2026-02-12 | 13F | Jane Street Group, Llc | 489.749 | -53,14 | 1.268 | -55,86 | ||||
| 2026-02-13 | 13F | Natixis | 934 | 6,99 | 2 | 0,00 | ||||
| 2026-02-12 | 13F | Jane Street Group, Llc | Put | 74.400 | -89,69 | 193 | -90,33 | |||
| 2026-02-17 | 13F | Tower Research Capital LLC (TRC) | 115.163 | 107,14 | 298 | 96,05 | ||||
| 2026-02-12 | 13F | Jane Street Group, Llc | Call | 136.500 | 420,99 | 354 | 390,28 | |||
| 2026-02-06 | 13F | Pnc Financial Services Group, Inc. | 15.928 | 0,28 | 41 | -4,65 | ||||
| 2026-02-17 | 13F | Blair William & Co/il | 45.700 | 0,00 | 118 | -5,60 | ||||
| 2026-01-21 | 13F | Flagship Harbor Advisors, Llc | 8 | 0 | ||||||
| 2026-02-12 | 13F | Great Valley Advisor Group, Inc. | 22.802 | 5,46 | 59 | 0,00 | ||||
| 2026-01-12 | 13F | Traynor Capital Management, Inc. | 10.655 | -2,89 | 28 | -10,00 | ||||
| 2026-01-30 | 13F | American Capital Advisory, LLC | 204 | 0,00 | 1 | |||||
| 2026-01-20 | 13F | AdvisorNet Financial, Inc | 4.207 | 5,12 | 11 | -9,09 | ||||
| 2026-02-11 | 13F | Simplex Trading, Llc | 0 | -100,00 | 0 | |||||
| 2026-02-13 | 13F | Level Four Advisory Services, Llc | 18.174 | -3,08 | 47 | -7,84 | ||||
| 2025-10-30 | 13F | Traub Capital Management LLC | 0 | -100,00 | 0 | |||||
| 2026-02-10 | 13F | Envestnet Asset Management Inc | 13.352 | -6,21 | 35 | -12,82 | ||||
| 2026-01-28 | 13F | Barrett & Company, Inc. | 32.277 | -27,91 | 84 | -32,52 | ||||
| 2026-01-15 | 13F | Cherry Creek Investment Advisors, Inc. | 31.316 | 0,00 | 81 | -5,81 | ||||
| 2026-02-13 | 13F | Stifel Financial Corp | 189.424 | -7,81 | 491 | -13,27 | ||||
| 2026-02-17 | 13F | Tudor Investment Corp Et Al | 2.248.632 | -13,66 | 5.824 | -18,68 | ||||
| 2026-01-26 | 13F | Private Trust Co Na | 11.639 | 0,00 | 30 | -6,25 | ||||
| 2026-02-12 | 13F | Insigneo Advisory Services, Llc | 0 | -100,00 | 0 | |||||
| 2026-02-06 | 13F | IFP Advisors, Inc | 22.388 | 5,28 | 58 | -1,72 | ||||
| 2026-02-04 | 13F | Ground Swell Capital, LLC | 10.763 | 28 | ||||||
| 2026-02-11 | 13F | Cerity Partners LLC | 0 | -100,00 | 0 | |||||
| 2026-02-13 | 13F | Verition Fund Management LLC | 177.706 | -12,14 | 460 | -17,27 | ||||
| 2026-01-28 | 13F | Geneos Wealth Management Inc. | 1.500 | 0,00 | 4 | -25,00 | ||||
| 2026-01-29 | 13F | Comerica Bank | 4.051 | -92,22 | 10 | -93,01 | ||||
| 2026-01-13 | 13F | Kathmere Capital Management, LLC | 69.462 | 0,00 | 180 | -6,28 | ||||
| 2026-02-17 | 13F | Raymond James Financial Inc | 472.586 | -7,50 | 1.224 | -12,89 | ||||
| 2026-02-05 | 13F | Sculati Wealth Management, LLC | 19.300 | -27,54 | 50 | -32,88 | ||||
| 2026-02-06 | 13F | Global Retirement Partners, LLC | 25.500 | 0,00 | 66 | -5,71 | ||||
| 2026-02-09 | 13F | Shufro Rose & Co Llc | 0 | -100,00 | 0 | |||||
| 2026-02-05 | 13F | Bessemer Group Inc | 40.000 | 0,00 | 0 | |||||
| 2026-02-17 | 13F | Creative Planning | 196.067 | 3,56 | 508 | -2,50 | ||||
| 2026-01-30 | 13F | Activest Wealth Management | 2.300 | -30,30 | 6 | -44,44 | ||||
| 2026-01-20 | 13F | Signaturefd, Llc | 8.536 | -28,78 | 22 | -31,25 | ||||
| 2026-02-04 | 13F | Atlantic Union Bankshares Corp | 3.800 | 0,00 | 10 | -10,00 | ||||
| 2025-11-14 | 13F | Wolverine Trading, Llc | 0 | -100,00 | 0 | -100,00 | ||||
| 2025-11-07 | 13F | Glenview Trust Co | 0 | -100,00 | 0 | |||||
| 2026-02-10 | 13F | Calton & Associates, Inc. | 17.789 | -8,15 | 46 | -13,21 | ||||
| 2026-02-17 | 13F | Advisor Group Holdings, Inc. | 206.604 | 19,09 | 535 | 5,94 | ||||
| 2026-01-14 | 13F | Family Wealth Partners, Llc | 150.479 | 9,63 | 390 | 3,18 | ||||
| 2026-02-13 | 13F | Van Eck Associates Corp | 9.644.408 | -5,96 | 25 | -14,29 | ||||
| 2026-02-13 | 13F | Inspire Advisors, LLC | 13.003 | -39,78 | 34 | -44,07 | ||||
| 2026-01-28 | 13F | Family Wealth Group, LLC | 14.913 | 0,67 | 39 | -5,00 | ||||
| 2026-02-11 | 13F | Jpmorgan Chase & Co | 2.653 | -94,92 | 7 | -95,80 | ||||
| 2026-01-08 | 13F | Wealth Enhancement Advisory Services, Llc | 27.489 | -19,73 | 74 | -21,28 | ||||
| 2026-01-16 | 13F | Crewe Advisors LLC | 2.893 | 14,48 | 7 | 16,67 | ||||
| 2025-10-15 | 13F | CWM Advisors, LLC | 0 | -100,00 | 0 | -100,00 | ||||
| 2026-02-12 | 13F | Philadelphia Trust Co | 43.200 | -5,47 | 0 | |||||
| 2026-01-07 | 13F | Significant Wealth Partners LLC | 13.780 | -23,22 | 36 | -28,57 | ||||
| 2026-02-17 | 13F | Susquehanna International Group, Llp | 1.645.159 | -55,97 | 4.261 | -58,54 | ||||
| 2026-02-17 | 13F | Susquehanna International Group, Llp | Put | 1.117.100 | -75,97 | 2.893 | -77,37 | |||
| 2026-02-12 | 13F | Moneta Group Investment Advisors Llc | 12.953 | 0,00 | 34 | -5,71 | ||||
| 2026-02-10 | 13F | Quantbot Technologies LP | 263.010 | 388,59 | 681 | 360,14 | ||||
| 2026-02-11 | 13F | Janney Montgomery Scott LLC | 0 | -100,00 | 0 | |||||
| 2026-02-17 | 13F | Garden State Investment Advisory Services LLC | 67.373 | -0,09 | 175 | -5,95 | ||||
| 2026-01-21 | 13F | Sowell Financial Services LLC | 43.337 | 141,50 | 112 | 128,57 | ||||
| 2026-02-13 | 13F | Marshall Wace, Llp | 6.213.516 | 16.093 | ||||||
| 2026-02-12 | 13F | WealthPLAN Partners, LLC | 15.430 | 40 | ||||||
| 2026-01-23 | 13F | State of Alaska, Department of Revenue | 18.642 | 0,00 | 0 | |||||
| 2026-02-09 | 13F | Hantz Financial Services, Inc. | 3 | 0,00 | 0 | |||||
| 2026-02-13 | 13F | Aigen Investment Management, Lp | 0 | -100,00 | 0 | |||||
| 2026-02-12 | 13F | Kovack Advisors, Inc. | 403.090 | -16,13 | 995 | -24,68 | ||||
| 2026-02-11 | 13F | BI Asset Management Fondsmaeglerselskab A/S | 520.592 | 0,00 | 1 | 0,00 | ||||
| 2026-01-22 | 13F | Flagship Capital Management Inc. | 12.800 | 33 | ||||||
| 2026-02-17 | 13F | Ameriflex Group, Inc. | 9.830 | -48,53 | 25 | -51,92 | ||||
| 2026-02-03 | 13F | Garner Asset Management Corp | 40.515 | -10,82 | 105 | -15,45 | ||||
| 2026-01-29 | 13F | IMC-Chicago, LLC | 0 | -100,00 | 0 | -100,00 | ||||
| 2026-02-12 | 13F | DRW Securities, LLC | 219.119 | -14,89 | 568 | -20,92 | ||||
| 2026-02-26 | 13F/A | Alpine Global Management, LLC | 71.712 | -10,69 | 186 | -46,53 | ||||
| 2026-01-23 | 13F | Farther Finance Advisors, LLC | 12.936 | 789,07 | 34 | 725,00 | ||||
| 2026-01-30 | 13F | Sigma Planning Corp | 37.925 | -2,84 | 98 | -8,41 | ||||
| 2026-02-18 | 13F | Vident Advisory, LLC | 0 | -100,00 | 0 | |||||
| 2026-02-02 | 13F | Fifth Third Bancorp | 4.200 | 11 | ||||||
| 2026-02-17 | 13F | Schonfeld Strategic Advisors LLC | 10.825 | 28 | ||||||
| 2026-02-18 | 13F | GWM Advisors LLC | 13.904 | 115.766,67 | 36 | |||||
| 2026-01-09 | 13F | Silverlake Wealth Management Llc | 15.153 | 2,22 | 39 | -2,50 | ||||
| 2025-10-24 | 13F | Comprehensive Money Management Services LLC | 0 | -100,00 | 0 | |||||
| 2026-01-29 | 13F | Kestra Private Wealth Services, Llc | 201.682 | -2,52 | 522 | -8,10 | ||||
| 2026-02-17 | 13F | Mercer Global Advisors Inc /adv | 27.033 | -16,21 | 70 | -20,45 | ||||
| 2026-02-04 | 13F | HighPoint Advisor Group LLC | 28.406 | 74 | ||||||
| 2025-11-03 | 13F | Cypress Capital Group | 0 | -100,00 | 0 | -100,00 | ||||
| 2026-02-06 | 13F | VSM Wealth Advisory, LLC | 0 | -100,00 | 0 | |||||
| 2026-01-28 | 13F | WMG Financial Advisors, LLC | 27.950 | 0,00 | 72 | -5,26 | ||||
| 2026-02-03 | 13F | International Assets Investment Management, Llc | 124.100 | -12,94 | 321 | -28,51 | ||||
| 2026-02-17 | 13F | Ameriprise Financial Inc | 42.355 | -21,01 | 110 | -36,63 | ||||
| 2026-02-13 | 13F | Wells Fargo & Company/mn | 42.792 | -59,83 | 111 | -62,33 | ||||
| 2026-01-29 | 13F | IMC-Chicago, LLC | Put | 92.000 | -85,47 | 238 | -86,33 | |||
| 2026-02-04 | 13F | Independent Advisor Alliance | 12.550 | 33 | ||||||
| 2026-02-13 | 13F | Arkadios Wealth Advisors | 36.134 | -5,74 | 94 | -11,43 | ||||
| 2026-02-17 | 13F | Regal Investment Advisors LLC | 18.022 | 0,87 | 47 | -6,12 | ||||
| 2025-11-19 | 13F | Captrust Financial Advisors | 0 | -100,00 | 0 | -100,00 | ||||
| 2026-02-05 | 13F | Edge Financial Advisors LLC | 0 | -100,00 | 0 | |||||
| 2025-10-14 | 13F | Trust Co Of Vermont | 0 | -100,00 | 0 | |||||
| 2026-02-13 | 13F | Barclays Plc | 2 | -99,99 | 0 | -100,00 | ||||
| 2026-02-11 | 13F | J.w. Cole Advisors, Inc. | 17.702 | -17,01 | 46 | -22,41 | ||||
| 2026-02-13 | 13F | A4 Wealth Advisors LLC | 0 | -100,00 | 0 | |||||
| 2026-02-11 | 13F | Group One Trading, L.p. | Call | 53.800 | -6,76 | 139 | -12,03 | |||
| 2026-02-11 | 13F | Group One Trading, L.p. | Put | 155.300 | -67,46 | 402 | -69,36 | |||
| 2025-11-12 | 13F | Fisher Asset Management, LLC | 0 | -100,00 | 0 | |||||
| 2026-02-03 | 13F | Legacy Wealth Managment, LLC/ID | 3.639 | 0,00 | 9 | -10,00 | ||||
| 2026-02-09 | 13F | Kingsview Wealth Management, LLC | 18.897 | 5,47 | 49 | -2,04 | ||||
| 2025-11-07 | 13F/A | Merit Financial Group, LLC | 0 | -100,00 | 0 | -100,00 | ||||
| 2026-02-17 | 13F | Optiver Holding B.V. | 0 | -100,00 | 0 | -100,00 | ||||
| 2026-02-11 | 13F | CNB Bank | 7.500 | 0,00 | 19 | -5,00 | ||||
| 2026-01-22 | 13F | HHM Wealth Advisors, LLC | 5.372 | 0,00 | 14 | -7,14 | ||||
| 2026-02-13 | 13F | MAI Capital Management | 13.255 | 0,00 | 34 | -5,56 | ||||
| 2026-02-17 | 13F | Claro Advisors LLC | 192.405 | 13,27 | 498 | 6,64 | ||||
| 2026-02-13 | 13F/A | Alberta Investment Management Corp | 0 | -100,00 | 0 | |||||
| 2026-01-21 | 13F | Capital Advisors, Ltd. LLC | 12.352 | 0,00 | 0 | |||||
| 2026-02-12 | 13F | Principal Securities, Inc. | 0 | -100,00 | 0 | |||||
| 2026-02-13 | 13F | Gendell Jeffrey L | 3.728.319 | 17,75 | 9.656 | 10,90 | ||||
| 2026-02-17 | 13F | Virtus Investment Advisers, Inc. | 460.789 | -29,93 | 1.193 | -34,02 | ||||
| 2025-10-28 | 13F | Elwood & Goetz Wealth Advisory Group, LLC | 0 | -100,00 | 0 | |||||
| 2026-02-02 | 13F | Oppenheimer & Co Inc | 15.117 | -4,79 | 39 | -9,30 | ||||
| 2025-11-14 | 13F | Millennium Management Llc | Put | 0 | -100,00 | 0 | -100,00 | |||
| 2026-02-17 | 13F | Guggenheim Capital Llc | 156.832 | 12,05 | 406 | 5,73 | ||||
| 2026-02-06 | 13F | Gables Capital Management Inc. | 1.200 | 0,00 | 3 | 0,00 | ||||
| 2026-01-16 | 13F | Ronald Blue Trust, Inc. | 431 | 0,00 | 1 | 0,00 | ||||
| 2026-02-06 | 13F | EverSource Wealth Advisors, LLC | 148 | -91,82 | 0 | -100,00 | ||||
| 2026-02-11 | 13F | Parallel Advisors, LLC | 3.586 | -18,92 | 9 | -25,00 | ||||
| 2026-02-13 | 13F | Headlands Technologies LLC | 74.777 | 307,13 | 194 | 286,00 | ||||
| 2026-02-05 | 13F | Berkeley Capital Partners, LLC | 0 | -100,00 | 0 | |||||
| 2026-02-11 | 13F | Buckingham Strategic Partners | 155.322 | -40,61 | 402 | -46,54 | ||||
| 2026-02-13 | 13F | Sofos Investments, Inc. | 1.525 | 0,00 | 4 | -25,00 | ||||
| 2026-02-04 | 13F | Catalyst Financial Partners Llc | 10.000 | 26 | ||||||
| 2026-02-13 | 13F | Heritage Wealth Advisors | 100 | 0,00 | 0 | |||||
| 2026-02-13 | 13F | Caitong International Asset Management Co., Ltd | 1.876 | 25,65 | 5 | 0,00 | ||||
| 2026-01-16 | 13F | West Branch Capital LLC | 558 | 3,53 | 1 | 0,00 | ||||
| 2026-01-20 | 13F | Ethos Financial Group, LLC | 40.459 | -5,55 | 105 | -11,11 | ||||
| 2025-10-16 | 13F | Kingstone Capital Partners Texas, LLC | 0 | -100,00 | 0 | -100,00 | ||||
| 2026-02-13 | 13F | Caxton Associates Llp | 710.253 | -39,64 | 1.840 | -43,15 | ||||
| 2026-02-12 | 13F | Triumph Capital Management | 751 | -84,28 | 2 | -92,31 | ||||
| 2026-02-10 | 13F/A | Northwestern Mutual Wealth Management Co | 12.687 | 381,48 | 33 | 357,14 | ||||
| 2026-02-02 | 13F | Danske Bank A/s | 2 | 0 | ||||||
| 2026-01-23 | 13F | Avion Wealth | 4.863 | 5,12 | 0 | |||||
| 2026-02-12 | 13F | Smh Capital Advisors Inc | 426.473 | -2,82 | 1.105 | -5,40 | ||||
| 2025-11-14 | 13F | Navis Wealth Advisors, LLC | 0 | -100,00 | 0 | -100,00 | ||||
| 2026-02-11 | 13F | Group One Trading, L.p. | 84.342 | -77,36 | 218 | -78,71 | ||||
| 2025-10-22 | 13F | D.a. Davidson & Co. | 0 | -100,00 | 0 | |||||
| 2026-01-26 | 13F | Asset Dedication, LLC | 0 | -100,00 | 0 | |||||
| 2026-01-30 | 13F | Samalin Investment Counsel, LLC | 19.607 | -26,86 | 51 | -31,51 | ||||
| 2026-02-13 | 13F | Mml Investors Services, Llc | 13.505 | 10,35 | 35 | 3,03 | ||||
| 2026-02-09 | 13F | Huntington National Bank | 0 | -100,00 | 0 | |||||
| 2026-02-09 | 13F | Legal & General Group Plc | 3.321.477 | 21,76 | 8.652 | 15,13 | ||||
| 2026-02-14 | 13F | Rockefeller Capital Management L.P. | 0 | -100,00 | 0 | |||||
| 2026-02-06 | 13F | Lsv Asset Management | 535.835 | 0,00 | 1 | 0,00 | ||||
| 2026-02-13 | 13F | Strategies Wealth Advisors, LLC | 36.561 | 5,47 | 95 | -1,05 | ||||
| 2026-01-13 | 13F | West Financial Advisors, LLC | 302 | 5,23 | 1 | |||||
| 2026-01-30 | 13F | Us Bancorp \de\ | 60.000 | -40,89 | 155 | -44,44 | ||||
| 2026-02-13 | 13F | Squarepoint Ops LLC | 284.895 | 26,71 | 738 | 19,26 | ||||
| 2026-02-17 | 13F | Palogic Value Management, L.P. | 0 | -100,00 | 0 | |||||
| 2026-02-17 | 13F | Jones Financial Companies Lllp | 3.337 | -56,05 | 9 | -57,89 | ||||
| 2026-02-06 | 13F | ProShare Advisors LLC | 77.247 | -5,59 | 200 | -11,11 | ||||
| 2026-01-28 | 13F | Universal- Beteiligungs- und Servicegesellschaft mbH | 105.900 | 0,00 | 274 | -5,84 | ||||
| 2026-02-11 | 13F | Simplex Trading, Llc | Call | 149.400 | 6,87 | 387 | ||||
| 2025-11-14 | 13F | Centiva Capital, LP | 0 | -100,00 | 0 | |||||
| 2026-02-11 | 13F | Simplex Trading, Llc | Put | 71.800 | -86,20 | 186 | 18.400,00 | |||
| 2026-02-13 | 13F | Ausdal Financial Partners, Inc. | 20.878 | -3,87 | 54 | -8,47 | ||||
| 2026-01-21 | 13F | Naviter Wealth, LLC | 384.219 | -22,58 | 1.014 | -26,96 | ||||
| 2026-01-27 | 13F/A | GraniteShares Advisors LLC | 1.059.980 | 2.745 | ||||||
| 2026-02-05 | 13F | Navalign, LLC | 10.428 | 3,54 | 27 | 0,00 | ||||
| 2025-11-14 | 13F | Point72 Asia (Singapore) Pte. Ltd. | 5 | 0,00 | 0 | |||||
| 2025-10-10 | 13F | Corsicana & Co. | 0 | -100,00 | 0 | |||||
| 2025-11-14 | 13F | Shaolin Capital Management LLC | 0 | -100,00 | 0 | -100,00 | ||||
| 2026-02-17 | 13F | Northern Trust Corp | 421.590 | -10,98 | 1.092 | -16,21 | ||||
| 2026-02-13 | 13F | Morgan Stanley | 3.208.846 | 9,51 | 8.311 | 3,13 | ||||
| 2025-11-14 | 13F | Shaolin Capital Management LLC | Put | 0 | -100,00 | 0 | -100,00 | |||
| 2026-02-11 | 13F | Sunrise Financial Services, LLC | 1.000 | 3 | ||||||
| 2026-02-17 | 13F | Two Sigma Investments, Lp | 6.532.768 | 59,46 | 16.920 | 50,18 | ||||
| 2026-02-17 | 13F | Engineers Gate Manager LP | 135.240 | -8,56 | 350 | -13,79 | ||||
| 2025-11-07 | 13F | HighTower Advisors, LLC | 0 | -100,00 | 0 | |||||
| 2026-01-21 | 13F | Mayport, Llc | 20.570 | 0,00 | 53 | -5,36 | ||||
| 2026-02-17 | 13F | XTX Topco Ltd | 221.995 | 156,85 | 575 | 142,19 | ||||
| 2026-01-14 | 13F | Spire Wealth Management | 102.050 | -44,09 | 264 | -47,31 | ||||
| 2026-02-09 | 13F | Prospera Financial Services Inc | 54.121 | -10,03 | 140 | -15,15 | ||||
| 2026-02-17 | 13F | Equitable Holdings, Inc. | 0 | -100,00 | 0 | |||||
| 2026-02-17 | 13F | Summit Global Investments | 75.000 | 0,00 | 0 | |||||
| 2026-01-26 | 13F | PFG Investments, LLC | 15.599 | -0,19 | 40 | -4,76 | ||||
| 2025-09-29 | NP | VPC - Virtus Private Credit Strategy ETF | 424.478 | 23,36 | 1.316 | 7,08 | ||||
| 2026-02-09 | 13F | GatePass Capital, LLC | 306.150 | 49,49 | 793 | 40,67 | ||||
| 2026-02-13 | 13F | Beacon Financial Advisory LLC | 0 | -100,00 | 0 | |||||
| 2026-02-17 | 13F | Cresset Asset Management, LLC | 64.728 | 171 | ||||||
| 2026-02-17 | 13F | Cetera Investment Advisers | 255.522 | -15,52 | 662 | -20,46 | ||||
| 2026-01-27 | 13F | TD Waterhouse Canada Inc. | 0 | -100,00 | 0 | |||||
| 2026-02-03 | 13F | Tweedy, Browne Co LLC | 162.953 | 16,71 | 422 | 10,18 | ||||
| 2026-02-04 | 13F | LRI Investments, LLC | 638 | 0,00 | 2 | 0,00 | ||||
| 2026-02-17 | 13F | Millennium Management Llc | 3.058.430 | -50,92 | 7.921 | -53,78 | ||||
| 2026-01-22 | 13F | Financial Consulate, Inc | 3.121 | -19,52 | 8 | -20,00 | ||||
| 2026-02-09 | 13F | Smithfield Trust Co | 47 | 0,00 | 0 | |||||
| 2026-02-17 | 13F | Modern Wealth Management, LLC | 16.413 | -21,24 | 43 | -26,32 | ||||
| 2025-11-14 | 13F | Oxford Asset Management Llp | 0 | -100,00 | 0 | -100,00 | ||||
| 2026-02-17 | 13F | Private Advisor Group, LLC | 1.705.376 | 10,28 | 4.417 | 3,86 | ||||
| 2025-11-14 | 13F | Cubist Systematic Strategies, LLC | 635.676 | -44,70 | 1.748 | -52,18 | ||||
| 2026-02-17 | 13F | Westwood Holdings Group Inc | 93.246 | 0,00 | 242 | -5,86 | ||||
| 2026-02-18 | 13F | Garton & Associates Financial Advisors LLC | 1.649 | 4 |
Other Listings
| GB:0R25 | 2,61 $ |