Grundlæggende statistik
| Institutionelle ejere | 124 total, 121 long only, 1 short only, 2 long/short - change of -3,12% MRQ |
| Gennemsnitlig porteføljeallokering | 0.1094 % - change of -2,96% MRQ |
| Institutionelle aktier (lange) | 13.640.711 (ex 13D/G) - change of -1,28MM shares -8,56% MRQ |
| Institutionel værdi (lang) | $ 77.705 USD ($1000) |
Institutionelt ejerskab og aktionærer
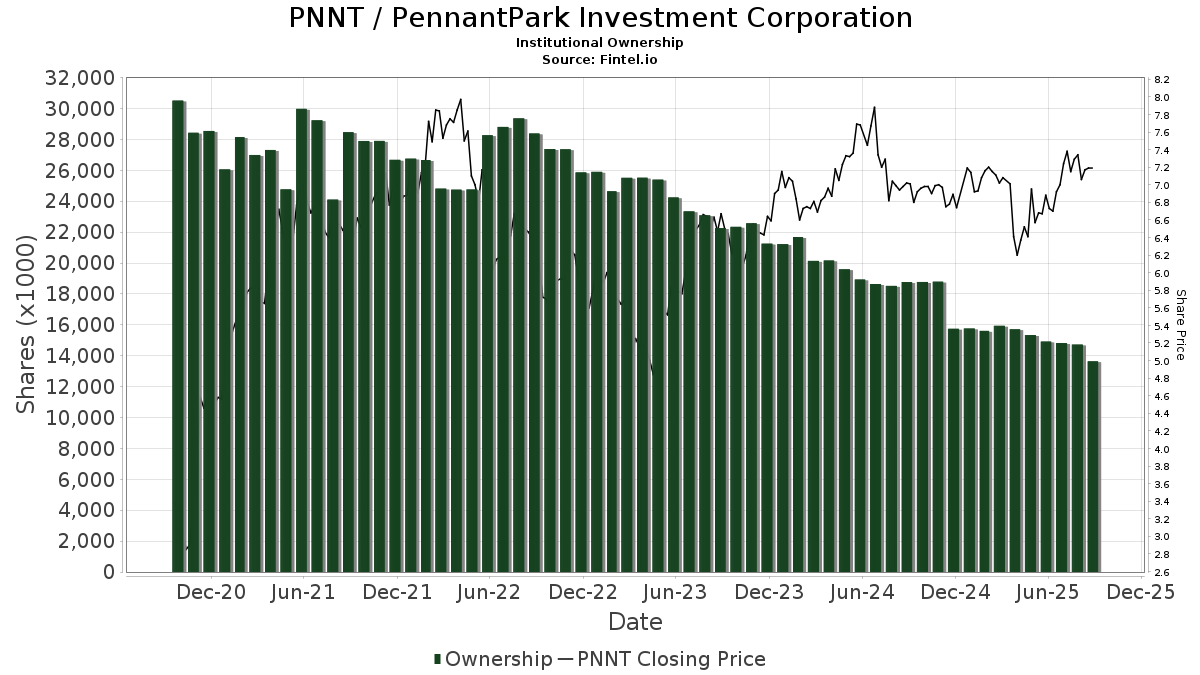
PennantPark Investment Corporation (US:PNNT) har 124 institutionelle ejere og aktionærer, der har indsendt 13D/G- eller 13F-formularer til Securities Exchange Commission (SEC). Disse institutioner har i alt 13,640,711 aktier. Største aktionærer omfatter KBWD - Invesco KBW High Dividend Yield Financial ETF, Invesco Ltd., Lsv Asset Management, Two Sigma Advisers, Lp, Two Sigma Investments, Lp, Truvestments Capital Llc, Advisors Asset Management, Inc., BlackRock, Inc., Morgan Stanley, and Hennion & Walsh Asset Management, Inc. .
PennantPark Investment Corporation (NYSE:PNNT) institutionel ejerskabsstruktur viser aktuelle positioner i virksomheden efter institutioner og fonde, samt seneste ændringer i positionsstørrelse. Større aktionærer kan omfatte individuelle investorer, investeringsforeninger, hedgefonde eller institutioner. Skema 13D angiver, at investoren besidder (eller besidder) mere end 5 % af virksomheden og har til hensigt (eller har til hensigt at) aktivt at forfølge en ændring i forretningsstrategi. Skema 13G indikerer en passiv investering på over 5%.
The share price as of September 16, 2025 is 6,86 / share. Previously, on September 17, 2024, the share price was 6,96 / share. This represents a decline of 1,44% over that period.
Fondens stemningsscore
Fund Sentiment Score (fka Ownership Accumulation Score) finder de aktier, der bliver mest købt af fonde. Det er resultatet af en sofistikeret, multi-faktor kvantitativ model, der identificerer virksomheder med de højeste niveauer af institutionel akkumulering. Scoringsmodellen bruger en kombination af den samlede stigning i oplyste ejere, ændringerne i porteføljeallokeringer i disse ejere og andre målinger. Tallet går fra 0 til 100, hvor højere tal indikerer et højere niveau af akkumulering for sine jævnaldrende, og 50 er gennemsnittet.
Opdateringsfrekvens: Dagligt
Se Ownership Explorer, som giver en liste over højest rangerende virksomheder.
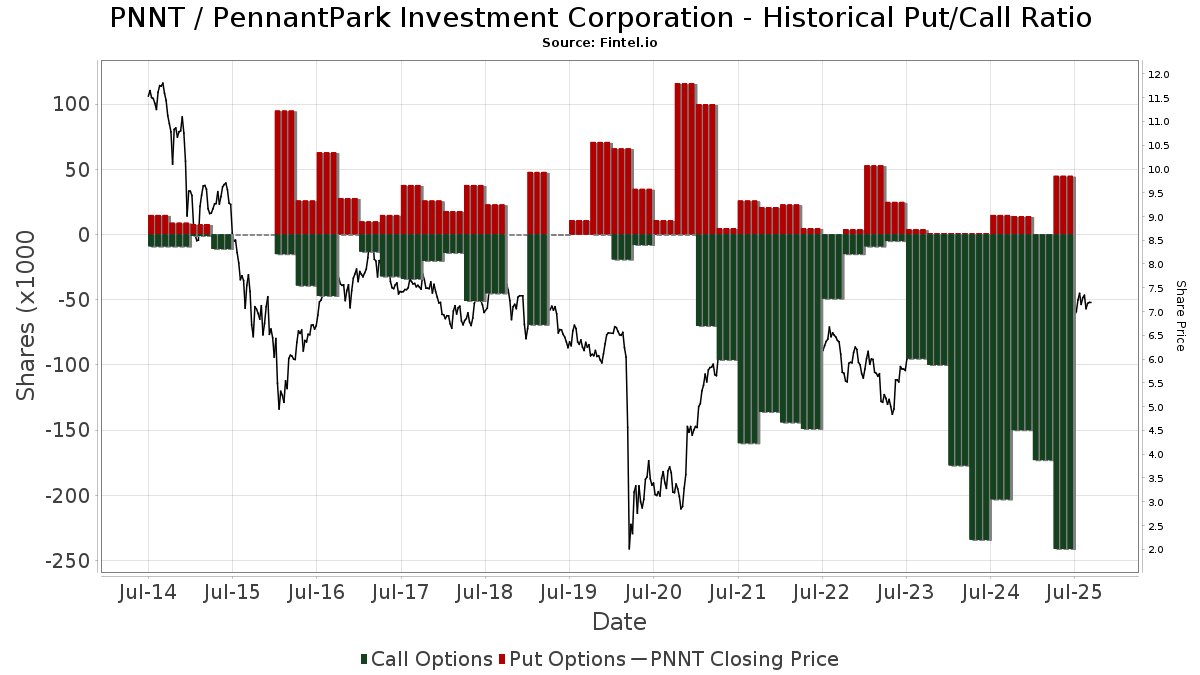
Institutionel Put/Call-forhold
Ud over at indberette standardaktie- og gældsudstedelser skal institutter med mere end 100 mill. aktiver under forvaltning også oplyse deres put- og call-optionsbeholdninger. Da salgsoptioner generelt indikerer negativ stemning, og købsoptioner indikerer positiv stemning, kan vi få en fornemmelse af den overordnede institutionelle stemning ved at plotte forholdet mellem put og kald. Diagrammet til højre viser det historiske put/call-forhold for dette instrument.
Brug af Put/Call Ratio som en indikator for investorernes stemning overvinder en af de vigtigste mangler ved at bruge totalt institutionelt ejerskab, som er, at en betydelig mængde af aktiver under forvaltning investeres passivt for at spore indekser. Passivt forvaltede fonde køber typisk ikke optioner, så indikatoren for put/call-forholdet følger mere nøje følelsen af aktivt forvaltede fonde.
13F og NPORT arkivering
Detaljer om 13F-arkivering er gratis. Detaljer om NP-ansøgninger kræver et premium-medlemskab. Grønne rækker angiver nye positioner. Røde rækker angiver lukkede positioner. Klik på linket ikon for at se den fulde transaktionshistorik.
Opgrader
for at låse premium-data op og eksportere til Excel ![]() .
.
| Fil dato | Kilde | Investor | Type | Gennemsnitlig pris (Øst) |
Aktier | Δ Aktier (%) |
Rapporteret Værdi ($1000) |
Δ Værdi (%) |
Port Alloc (%) |
|
|---|---|---|---|---|---|---|---|---|---|---|
| 2025-07-01 | 13F | Confluence Investment Management Llc | 24.623 | -81,11 | 168 | -81,66 | ||||
| 2025-07-21 | 13F | West Financial Advisors, LLC | 350 | 3,55 | 2 | 0,00 | ||||
| 2025-05-05 | 13F | Lindbrook Capital, Llc | 208 | 85,71 | 1 | |||||
| 2025-08-14 | 13F | Sunbelt Securities, Inc. | 17.577 | -75,60 | 124 | -75,49 | ||||
| 2025-08-08 | 13F | Condor Capital Management | 14.151 | -93,14 | 97 | -93,37 | ||||
| 2025-05-14 | 13F | Virtus ETF Advisers LLC | 0 | -100,00 | 0 | |||||
| 2025-08-13 | 13F | PharVision Advisers, LLC | 0 | -100,00 | 0 | |||||
| 2025-05-14 | 13F | Bnp Paribas Arbitrage, Sa | 0 | -100,00 | 0 | |||||
| 2025-08-04 | 13F | Kovack Advisors, Inc. | 67.850 | 2,73 | 464 | 0,00 | ||||
| 2025-07-21 | 13F | Ameritas Advisory Services, LLC | 558 | 4 | ||||||
| 2025-08-05 | 13F | Key FInancial Inc | 375 | 0,00 | 3 | 0,00 | ||||
| 2025-08-12 | 13F | LPL Financial LLC | 51.312 | 190,88 | 351 | 182,26 | ||||
| 2025-07-14 | 13F | Edge Wealth Management LLC | 20.000 | 0,00 | 137 | -2,86 | ||||
| 2025-08-06 | 13F | Commonwealth Equity Services, Llc | 45.062 | -20,29 | 0 | |||||
| 2025-08-08 | 13F | Larson Financial Group LLC | 2.000 | 0,00 | 14 | -7,14 | ||||
| 2025-08-27 | NP | BBVSX - Bridge Builder Small/Mid Cap Value Fund | 163.500 | 0,00 | 1.118 | -2,70 | ||||
| 2025-07-16 | 13F | Essex Financial Services, Inc. | 40.696 | 0,00 | 278 | -2,80 | ||||
| 2025-08-11 | 13F | Pin Oak Investment Advisors Inc | 0 | 0 | ||||||
| 2025-08-13 | 13F | Garner Asset Management Corp | 79.118 | -18,35 | 541 | -20,56 | ||||
| 2025-05-15 | 13F | Citadel Advisors Llc | 0 | -100,00 | 0 | -100,00 | ||||
| 2025-07-31 | 13F | Caitong International Asset Management Co., Ltd | 834 | 456,00 | 6 | 400,00 | ||||
| 2025-04-28 | 13F | Strategic Financial Concepts, LLC | 0 | -100,00 | 0 | -100,00 | ||||
| 2025-08-08 | 13F | Advisors Capital Management, LLC | 83.176 | -15,72 | 569 | -18,04 | ||||
| 2025-07-30 | 13F | Denali Advisors Llc | 106.775 | -1,82 | 730 | -4,45 | ||||
| 2025-08-15 | 13F | Tower Research Capital LLC (TRC) | 0 | -100,00 | 0 | |||||
| 2025-08-07 | 13F | Allworth Financial LP | 9.254 | 7.742,37 | 63 | |||||
| 2025-08-08 | 13F | Creative Planning | 33.369 | 26,37 | 228 | 23,24 | ||||
| 2025-08-12 | 13F | Steward Partners Investment Advisory, Llc | 1.865 | 0,00 | 13 | -7,69 | ||||
| 2025-08-14 | 13F | Citadel Advisors Llc | Put | 0 | -100,00 | 0 | ||||
| 2025-04-17 | 13F | FNY Investment Advisers, LLC | 0 | -100,00 | 0 | |||||
| 2025-04-29 | 13F | Envestnet Asset Management Inc | 0 | -100,00 | 0 | |||||
| 2025-08-11 | 13F | EMC Capital Management | 13.321 | -58,10 | 0 | |||||
| 2025-08-12 | 13F | XTX Topco Ltd | 0 | -100,00 | 0 | |||||
| 2025-08-12 | 13F | Global Retirement Partners, LLC | 7.283 | -72,29 | 50 | -73,66 | ||||
| 2025-04-23 | NP | First Trust Specialty Finance & Financial Opportunities Fund This fund is a listed as child fund of First Trust Advisors Lp and if that institution has disclosed ownership in this security, then these positions will not be double counted when calculating total shares and total value | 106.000 | -58,59 | 771 | -55,57 | ||||
| 2025-04-29 | 13F | Raleigh Capital Management Inc. | 0 | -100,00 | 0 | |||||
| 2025-08-13 | 13F | Virtus Investment Advisers, Inc. | 147.296 | -12,77 | 1.008 | -15,16 | ||||
| 2025-08-14 | 13F | Jane Street Group, Llc | 0 | -100,00 | 0 | -100,00 | ||||
| 2025-08-12 | 13F | BlackRock, Inc. | 500.390 | 21,06 | 3.423 | 17,80 | ||||
| 2025-07-03 | 13F | Garde Capital, Inc. | 1.110 | 0,00 | 8 | 0,00 | ||||
| 2025-07-21 | 13F | Catalina Capital Group, LLC | 0 | -100,00 | 0 | |||||
| 2025-08-11 | 13F | Citigroup Inc | 1.439 | 0,00 | 10 | -10,00 | ||||
| 2025-05-02 | 13F/A | Mackenzie Financial Corp | 0 | -100,00 | 0 | |||||
| 2025-08-14 | 13F | Mariner, LLC | 12.630 | 86 | ||||||
| 2025-08-14 | 13F | Verition Fund Management LLC | 25.775 | 176 | ||||||
| 2025-08-11 | 13F | Hexagon Capital Partners LLC | 0 | -100,00 | 0 | |||||
| 2025-08-13 | 13F | Cresset Asset Management, LLC | 23.002 | 2,22 | 159 | 0,00 | ||||
| 2025-05-05 | 13F | IFP Advisors, Inc | 0 | -100,00 | 0 | |||||
| 2025-07-25 | 13F | Atria Wealth Solutions, Inc. | 0 | -100,00 | 0 | |||||
| 2025-08-04 | 13F | Arkadios Wealth Advisors | 30.061 | 0,00 | 206 | -2,84 | ||||
| 2025-08-13 | 13F | Quadrant Capital Group Llc | 0 | -100,00 | 0 | |||||
| 2025-05-12 | 13F | Virtu Financial LLC | 0 | -100,00 | 0 | |||||
| 2025-08-05 | 13F | Simplex Trading, Llc | Put | 400 | 0,00 | 0 | ||||
| 2025-08-13 | 13F | Northern Trust Corp | 46.204 | 90,85 | 316 | 85,88 | ||||
| 2025-08-05 | 13F | Simplex Trading, Llc | Call | 39.100 | 272,38 | 0 | ||||
| 2025-08-14 | 13F/A | Rockefeller Capital Management L.P. | 195.676 | 0,00 | 1.338 | -2,69 | ||||
| 2025-08-08 | 13F | Pnc Financial Services Group, Inc. | 2.635 | 0,00 | 18 | 0,00 | ||||
| 2025-08-14 | 13F | Brevan Howard Capital Management LP | 39.347 | 269 | ||||||
| 2025-08-14 | 13F | Royal Bank Of Canada | 65.208 | 62,39 | 446 | 58,16 | ||||
| 2025-08-13 | 13F | Baird Financial Group, Inc. | 13.725 | 0,00 | 94 | -3,12 | ||||
| 2025-05-29 | NP | JAFEX - Total Stock Market Index Trust NAV | 25 | -98,48 | 0 | -100,00 | ||||
| 2025-08-13 | 13F | Truvestments Capital Llc | 595.000 | -0,26 | 4.070 | -2,96 | ||||
| 2025-06-27 | NP | LBO - WHITEWOLF Publicly Listed Private Equity ETF | 5.739 | 14,28 | 37 | 5,71 | ||||
| 2025-08-11 | 13F | Principal Securities, Inc. | 500 | 3 | ||||||
| 2025-08-13 | 13F | Quantbot Technologies LP | 19.229 | 132 | ||||||
| 2025-04-18 | 13F | Cornerstone Wealth Management, LLC | 0 | -100,00 | 0 | -100,00 | ||||
| 2025-08-11 | 13F | Lsv Asset Management | 1.782.360 | -3,33 | 12 | 0,00 | ||||
| 2025-08-13 | 13F | Texas Capital Bank Wealth Management Services Inc | 152.033 | 0,00 | 1.040 | -2,72 | ||||
| 2025-08-14 | 13F | Aquatic Capital Management LLC | 24.616 | 168 | ||||||
| 2025-08-06 | 13F | Smh Capital Advisors Inc | 68.210 | 0,00 | 467 | -2,71 | ||||
| 2025-07-28 | 13F | Harbour Investments, Inc. | 160 | 0,00 | 1 | 0,00 | ||||
| 2025-08-08 | 13F | Alberta Investment Management Corp | 0 | -100,00 | 0 | |||||
| 2025-05-14 | 13F | Group One Trading, L.p. | Put | 0 | -100,00 | 0 | -100,00 | |||
| 2025-08-14 | 13F | Raymond James Financial Inc | 90.525 | -0,83 | 619 | -3,43 | ||||
| 2025-07-17 | 13F | Sound Income Strategies, LLC | 2.573 | 0,00 | 18 | -5,56 | ||||
| 2025-07-29 | 13F | International Assets Investment Management, Llc | 31.350 | 0,00 | 214 | -2,73 | ||||
| 2025-08-11 | 13F | NewEdge Wealth, LLC | 255.399 | -9,42 | 1.847 | -6,86 | ||||
| 2025-08-11 | 13F | HighTower Advisors, LLC | 23.373 | -35,55 | 160 | -37,40 | ||||
| 2025-07-16 | 13F | Beaumont Financial Advisors, LLC | 25.343 | 3,61 | 173 | 1,17 | ||||
| 2025-08-26 | 13F/A | Thrivent Financial For Lutherans | 48.285 | 0 | ||||||
| 2025-05-06 | 13F | Cetera Investment Advisers | 0 | -100,00 | 0 | |||||
| 2025-07-17 | 13F | Janney Montgomery Scott LLC | 132.518 | 1,13 | 1 | |||||
| 2025-08-14 | 13F | LaSalle St. Investment Advisors, LLC | 19.559 | -13,16 | 0 | |||||
| 2025-07-14 | 13F | Ridgewood Investments LLC | 1.000 | 0,00 | 7 | -14,29 | ||||
| 2025-08-14 | 13F | Bank Of America Corp /de/ | 93.985 | -4,84 | 643 | -7,49 | ||||
| 2025-08-14 | 13F | Wells Fargo & Company/mn | 47.914 | 28,84 | 328 | 25,29 | ||||
| 2025-07-17 | 13F | Sterneck Capital Management, LLC | 72.894 | 14,09 | 499 | 10,91 | ||||
| 2025-08-14 | 13F | Two Sigma Securities, Llc | 11.427 | 8,74 | 78 | 6,85 | ||||
| 2025-08-12 | 13F | MAI Capital Management | 235 | 2 | ||||||
| 2025-08-14 | 13F | Susquehanna International Group, Llp | 19.148 | -59,51 | 131 | -60,84 | ||||
| 2025-07-29 | NP | SLPAX - Siit Small Cap Fund - Class A | 43.000 | 0,00 | 286 | -8,33 | ||||
| 2025-07-11 | 13F | Farther Finance Advisors, LLC | 325 | 2,52 | 2 | 0,00 | ||||
| 2025-08-14 | 13F | Susquehanna International Group, Llp | Call | 112.100 | -24,00 | 767 | -26,06 | |||
| 2025-08-14 | 13F | Group One Trading, L.p. | Call | 54.200 | 2.752,63 | 371 | 2.746,15 | |||
| 2025-08-14 | 13F | Susquehanna International Group, Llp | Put | 24.400 | 167 | |||||
| 2025-08-05 | 13F | Dunhill Financial, LLC | 7.927 | 54 | ||||||
| 2025-08-12 | 13F | Trexquant Investment LP | 0 | -100,00 | 0 | |||||
| 2025-06-25 | NP | VPC - Virtus Private Credit Strategy ETF | 154.242 | 5,04 | 1.006 | -3,74 | ||||
| 2025-07-16 | 13F | Signaturefd, Llc | 37.539 | 3,10 | 257 | 0,39 | ||||
| 2025-06-26 | NP | LSVQX - LSV Small Cap Value Fund Institutional Class Shares | 195.900 | 0,00 | 1.277 | -8,26 | ||||
| 2025-07-22 | 13F | Grimes & Company, Inc. | 38.788 | -24,87 | 265 | -26,80 | ||||
| 2025-07-29 | 13F | Regions Financial Corp | 20.000 | 0,00 | 137 | -2,86 | ||||
| 2025-08-14 | 13F | Stifel Financial Corp | 18.708 | -16,33 | 128 | -19,11 | ||||
| 2025-08-14 | 13F | Citadel Advisors Llc | Call | 36.300 | 168,89 | 248 | 163,83 | |||
| 2025-07-18 | 13F | Trust Co Of Vermont | 1.050 | 7 | ||||||
| 2025-07-21 | 13F | Ameriflex Group, Inc. | 0 | -100,00 | 0 | |||||
| 2025-08-12 | 13F | CIBC Private Wealth Group, LLC | 6.600 | 0,00 | 45 | 15,38 | ||||
| 2025-08-12 | 13F | Proequities, Inc. | Put | 0 | 0 | |||||
| 2025-08-14 | 13F | Quarry LP | 0 | -100,00 | 0 | |||||
| 2025-05-15 | 13F | Millennium Management Llc | 0 | -100,00 | 0 | -100,00 | ||||
| 2025-07-30 | 13F | Brookstone Capital Management | 10.415 | 3,61 | 71 | 1,43 | ||||
| 2025-08-07 | 13F | Hennion & Walsh Asset Management, Inc. | 462.709 | -25,88 | 3.165 | -27,89 | ||||
| 2025-08-12 | 13F | Proequities, Inc. | Call | 0 | 0 | |||||
| 2025-08-13 | 13F | EverSource Wealth Advisors, LLC | 3.695 | 100,60 | 25 | 108,33 | ||||
| 2025-08-12 | 13F | Proequities, Inc. | 0 | 0 | ||||||
| 2025-08-14 | 13F | Abbot Financial Management, Inc. | 74.511 | 0,01 | 510 | -2,68 | ||||
| 2025-08-14 | 13F | Two Sigma Advisers, Lp | 1.276.218 | -5,02 | 8.729 | -7,59 | ||||
| 2025-08-15 | 13F | Morgan Stanley | 477.967 | -2,51 | 3.269 | -5,14 | ||||
| 2025-07-14 | 13F | Crew Capital Management, Ltd. | 0 | -100,00 | 0 | |||||
| 2025-06-12 | 13F/A | Deutsche Bank Ag\ | 0 | -100,00 | 0 | |||||
| 2025-08-28 | NP | SMVIX - Simt Small Cap Value Fund Class I | 8.318 | -71,58 | 57 | -72,68 | ||||
| 2025-08-14 | 13F | Qube Research & Technologies Ltd | 0 | -100,00 | 0 | |||||
| 2025-08-14 | 13F | BI Asset Management Fondsmaeglerselskab A/S | 89.022 | 0,00 | 1 | |||||
| 2025-05-14 | 13F | Congress Wealth Management LLC / DE / | 0 | -100,00 | 0 | |||||
| 2025-08-12 | 13F | Advisors Asset Management, Inc. | 526.754 | -13,67 | 3.603 | -16,02 | ||||
| 2025-08-14 | 13F | UBS Group AG | 154.394 | 48,08 | 1.056 | 44,26 | ||||
| 2025-08-13 | 13F | Marshall Wace, Llp | 0 | -100,00 | 0 | |||||
| 2025-04-22 | 13F | TrueMark Investments, LLC | 0 | -100,00 | 0 | |||||
| 2025-08-14 | 13F | Evergreen Capital Management Llc | 21.167 | -20,94 | 146 | -23,16 | ||||
| 2025-04-04 | 13F | Webster Bank, N. A. | 0 | -100,00 | 0 | |||||
| 2025-07-24 | 13F | Us Bancorp \de\ | 40 | 0,00 | 0 | |||||
| 2025-07-28 | NP | KBWD - Invesco KBW High Dividend Yield Financial ETF This fund is a listed as child fund of Invesco Ltd. and if that institution has disclosed ownership in this security, then these positions will not be double counted when calculating total shares and total value | 1.836.639 | 0,00 | 12.232 | -8,39 | ||||
| 2025-08-13 | 13F | Lido Advisors, LLC | 246.312 | 0,00 | 1.704 | -2,68 | ||||
| 2025-08-08 | 13F | Cedar Wealth Management, LLC | 3.940 | 0,00 | 27 | -3,70 | ||||
| 2025-08-12 | 13F | Jpmorgan Chase & Co | 200 | -96,64 | 1 | -97,56 | ||||
| 2025-08-12 | 13F | Founders Financial Alliance, LLC | 62.127 | -2,15 | 425 | -4,93 | ||||
| 2025-07-31 | 13F | Cambridge Investment Research Advisors, Inc. | 37.894 | 5,61 | 0 | |||||
| 2025-05-23 | 13F | SWAN Capital LLC | 0 | -100,00 | 0 | |||||
| 2025-09-04 | 13F/A | Advisor Group Holdings, Inc. | 75.046 | -2,31 | 513 | -5,00 | ||||
| 2025-08-13 | 13F | Invesco Ltd. | 1.836.639 | 0,00 | 12.563 | -2,70 | ||||
| 2025-08-05 | 13F | Huntington National Bank | 1 | 0,00 | 0 | |||||
| 2025-05-02 | 13F | Legacy Capital Wealth Partners, LLC | 0 | -100,00 | 0 | |||||
| 2025-08-01 | 13F | Rossby Financial, LCC | 1.500 | 0,00 | 10 | 11,11 | ||||
| 2025-08-28 | NP | TRIFX - Catalyst/SMH Total Return Income Fund Class A | 68.210 | 0,00 | 467 | -2,71 | ||||
| 2025-08-04 | 13F | Roble, Belko & Company, Inc | 124 | 3,33 | 0 | |||||
| 2025-08-14 | 13F | Hrt Financial Lp | 21.250 | 0 | ||||||
| 2025-08-04 | 13F | Spire Wealth Management | 1.134 | 8 | ||||||
| 2025-08-14 | 13F | Jane Street Group, Llc | Put | 20.300 | 139 | |||||
| 2025-08-12 | 13F | Close Asset Management Ltd | 23.800 | -38,66 | 0 | |||||
| 2025-08-12 | 13F | Legal & General Group Plc | 430.816 | -1,53 | 2.942 | -4,26 | ||||
| 2025-08-06 | 13F | First Horizon Advisors, Inc. | 5.179 | 35 | ||||||
| 2025-08-15 | 13F | Caxton Associates Llp | 48.210 | 0,00 | 330 | -2,66 | ||||
| 2025-08-25 | NP | TMVAX - RBC Microcap Value Fund A Shares | 24.100 | 0,00 | 165 | -2,96 | ||||
| 2025-07-14 | 13F | Gries Financial Llc | 43.935 | 0,00 | 301 | -2,60 | ||||
| 2025-08-04 | 13F | Integrity Alliance, Llc. | 11.935 | 0,81 | 82 | -2,41 | ||||
| 2025-07-14 | 13F | UMA Financial Services, Inc. | 175 | 1 | ||||||
| 2025-08-08 | 13F | Foundations Investment Advisors, LLC | 29.465 | 0,03 | 202 | -2,90 | ||||
| 2025-08-06 | 13F | Ethos Financial Group, LLC | 28.212 | 0,00 | 193 | -3,03 | ||||
| 2025-08-13 | 13F | Northwestern Mutual Wealth Management Co | 7.275 | 0,00 | 50 | -3,92 | ||||
| 2025-08-14 | 13F | Two Sigma Investments, Lp | 928.171 | -4,01 | 6.349 | -6,61 | ||||
| 2025-08-15 | 13F | Great West Life Assurance Co /can/ | 67.685 | 6,55 | 0 | |||||
| 2025-08-11 | 13F | Universal- Beteiligungs- und Servicegesellschaft mbH | 348.800 | 0,00 | 2.386 | -2,73 | ||||
| 2025-07-22 | 13F | Sage Investment Counsel LLC | 17.000 | -15,00 | 116 | -17,14 | ||||
| 2025-07-16 | 13F | Meridian Investment Counsel Inc. | 45.200 | -2,16 | 309 | -4,63 | ||||
| 2025-08-08 | 13F | Fortis Group Advisors, LLC | 523 | 0,00 | 4 | 0,00 | ||||
| 2025-07-08 | 13F | Parallel Advisors, LLC | 11.199 | -5,04 | 77 | -7,32 | ||||
| 2025-07-31 | 13F | Catalyst Capital Advisors LLC | 68.210 | 0,00 | 467 | -2,71 |