Grundlæggende statistik
| Institutionelle ejere | 153 total, 153 long only, 0 short only, 0 long/short - change of -1,29% MRQ |
| Gennemsnitlig porteføljeallokering | 0.0901 % - change of -34,73% MRQ |
| Institutionelle aktier (lange) | 18.212.864 (ex 13D/G) - change of -1,23MM shares -6,34% MRQ |
| Institutionel værdi (lang) | $ 392.380 USD ($1000) |
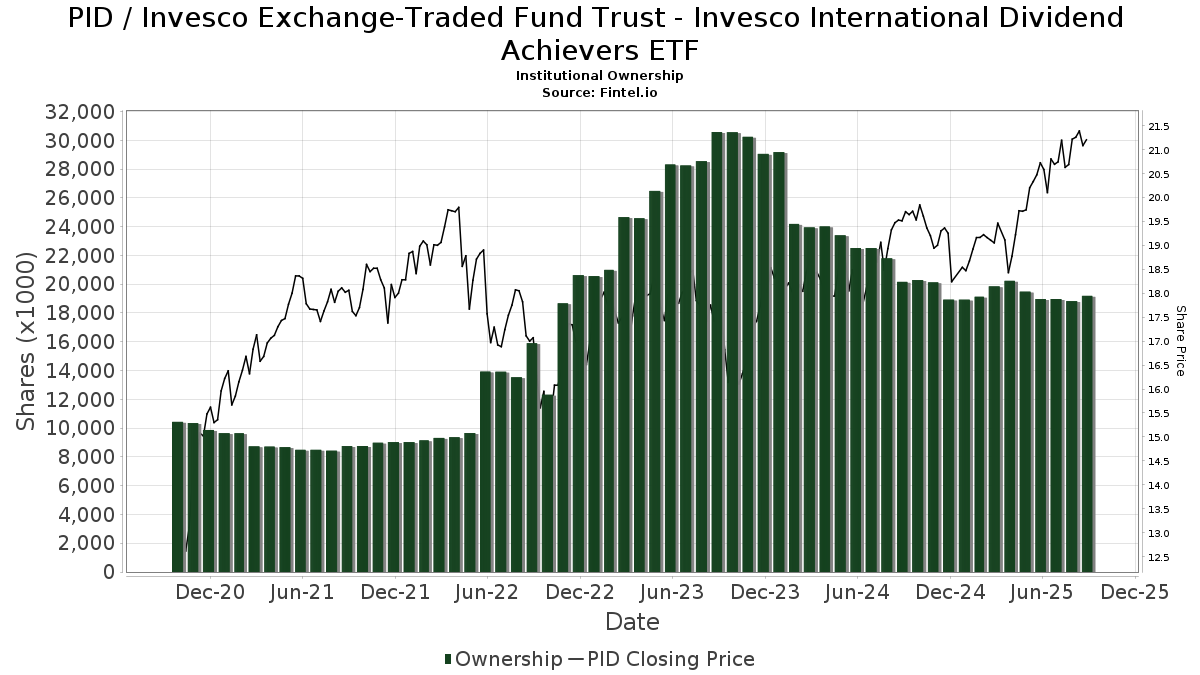
Institutionelt ejerskab og aktionærer
Invesco Exchange-Traded Fund Trust - Invesco International Dividend Achievers ETF (US:PID) har 153 institutionelle ejere og aktionærer, der har indsendt 13D/G- eller 13F-formularer til Securities Exchange Commission (SEC). Disse institutioner har i alt 18,212,864 aktier. Største aktionærer omfatter Morgan Stanley, Wells Fargo & Company/mn, LPL Financial LLC, Strategic Wealth Partners, Ltd., Modern Wealth Management, LLC, Bank Of America Corp /de/, UBS Group AG, Ameriprise Financial Inc, Equitable Holdings, Inc., and Jones Financial Companies Lllp .
Invesco Exchange-Traded Fund Trust - Invesco International Dividend Achievers ETF (NasdaqGM:PID) institutionel ejerskabsstruktur viser aktuelle positioner i virksomheden efter institutioner og fonde, samt seneste ændringer i positionsstørrelse. Større aktionærer kan omfatte individuelle investorer, investeringsforeninger, hedgefonde eller institutioner. Skema 13D angiver, at investoren besidder (eller besidder) mere end 5 % af virksomheden og har til hensigt (eller har til hensigt at) aktivt at forfølge en ændring i forretningsstrategi. Skema 13G indikerer en passiv investering på over 5%.
The share price as of April 24, 2026 is 22,68 / share. Previously, on April 28, 2025, the share price was 19,53 / share. This represents an increase of 16,13% over that period.
Fondens stemningsscore
Fund Sentiment Score (fka Ownership Accumulation Score) finder de aktier, der bliver mest købt af fonde. Det er resultatet af en sofistikeret, multi-faktor kvantitativ model, der identificerer virksomheder med de højeste niveauer af institutionel akkumulering. Scoringsmodellen bruger en kombination af den samlede stigning i oplyste ejere, ændringerne i porteføljeallokeringer i disse ejere og andre målinger. Tallet går fra 0 til 100, hvor højere tal indikerer et højere niveau af akkumulering for sine jævnaldrende, og 50 er gennemsnittet.
Opdateringsfrekvens: Dagligt
Se Ownership Explorer, som giver en liste over højest rangerende virksomheder.
AI+ Ask Fintel’s AI assistant about Invesco Exchange-Traded Fund Trust - Invesco International Dividend Achievers ETF.
Select a question to share a public post with an AI-crafted answer.
Thinking of good questions…
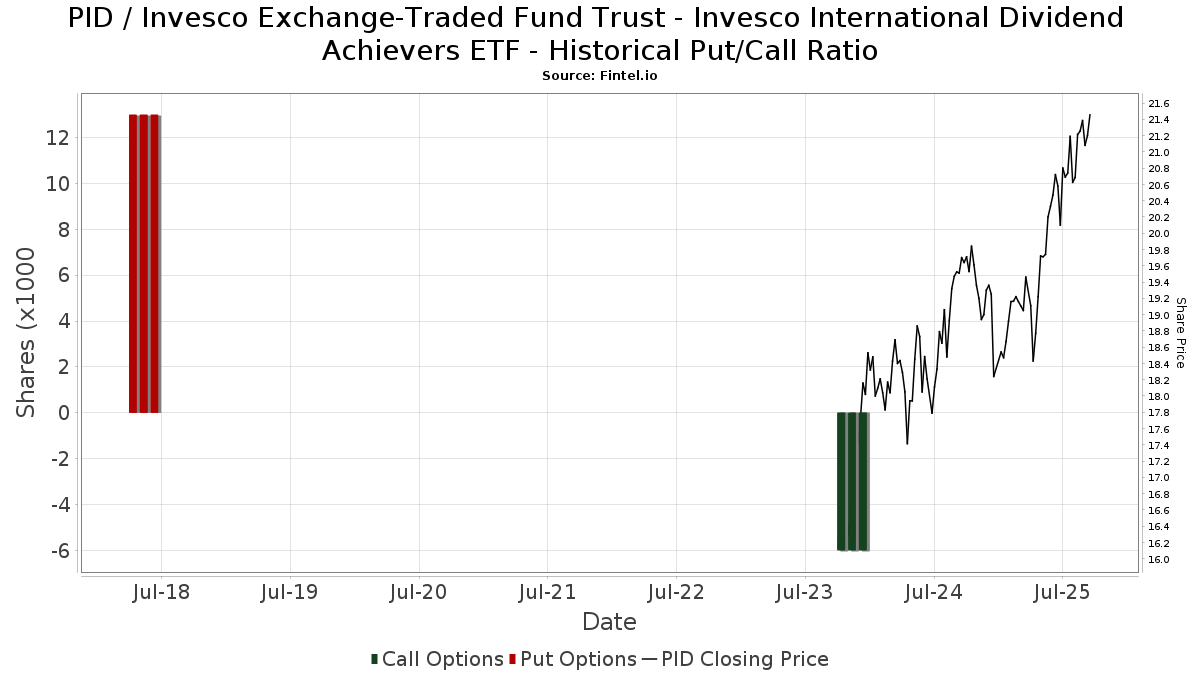
Institutionel Put/Call-forhold
Ud over at indberette standardaktie- og gældsudstedelser skal institutter med mere end 100 mill. aktiver under forvaltning også oplyse deres put- og call-optionsbeholdninger. Da salgsoptioner generelt indikerer negativ stemning, og købsoptioner indikerer positiv stemning, kan vi få en fornemmelse af den overordnede institutionelle stemning ved at plotte forholdet mellem put og kald. Diagrammet til højre viser det historiske put/call-forhold for dette instrument.
Brug af Put/Call Ratio som en indikator for investorernes stemning overvinder en af de vigtigste mangler ved at bruge totalt institutionelt ejerskab, som er, at en betydelig mængde af aktiver under forvaltning investeres passivt for at spore indekser. Passivt forvaltede fonde køber typisk ikke optioner, så indikatoren for put/call-forholdet følger mere nøje følelsen af aktivt forvaltede fonde.
13F og NPORT arkivering
Detaljer om 13F-arkivering er gratis. Detaljer om NP-ansøgninger kræver et premium-medlemskab. Grønne rækker angiver nye positioner. Røde rækker angiver lukkede positioner. Klik på linket ikon for at se den fulde transaktionshistorik.
Opgrader
for at låse premium-data op og eksportere til Excel ![]() .
.
| Fil dato | Kilde | Investor | Type | Gennemsnitlig pris (Øst) |
Aktier | Δ Aktier (%) |
Rapporteret Værdi ($1000) |
Δ Værdi (%) |
Port Alloc (%) |
|
|---|---|---|---|---|---|---|---|---|---|---|
| 2026-02-12 | 13F | Steward Partners Investment Advisory, Llc | 1.584 | 0,19 | 35 | 3,03 | ||||
| 2026-02-06 | 13F | Pnc Financial Services Group, Inc. | 2.875 | 20,29 | 63 | 26,00 | ||||
| 2026-01-23 | 13F | Nbt Bank N A /ny | 1.900 | 0,00 | 42 | 2,50 | ||||
| 2026-02-06 | 13F | GPS Wealth Strategies Group, LLC | 0 | -100,00 | 0 | |||||
| 2026-04-13 | 13F | IFP Advisors, Inc | 2.038 | 0,00 | 45 | 2,27 | ||||
| 2026-04-20 | 13F | Brandywine Oak Private Wealth Llc | 68.750 | -1,00 | 1.529 | 0,13 | ||||
| 2026-02-17 | 13F | Equitable Holdings, Inc. | 727.943 | 43,88 | 16.015 | 48,84 | ||||
| 2025-11-14 | 13F | Flow Traders U.s. Llc | 0 | -100,00 | 0 | |||||
| 2025-11-04 | 13F | Atala Financial Inc | 0 | -100,00 | 0 | |||||
| 2026-02-06 | 13F | AAFCPAs Wealth Management, LLC | 75.681 | -4,41 | 1.665 | -1,13 | ||||
| 2026-02-17 | 13F | NorthRock Partners, LLC | 9.598 | 0,07 | 211 | 3,94 | ||||
| 2026-02-03 | 13F | Cheviot Value Management, LLC | 129.134 | -0,03 | 2.943 | 5,11 | ||||
| 2026-02-17 | 13F | Fmr Llc | 7.880 | -6,94 | 173 | -3,89 | ||||
| 2026-02-13 | 13F | SRS Capital Advisors, Inc. | 10.678 | 15,93 | 235 | 20,00 | ||||
| 2026-02-19 | 13F | CI Private Wealth, LLC | 62.063 | -0,77 | 1.365 | 2,63 | ||||
| 2026-02-06 | 13F | Principle Wealth Partners Llc | 38.262 | 0,00 | 842 | 3,44 | ||||
| 2026-02-05 | 13F | Center for Financial Planning, Inc. | 1.521 | 0,00 | 33 | 3,13 | ||||
| 2026-02-06 | 13F | Addison Advisors LLC | 655 | -9,03 | 14 | -6,67 | ||||
| 2026-02-13 | 13F | Golden State Wealth Management, LLC | 23.718 | -12,58 | 522 | -9,71 | ||||
| 2026-04-10 | 13F | Winebrenner Capital Management Llc | 40.865 | -19,66 | 909 | -18,77 | ||||
| 2026-02-17 | 13F | Creative Planning | 107.029 | -1,89 | 2.355 | 1,47 | ||||
| 2026-02-06 | 13F | GLOBALT Investments LLC / GA | 29.722 | -1,88 | 654 | 1,40 | ||||
| 2026-02-02 | 13F | Oak Harbor Wealth Partners, Llc | 0 | -100,00 | 0 | |||||
| 2026-02-11 | 13F | First American Trust, Fsb | 93.105 | 2.048 | ||||||
| 2026-01-29 | 13F | Comerica Bank | 17.093 | -0,90 | 376 | 2,73 | ||||
| 2026-02-18 | 13F | EP Wealth Advisors, Inc. | 0 | -100,00 | 0 | -100,00 | ||||
| 2026-02-24 | 13F | MidFirst Bank | 399 | 9 | ||||||
| 2026-02-17 | 13F | Russell Investments Group, Ltd. | 1.932 | 43 | ||||||
| 2026-01-28 | 13F | Geneos Wealth Management Inc. | 4.919 | 8,01 | 108 | 12,50 | ||||
| 2026-02-05 | 13F | Cambridge Investment Research Advisors, Inc. | 229.657 | -4,40 | 5 | 0,00 | ||||
| 2026-02-12 | 13F | Bank Of Montreal /can/ | 5.106 | 0,00 | 112 | 3,70 | ||||
| 2026-02-13 | 13F | Genesis Wealth Advisors, LLC | 10.710 | 0,00 | 236 | 3,52 | ||||
| 2026-02-12 | 13F | Founders Financial Alliance, LLC | 9.279 | -11,22 | 204 | -8,11 | ||||
| 2026-04-24 | 13F | Root Financial Partners, LLC | 2.952 | 0,00 | 66 | 1,56 | ||||
| 2026-04-16 | 13F | Capital Advisors, Ltd. LLC | 23.491 | -2,61 | 1 | |||||
| 2026-01-28 | 13F | Kingswood Wealth Advisors, Llc | 9.674 | 213 | ||||||
| 2026-01-21 | 13F | Flagship Harbor Advisors, Llc | 19.392 | 10,24 | 427 | 13,90 | ||||
| 2026-02-17 | 13F | Royal Bank Of Canada | 280.005 | 8,13 | 6.160 | 11,88 | ||||
| 2026-02-11 | 13F | Capital Analysts, Inc. | 54.131 | -4,18 | 1 | 0,00 | ||||
| 2026-01-30 | 13F | Sigma Planning Corp | 18.946 | 4,18 | 417 | 7,77 | ||||
| 2026-02-03 | 13F | Emerald Investment Partners, Llc | 40.173 | -0,47 | 884 | 2,91 | ||||
| 2026-02-13 | 13F | Stifel Financial Corp | 87.936 | 0,03 | 1.935 | 3,48 | ||||
| 2026-04-14 | 13F | Focus Financial Network, Inc. | 183.977 | -19,50 | 4.093 | -18,62 | ||||
| 2026-01-21 | 13F | Capital Investment Advisory Services, LLC | 12.288 | 1,60 | 270 | 5,06 | ||||
| 2026-02-13 | 13F | Evelyn Partners Asset Management Ltd | 1.408 | 31 | ||||||
| 2026-01-21 | 13F | BIP Wealth, LLC | 21.800 | 0,00 | 480 | 3,46 | ||||
| 2026-02-17 | 13F | Cahill Financial Advisors Inc | 221.334 | -1,00 | 4.869 | 2,42 | ||||
| 2026-04-14 | 13F | Drive Wealth Management, Llc | 39.088 | 13,01 | 870 | 14,34 | ||||
| 2026-02-17 | 13F | Advisory Services Network, LLC | 0 | -100,00 | 0 | |||||
| 2026-02-17 | 13F | VestGen Advisors, LLC | 92.275 | -16,23 | 2.030 | -13,32 | ||||
| 2026-02-13 | 13F | Umb Bank N A/mo | 14.600 | 321 | ||||||
| 2026-01-26 | 13F | Cwm, Llc | 3.386 | 20,50 | 0 | |||||
| 2026-04-08 | 13F | Accel Wealth Management | 42.284 | -14,03 | 941 | -13,12 | ||||
| 2026-01-27 | 13F | Institute for Wealth Management, LLC. | 49.427 | -0,40 | 1.087 | 3,03 | ||||
| 2026-04-22 | 13F | Apollon Wealth Management, LLC | 0 | -100,00 | 0 | |||||
| 2026-02-11 | 13F | LPL Financial LLC | 1.317.186 | 0,40 | 28.978 | 3,86 | ||||
| 2026-02-10 | 13F/A | Northwestern Mutual Wealth Management Co | 269.716 | 0,61 | 5.934 | 4,07 | ||||
| 2026-02-10 | 13F | Envestnet Asset Management Inc | 219.415 | -2,58 | 4.827 | 0,79 | ||||
| 2026-02-13 | 13F | Arkadios Wealth Advisors | 23.662 | 0,02 | 521 | 3,38 | ||||
| 2026-02-17 | 13F | Ameriflex Group, Inc. | 1.390 | 31 | ||||||
| 2025-11-14 | 13F | Guardian Wealth Advisors, Llc / Nc | 0 | -100,00 | 0 | |||||
| 2026-04-24 | 13F | Bellevue Asset Management, Llc | 367 | 0,82 | 8 | 0,00 | ||||
| 2026-04-24 | 13F | Essex Financial Services, Inc. | 18.104 | 0,13 | 403 | 1,26 | ||||
| 2026-01-26 | 13F | AE Wealth Management LLC | 100 | 2 | ||||||
| 2026-02-17 | 13F | Captrust Financial Advisors | 12.945 | 0,25 | 285 | 3,65 | ||||
| 2026-02-27 | 13F | Strategic Investment Solutions, Inc. /IL | 84 | 0,00 | 2 | 0,00 | ||||
| 2026-02-17 | 13F | Jones Financial Companies Lllp | 636.291 | 3,20 | 13.998 | 7,10 | ||||
| 2025-11-06 | 13F | Atria Investments Llc | 0 | -100,00 | 0 | |||||
| 2026-02-13 | 13F | Aptus Capital Advisors, LLC | 1.029 | 0,00 | 23 | 4,76 | ||||
| 2026-04-06 | 13F | GAMMA Investing LLC | 1.792 | 0,00 | 40 | 0,00 | ||||
| 2026-02-10 | 13F | Calton & Associates, Inc. | 13.588 | 4,52 | 299 | 7,97 | ||||
| 2026-02-06 | 13F | HighTower Advisors, LLC | 195.195 | 0,11 | 4.294 | 3,57 | ||||
| 2026-02-17 | 13F | Ameriprise Financial Inc | 805.552 | -1,30 | 17.722 | 2,06 | ||||
| 2026-02-17 | 13F | Appalachian Capital Management Ltd | 26.912 | 592 | ||||||
| 2026-04-22 | 13F | SimpliFi, Inc. | 22.744 | 0,91 | 506 | 2,02 | ||||
| 2026-02-10 | 13F | IFG Advisory, LLC | 30.915 | 680 | ||||||
| 2026-02-13 | 13F | Morgan Stanley | 3.138.532 | 0,08 | 69.048 | 3,52 | ||||
| 2026-04-20 | 13F | Eagle Strategies LLC | 34.626 | -11,21 | 770 | -10,15 | ||||
| 2026-04-16 | 13F | Davis Capital Management | 2 | 0,00 | 0 | |||||
| 2026-02-17 | 13F | Raymond James Financial Inc | 222.947 | 10,06 | 4.905 | 13,83 | ||||
| 2026-02-12 | 13F | Wealthspire Advisors, LLC | 0 | -100,00 | 0 | |||||
| 2026-01-29 | 13F | Concurrent Investment Advisors, LLC | 12.567 | 276 | ||||||
| 2026-02-02 | 13F | Mutual Advisors, LLC | 17.765 | -8,62 | 391 | -6,70 | ||||
| 2026-04-15 | 13F | Merit Financial Group, LLC | 26.857 | -9,46 | 597 | -8,44 | ||||
| 2025-11-12 | 13F | Park Square Financial Group, LLC | 0 | -100,00 | 0 | |||||
| 2026-04-24 | 13F | Medallion Wealth Advisors, LLC | 2.647 | 0,00 | 59 | 0,00 | ||||
| 2025-11-14 | 13F | Strategic Wealth Partners, Ltd. | 958.941 | 0,03 | 20.394 | 3,78 | ||||
| 2026-04-15 | 13F | Valley National Advisers Inc | 73 | 0,00 | 0 | |||||
| 2026-02-17 | 13F | Citadel Advisors Llc | 0 | -100,00 | 0 | |||||
| 2026-02-09 | 13F | Kingsview Wealth Management, LLC | 24.186 | -3,22 | 532 | 0,19 | ||||
| 2026-02-13 | 13F | Saxon Interests, Inc. | 20.081 | 51,55 | 442 | 55,83 | ||||
| 2026-04-21 | 13F | Morton Capital Management LLC/CA | 243.871 | -0,56 | 5.425 | 0,56 | ||||
| 2026-02-04 | 13F | H&H Retirement Design & Management INC | 88.129 | 10,04 | 2.003 | 15,51 | ||||
| 2026-04-14 | 13F | Zrc Wealth Management, Llc | 380 | 0,00 | 8 | 0,00 | ||||
| 2026-02-11 | 13F | Jpmorgan Chase & Co | 110.813 | 0,96 | 2.438 | 4,41 | ||||
| 2026-02-14 | 13F | Rockefeller Capital Management L.P. | 24.244 | 0,05 | 533 | 3,50 | ||||
| 2026-04-08 | 13F | Nestegg Advisors, Inc. | 49.272 | -14,41 | 1.096 | -13,43 | ||||
| 2026-02-17 | 13F | Wiley Bros.-aintree Capital, Llc | 75.000 | -3,57 | 1.650 | -0,30 | ||||
| 2026-02-05 | 13F | Allworth Financial LP | 6.116 | 3,78 | 135 | 7,20 | ||||
| 2026-04-07 | 13F | Farther Finance Advisors, LLC | 109 | 0,00 | 2 | 0,00 | ||||
| 2025-11-06 | 13F | CENTRAL TRUST Co | 0 | -100,00 | 0 | |||||
| 2026-04-22 | 13F | JNBA Financial Advisors | 1.025 | 0,00 | 23 | 0,00 | ||||
| 2026-02-04 | 13F | Legacy Financial Advisors, Inc. | 40.406 | -1,14 | 889 | 2,19 | ||||
| 2026-01-29 | 13F | Dunhill Financial, LLC | 326 | 0,62 | 7 | 16,67 | ||||
| 2026-01-28 | 13F | Salomon & Ludwin, LLC | 1.212 | 0,00 | 27 | 0,00 | ||||
| 2026-02-11 | 13F | Parallel Advisors, LLC | 1.400 | -8,50 | 31 | -6,25 | ||||
| 2026-02-05 | 13F | Western Wealth Management, LLC | 13.833 | 7,11 | 304 | 10,95 | ||||
| 2026-02-03 | 13F | International Assets Investment Management, Llc | 80 | 2 | ||||||
| 2026-02-12 | 13F | Principal Securities, Inc. | 0 | -100,00 | 0 | -100,00 | ||||
| 2026-04-16 | 13F | Capital Investment Advisors, LLC | 55.826 | -3,89 | 1.242 | -2,82 | ||||
| 2026-02-17 | 13F | Advisor Group Holdings, Inc. | 298.476 | -1,18 | 6.568 | 2,48 | ||||
| 2026-02-09 | 13F | Harbour Investments, Inc. | 297 | 7 | ||||||
| 2026-02-10 | 13F | Godfrey Financial Associates, Inc. | 400 | 9 | ||||||
| 2026-02-12 | 13F | Wood Tarver Financial Group, LLC | 25.564 | -4,03 | 1 | |||||
| 2026-02-17 | 13F | Lantern Wealth Advisors, LLC | 10.000 | 0,00 | 220 | 3,77 | ||||
| 2026-01-29 | 13F | Sanctuary Advisors, LLC | 161.414 | 6,00 | 3.551 | 9,67 | ||||
| 2026-02-13 | 13F | Wells Fargo & Company/mn | 1.650.734 | 2,60 | 36.316 | 6,14 | ||||
| 2026-02-04 | 13F | Tsfg, Llc | 6.450 | 0,00 | 0 | |||||
| 2026-02-17 | 13F | Private Advisor Group, LLC | 38.284 | 1,11 | 842 | 4,60 | ||||
| 2026-04-17 | 13F | BCS Wealth Management | 27.349 | -50,00 | 608 | -49,46 | ||||
| 2026-02-17 | 13F | Cetera Investment Advisers | 115.580 | -0,83 | 2.543 | 2,58 | ||||
| 2026-01-23 | 13F | Assetmark, Inc | 12 | 0,00 | 0 | |||||
| 2026-01-29 | 13F | Camelot Portfolios, LLC | 1.500 | 33 | ||||||
| 2026-01-30 | 13F | Us Bancorp \de\ | 2.647 | 5,71 | 58 | 9,43 | ||||
| 2026-02-17 | 13F | Qube Research & Technologies Ltd | 21 | 0,00 | 0 | |||||
| 2026-04-24 | 13F | Wagner Wealth Management, Llc | 922 | 0,88 | 21 | 0,00 | ||||
| 2026-01-22 | 13F | Bartlett & Co. Wealth Management Llc | 212 | 0,00 | 5 | 0,00 | ||||
| 2026-04-22 | 13F | SFG Wealth Management, LLC. | 0 | -100,00 | 0 | |||||
| 2026-01-29 | 13F | UBS Group AG | 886.941 | -4,59 | 19.513 | -1,30 | ||||
| 2026-04-15 | 13F | Signature Estate & Investment Advisors Llc | 11.260 | 8,88 | 250 | 10,13 | ||||
| 2026-02-13 | 13F | Visionary Wealth Advisors | 13.674 | 0,00 | 301 | 3,45 | ||||
| 2026-04-20 | 13F | Breakwater Capital Group | 40.981 | 1,20 | 912 | 2,36 | ||||
| 2026-04-20 | 13F | Riverchase Wealth Management, Llc | 9.362 | 0,00 | 208 | 1,46 | ||||
| 2026-02-17 | 13F | Blair William & Co/il | 4.560 | 0,00 | 100 | 4,17 | ||||
| 2026-02-02 | 13F | Cornerstone Planning Group LLC | 20.538 | 0,00 | 468 | 7,09 | ||||
| 2026-04-20 | 13F | Brian Low Financial Group, Llc | 99.068 | 7,57 | 2.204 | 8,74 | ||||
| 2026-02-13 | 13F | Bluedoor Private Wealth, Llc | 20.466 | 450 | ||||||
| 2026-02-18 | 13F | GWM Advisors LLC | 63.005 | -7,11 | 1.386 | -3,88 | ||||
| 2026-04-22 | 13F | Parcion Private Wealth LLC | 54.594 | 0,50 | 1.214 | 1,59 | ||||
| 2026-01-20 | 13F | Stratos Wealth Partners, LTD. | 58.542 | 14,29 | 1.288 | 18,18 | ||||
| 2026-02-13 | 13F | Integrity Financial Corp /WA | 0 | -100,00 | 0 | |||||
| 2026-04-09 | 13F | DHJJ Financial Advisors, Ltd. | 36 | 0,00 | 1 | |||||
| 2026-02-12 | 13F | Commonwealth Equity Services, Llc | 229.903 | 2,72 | 5.058 | 126.325,00 | ||||
| 2026-02-09 | 13F | Keating Financial Advisory Services, Inc. | 14.525 | 320 | ||||||
| 2026-02-06 | 13F | Flynn Zito Capital Management, Llc | 12.416 | 0,53 | 273 | 4,20 | ||||
| 2026-02-13 | 13F | Mml Investors Services, Llc | 61.611 | 24,17 | 1.355 | 28,44 | ||||
| 2026-02-13 | 13F | Cynosure Management, Llc | 24.523 | 0,00 | 540 | 3,45 | ||||
| 2026-02-13 | 13F | Kestra Advisory Services, LLC | 0 | -100,00 | 0 | |||||
| 2026-02-17 | 13F | Bank Of America Corp /de/ | 925.299 | 1,03 | 20.357 | 4,51 | ||||
| 2026-02-06 | 13F | Global Retirement Partners, LLC | 1.989 | 0,15 | 44 | 2,38 | ||||
| 2026-02-18 | 13F | Financial Advisory Service, Inc. | 1.009 | 0,50 | 22 | 4,76 | ||||
| 2026-04-08 | 13F | Wealth Enhancement Advisory Services, Llc | 177.755 | -2,05 | 3.989 | -0,60 | ||||
| 2026-01-21 | 13F | Signature Resources Capital Management, LLC | 65 | 0,00 | 1 | 0,00 | ||||
| 2026-02-11 | 13F | Cerity Partners LLC | 45.198 | 0,15 | 994 | 3,65 | ||||
| 2026-02-18 | 13F | Beacon Pointe Advisors, LLC | 15.346 | 0,00 | 338 | 3,37 | ||||
| 2026-02-12 | 13F | Federation des caisses Desjardins du Quebec | 16.379 | 3,15 | 360 | 6,82 | ||||
| 2026-04-21 | 13F | GHP Investment Advisors, Inc. | 1.748 | 0,87 | 39 | 0,00 | ||||
| 2026-02-13 | 13F | MAI Capital Management | 1.582 | 0,00 | 35 | 3,03 | ||||
| 2026-02-13 | 13F | National Bank Of Canada /fi/ | 8.408 | 406,51 | 185 | 425,71 | ||||
| 2026-04-22 | 13F | Janney Montgomery Scott LLC | 18.014 | 6,46 | 0 | |||||
| 2026-04-14 | 13F | Southland Equity Partners LLC | 53.815 | -1,97 | 1.197 | -0,83 | ||||
| 2026-04-07 | 13F | CoreCap Advisors, LLC | 131 | 0,00 | 3 | 0,00 | ||||
| 2026-02-13 | 13F | Truvestments Capital Llc | 0 | -100,00 | 0 | |||||
| 2026-04-06 | 13F | CX Institutional | 8.073 | -20,11 | 0 | |||||
| 2026-02-04 | 13F | Ameritas Advisory Services, LLC | 0 | -100,00 | 0 | |||||
| 2026-01-26 | 13F | Private Trust Co Na | 713 | 0,00 | 16 | 0,00 | ||||
| 2026-02-17 | 13F | Modern Wealth Management, LLC | 946.146 | -8,38 | 20.815 | -5,23 | ||||
| 2026-02-05 | 13F | Alexander Randolph Advisory Inc | 25.267 | 0,02 | 556 | 3,35 | ||||
| 2025-11-14 | 13F | Tower Research Capital LLC (TRC) | 0 | -100,00 | 0 | |||||
| 2026-02-05 | 13F | Stephens Inc /ar/ | 18.588 | -7,03 | 409 | -4,00 | ||||
| 2026-02-11 | 13F | Coastwise Capital Group, LLC | 0 | -100,00 | 0 | |||||
| 2026-04-22 | 13F | Continuum Advisory, LLC | 105.651 | 0,18 | 2.350 | 1,29 | ||||
| 2026-02-13 | 13F | Mariner, LLC | 120.092 | -3,14 | 2.642 | 0,23 | ||||
| 2026-04-16 | 13F | Freedom Financial Partners LLC | 54.813 | 0,73 | 1.220 | 1,84 |