Grundlæggende statistik
| Institutionelle ejere | 209 total, 209 long only, 0 short only, 0 long/short - change of 6,63% MRQ |
| Gennemsnitlig porteføljeallokering | 0.3323 % - change of 27,01% MRQ |
| Institutionelle aktier (lange) | 33.540.287 (ex 13D/G) - change of 4,96MM shares 17,36% MRQ |
| Institutionel værdi (lang) | $ 581.928 USD ($1000) |
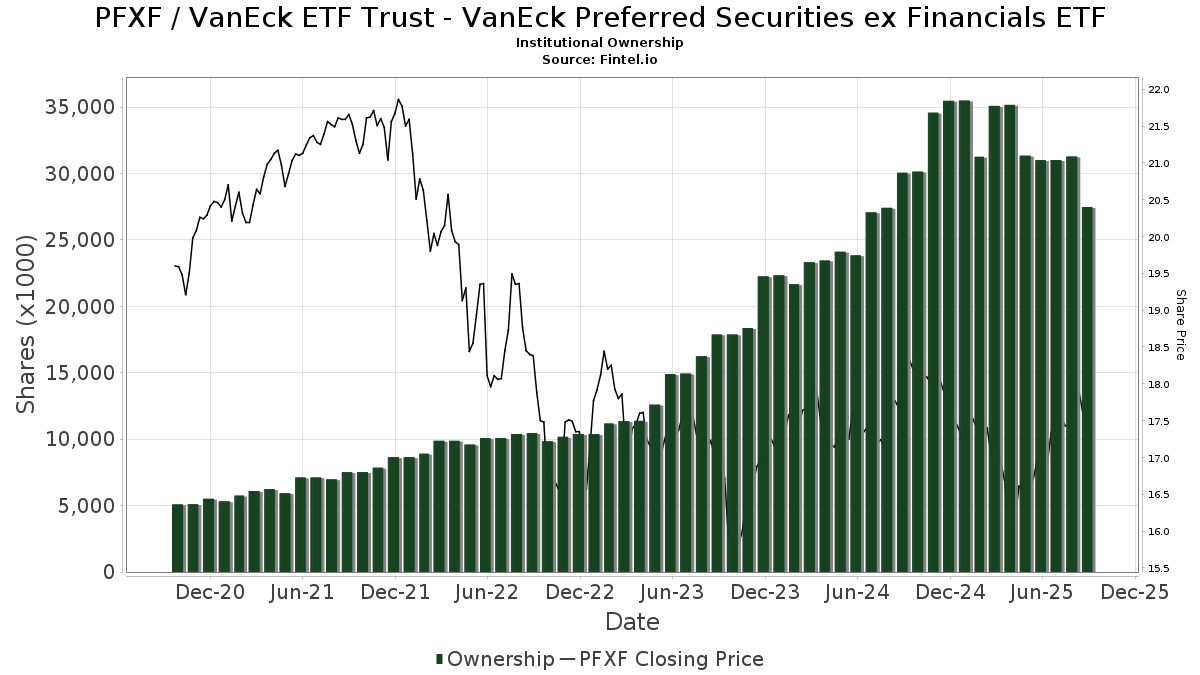
Institutionelt ejerskab og aktionærer
VanEck ETF Trust - VanEck Preferred Securities ex Financials ETF (US:PFXF) har 209 institutionelle ejere og aktionærer, der har indsendt 13D/G- eller 13F-formularer til Securities Exchange Commission (SEC). Disse institutioner har i alt 33,540,287 aktier. Største aktionærer omfatter Bank Of America Corp /de/, LPL Financial LLC, Morgan Stanley, Raymond James Financial Inc, Wells Fargo & Company/mn, Tanager Wealth Management LLP, State of Wisconsin - Board of Commissioners of Public Lands, Mml Investors Services, Llc, Tradewinds Capital Management, LLC, and UBS Group AG .
VanEck ETF Trust - VanEck Preferred Securities ex Financials ETF (ARCA:PFXF) institutionel ejerskabsstruktur viser aktuelle positioner i virksomheden efter institutioner og fonde, samt seneste ændringer i positionsstørrelse. Større aktionærer kan omfatte individuelle investorer, investeringsforeninger, hedgefonde eller institutioner. Skema 13D angiver, at investoren besidder (eller besidder) mere end 5 % af virksomheden og har til hensigt (eller har til hensigt at) aktivt at forfølge en ændring i forretningsstrategi. Skema 13G indikerer en passiv investering på over 5%.
The share price as of April 24, 2026 is 18,56 / share. Previously, on April 28, 2025, the share price was 16,55 / share. This represents an increase of 12,15% over that period.
Fondens stemningsscore
Fund Sentiment Score (fka Ownership Accumulation Score) finder de aktier, der bliver mest købt af fonde. Det er resultatet af en sofistikeret, multi-faktor kvantitativ model, der identificerer virksomheder med de højeste niveauer af institutionel akkumulering. Scoringsmodellen bruger en kombination af den samlede stigning i oplyste ejere, ændringerne i porteføljeallokeringer i disse ejere og andre målinger. Tallet går fra 0 til 100, hvor højere tal indikerer et højere niveau af akkumulering for sine jævnaldrende, og 50 er gennemsnittet.
Opdateringsfrekvens: Dagligt
Se Ownership Explorer, som giver en liste over højest rangerende virksomheder.
AI+ Ask Fintel’s AI assistant about VanEck ETF Trust - VanEck Preferred Securities ex Financials ETF.
Select a question to share a public post with an AI-crafted answer.
Thinking of good questions…
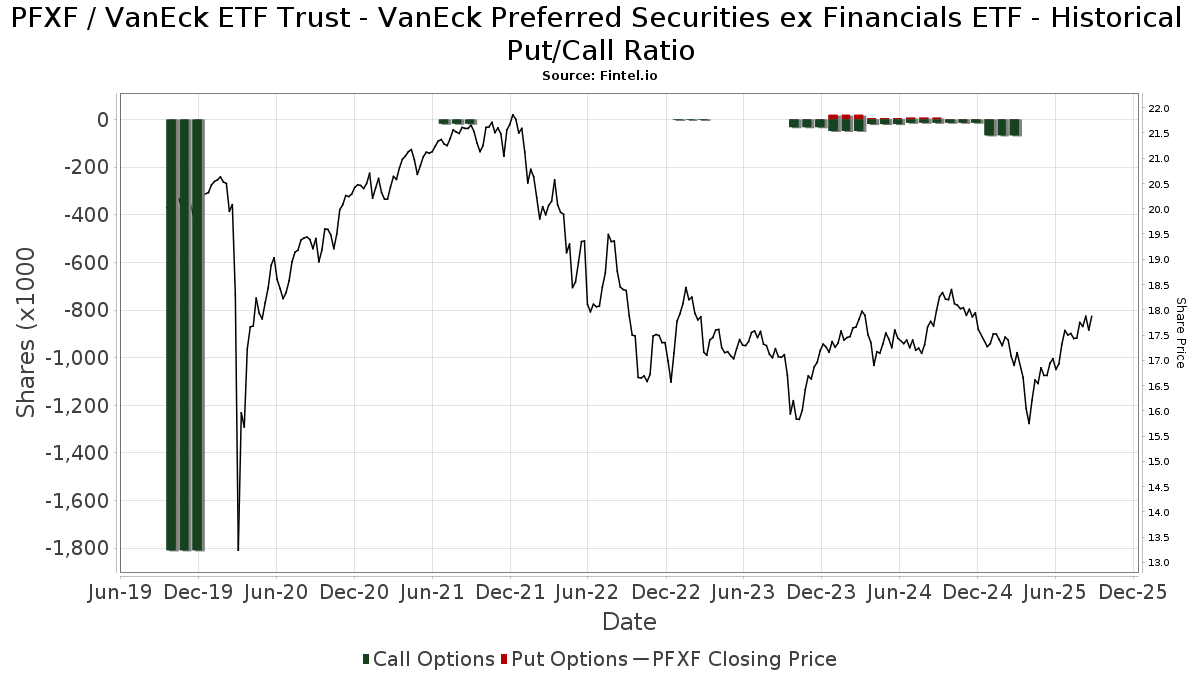
Institutionel Put/Call-forhold
Ud over at indberette standardaktie- og gældsudstedelser skal institutter med mere end 100 mill. aktiver under forvaltning også oplyse deres put- og call-optionsbeholdninger. Da salgsoptioner generelt indikerer negativ stemning, og købsoptioner indikerer positiv stemning, kan vi få en fornemmelse af den overordnede institutionelle stemning ved at plotte forholdet mellem put og kald. Diagrammet til højre viser det historiske put/call-forhold for dette instrument.
Brug af Put/Call Ratio som en indikator for investorernes stemning overvinder en af de vigtigste mangler ved at bruge totalt institutionelt ejerskab, som er, at en betydelig mængde af aktiver under forvaltning investeres passivt for at spore indekser. Passivt forvaltede fonde køber typisk ikke optioner, så indikatoren for put/call-forholdet følger mere nøje følelsen af aktivt forvaltede fonde.
13F og NPORT arkivering
Detaljer om 13F-arkivering er gratis. Detaljer om NP-ansøgninger kræver et premium-medlemskab. Grønne rækker angiver nye positioner. Røde rækker angiver lukkede positioner. Klik på linket ikon for at se den fulde transaktionshistorik.
Opgrader
for at låse premium-data op og eksportere til Excel ![]() .
.
| Fil dato | Kilde | Investor | Type | Gennemsnitlig pris (Øst) |
Aktier | Δ Aktier (%) |
Rapporteret Værdi ($1000) |
Δ Værdi (%) |
Port Alloc (%) |
|
|---|---|---|---|---|---|---|---|---|---|---|
| 2026-01-22 | 13F | Good Steward Wealth Advisors,LLC | 596.481 | 2,25 | 10.534 | 1,61 | ||||
| 2026-04-16 | 13F | Sheets Smith Wealth Management | 78.145 | 2,18 | 1.371 | 1,48 | ||||
| 2026-04-13 | 13F | Wolff Wiese Magana Llc | 735 | 0,00 | 13 | 0,00 | ||||
| 2026-02-13 | 13F | Wells Fargo & Company/mn | 1.738.163 | -0,88 | 30.696 | -1,49 | ||||
| 2026-04-15 | 13F | Wealth Intelligence, LLC | 544.001 | -12,71 | 9.542 | -13,31 | ||||
| 2026-04-24 | 13F | Goldstone Financial Group, LLC | 179.898 | 3.155 | ||||||
| 2026-02-12 | 13F | Sfam, Llc | 436 | 8 | ||||||
| 2026-01-28 | 13F | O'ROURKE & COMPANY, Inc | 11.461 | -2,53 | 202 | -2,88 | ||||
| 2026-01-29 | 13F | Comerica Bank | 16.989 | 0,00 | 300 | -0,33 | ||||
| 2026-01-27 | 13F | Plimoth Trust Co Llc | 30.651 | -12,30 | 541 | -12,88 | ||||
| 2026-01-23 | 13F | Sumitomo Mitsui Trust Holdings, Inc. | 48.196 | -65,89 | 851 | -66,10 | ||||
| 2026-04-24 | 13F | Vision Financial Markets Llc | 341 | 0,89 | 6 | 0,00 | ||||
| 2026-01-26 | 13F | AE Wealth Management LLC | 497 | -11,72 | 9 | -20,00 | ||||
| 2026-01-30 | 13F | Sigma Planning Corp | 121.770 | 11,95 | 2.163 | 11,96 | ||||
| 2026-02-17 | 13F | Private Advisor Group, LLC | 214.001 | 7,29 | 3.779 | 6,63 | ||||
| 2026-02-05 | 13F | Tucker Asset Management Llc | 100 | 0,00 | 2 | 0,00 | ||||
| 2026-02-17 | 13F | Advisor Group Holdings, Inc. | 327.101 | 7,99 | 5.777 | 7,82 | ||||
| 2026-02-10 | 13F | Texas Yale Capital Corp. | 18.476 | 2,28 | 326 | 1,56 | ||||
| 2026-01-29 | 13F | UBS Group AG | 615.097 | 193,15 | 10.863 | 191,36 | ||||
| 2026-04-10 | 13F | Marshall Financial Group LLC | 32.373 | -32,64 | 568 | -33,14 | ||||
| 2026-04-22 | 13F | Apollon Wealth Management, LLC | 14.566 | -5,14 | 255 | -5,90 | ||||
| 2026-02-12 | 13F | Renaissance Technologies Llc | 0 | -100,00 | 0 | |||||
| 2026-04-03 | 13F | Investors Research Corp | 294.161 | 8,11 | 5.160 | 7,37 | ||||
| 2026-02-05 | 13F | Atria Investments Llc | 81.117 | 5,32 | 1.433 | 4,68 | ||||
| 2026-02-06 | 13F | Advisory Alpha, LLC | 17.944 | 317 | ||||||
| 2026-04-21 | 13F | Diesslin Group, Inc. | 19.840 | 46,56 | 348 | 45,19 | ||||
| 2026-01-29 | 13F | Carmel Capital Partners, LLC | 373.248 | 32,97 | 6.592 | 32,14 | ||||
| 2026-02-12 | 13F | Federation des caisses Desjardins du Quebec | 250 | 0,00 | 4 | 0,00 | ||||
| 2026-02-13 | 13F | Motiv8 Investments LLC | 175 | 0 | ||||||
| 2026-02-09 | 13F | Delta Asset Management Llc/tn | 105 | 0,00 | 2 | 0,00 | ||||
| 2026-04-14 | 13F | Wealthcare Advisory Partners LLC | 218.685 | 2,71 | 3.836 | 1,99 | ||||
| 2026-01-29 | 13F | Sanctuary Advisors, LLC | 137.292 | 5,21 | 2.425 | 4,57 | ||||
| 2026-04-14 | 13F | West Branch Capital LLC | 679 | 0,74 | 12 | 0,00 | ||||
| 2026-04-16 | 13F | PMV Capital Advisers, LLC | 12 | 0 | ||||||
| 2026-02-09 | 13F | Harbour Investments, Inc. | 38.418 | 15,64 | 678 | 14,92 | ||||
| 2026-02-13 | 13F | MAI Capital Management | 8.090 | 0,00 | 143 | -0,70 | ||||
| 2026-04-22 | 13F | Janney Montgomery Scott LLC | 85.014 | 169,49 | 1 | |||||
| 2025-11-14 | 13F | L2 Asset Management, LLC | 0 | -100,00 | 0 | -100,00 | ||||
| 2026-04-20 | 13F | Apella Capital, LLC | 247.993 | -2,58 | 4.553 | 1,29 | ||||
| 2026-02-17 | 13F | Equitable Holdings, Inc. | 140.608 | 9,42 | 2.483 | 8,76 | ||||
| 2026-02-03 | 13F | Bokf, Na | 6.313 | 0,00 | 111 | -0,89 | ||||
| 2026-02-13 | 13F | Van Eck Associates Corp | 92 | -61,83 | 0 | |||||
| 2026-02-20 | 13F | Larch Capital Partners Llc | 167.160 | 2.952 | ||||||
| 2026-04-07 | 13F | Farther Finance Advisors, LLC | 48.042 | 8,74 | 844 | 8,21 | ||||
| 2026-02-17 | 13F | Guggenheim Capital Llc | 98.496 | 7,02 | 1.739 | 6,36 | ||||
| 2026-04-15 | 13F | Brendel Financial Advisors LLC | 0 | -100,00 | 0 | |||||
| 2026-02-17 | 13F | Captrust Financial Advisors | 35.961 | -3,73 | 635 | -4,22 | ||||
| 2026-02-10 | 13F | Redwood Financial Network Corp | 0 | -100,00 | 0 | |||||
| 2026-01-21 | 13F | Sound Income Strategies, LLC | 265.290 | -5,62 | 4.844 | -3,72 | ||||
| 2026-01-20 | 13F | Sovran Advisors, LLC | 15.452 | -6,45 | 284 | -3,08 | ||||
| 2026-02-13 | 13F | Kestra Advisory Services, LLC | 0 | -100,00 | 0 | |||||
| 2026-01-30 | 13F | Bogart Wealth, LLC | 529 | 0,00 | 9 | 0,00 | ||||
| 2026-04-16 | 13F | Capital Advisors, Ltd. LLC | 4.347 | 0,00 | 0 | |||||
| 2026-02-11 | 13F | Cerity Partners LLC | 17.800 | 0,00 | 314 | -0,63 | ||||
| 2026-01-29 | 13F | Northern Oak Wealth Management Inc | 16.018 | 0,00 | 283 | -0,70 | ||||
| 2026-02-06 | 13F | Cullen/frost Bankers, Inc. | 1.000 | 18 | ||||||
| 2026-02-05 | 13F | Thrivent Financial For Lutherans | 16.784 | -4,85 | 0 | |||||
| 2026-02-11 | 13F | Simplex Trading, Llc | 293 | 5 | ||||||
| 2026-02-13 | 13F | Level Four Advisory Services, Llc | 398.939 | 1,23 | 7.045 | 0,61 | ||||
| 2026-01-26 | 13F | Cwm, Llc | 4.000 | -31,50 | 0 | |||||
| 2026-04-02 | 13F | Cassady Wealth & Retirement Planning, LLC | 41.550 | 734 | ||||||
| 2026-04-17 | 13F | Signal Advisors Wealth, LLC | 19.576 | 343 | ||||||
| 2026-02-05 | 13F | AlphaCore Capital LLC | 17.374 | 28,62 | 307 | 27,50 | ||||
| 2026-02-05 | 13F | Staley Capital Advisers Inc | 10.000 | 0,00 | 177 | -0,56 | ||||
| 2026-02-11 | 13F | LPL Financial LLC | 2.961.370 | 8,53 | 52.298 | 7,86 | ||||
| 2026-02-03 | 13F | Emerald Investment Partners, Llc | 5.153 | 0,80 | 91 | 1,11 | ||||
| 2026-04-13 | 13F | Bank & Trust Co | 25.264 | 0,00 | 443 | -0,67 | ||||
| 2026-02-17 | 13F | Ameriprise Financial Inc | 189.431 | -0,43 | 3.345 | -0,83 | ||||
| 2026-02-17 | 13F | Jones Financial Companies Lllp | 227.258 | 10,42 | 4.013 | 9,08 | ||||
| 2026-04-20 | 13F | Sowell Financial Services LLC | 48.996 | 7,11 | 859 | 6,44 | ||||
| 2026-02-18 | 13F | GWM Advisors LLC | 53.921 | 3,61 | 952 | 3,03 | ||||
| 2026-04-10 | 13F | Perigon Wealth Management, LLC | 18.481 | -6,52 | 324 | -7,16 | ||||
| 2026-02-11 | 13F | Prudential Plc | 6.800 | 0,00 | 120 | 0,00 | ||||
| 2026-02-13 | 13F | Inspire Advisors, LLC | 59.310 | -3,02 | 1.047 | -3,59 | ||||
| 2026-02-13 | 13F | Fortis Capital Management LLC | 60.865 | -7,66 | 1.075 | -8,28 | ||||
| 2026-04-14 | 13F | Nbc Securities, Inc. | 3.597 | 22,56 | 63 | 23,53 | ||||
| 2026-02-13 | 13F | OpenArc Corporate Advisory, LLC | 24.180 | 427 | ||||||
| 2025-11-03 | 13F | Capstone Triton Financial Group, LLC | 0 | -100,00 | 0 | |||||
| 2026-01-29 | 13F | Howard Wealth Management, Llc | 86.317 | -5,57 | 1.524 | -6,16 | ||||
| 2026-02-17 | 13F | Citadel Advisors Llc | 69.307 | 1.224 | ||||||
| 2026-02-02 | 13F | Truist Financial Corp | 162.705 | -2,93 | 2.873 | -3,53 | ||||
| 2026-02-12 | 13F | First Wilshire Securities Management Inc | 0 | -100,00 | 0 | |||||
| 2026-02-05 | 13F | Allworth Financial LP | 4.376 | 50,22 | 77 | 50,98 | ||||
| 2026-04-02 | 13F | Aspect Partners, LLC | 500 | 0,00 | 9 | 0,00 | ||||
| 2026-01-16 | 13F | Wall Street Financial Group, Inc. | 18.821 | 19,36 | 332 | 18,57 | ||||
| 2026-02-13 | 13F | Colony Group, LLC | 28.700 | 161,91 | 507 | 160,82 | ||||
| 2026-02-06 | 13F | Van Hulzen Asset Management, LLC | 12.184 | 7,33 | 215 | 6,97 | ||||
| 2026-01-07 | 13F | Procyon Private Wealth Partners, LLC | 21.773 | 0,00 | 385 | -0,52 | ||||
| 2026-02-11 | 13F | Parallel Advisors, LLC | 903 | 0,00 | 16 | -6,25 | ||||
| 2026-01-22 | 13F | Bartlett & Co. Wealth Management Llc | 20.391 | -7,86 | 360 | -8,40 | ||||
| 2026-01-20 | 13F | Ntv Asset Management Llc | 157.985 | 4,22 | 2.790 | 3,60 | ||||
| 2026-02-02 | 13F | Mission Hills Financial Advisory, LLC | 11.406 | 7,05 | 201 | 6,35 | ||||
| 2026-04-06 | 13F | Stableford Capital Ii Llc | 21.836 | 58,27 | 383 | 57,61 | ||||
| 2026-04-08 | 13F | Wealth Enhancement Advisory Services, Llc | 114.952 | 0,48 | 2.024 | -1,89 | ||||
| 2026-02-10 | 13F | Lido Advisors, LLC | 115.891 | 0,00 | 2.059 | 0,00 | ||||
| 2026-02-17 | 13F | Advisory Services Network, LLC | 10.527 | 71,51 | 186 | 69,72 | ||||
| 2026-02-17 | 13F | Core Wealth Partners LLC | 10.685 | 0,00 | 189 | -0,53 | ||||
| 2026-01-29 | 13F | D.a. Davidson & Co. | 81.737 | 6,87 | 1.443 | 6,18 | ||||
| 2026-04-24 | 13F | Tcfg Wealth Management, Llc | 20.084 | 0,88 | 352 | 0,28 | ||||
| 2026-01-27 | 13F | Measured Risk Portfolios, Inc. | 132.806 | -2,75 | 2.345 | -3,34 | ||||
| 2026-02-10 | 13F/A | Northwestern Mutual Wealth Management Co | 208.125 | 9,21 | 3.675 | 8,54 | ||||
| 2026-02-12 | 13F | Ankerstar Wealth, LLC | 669 | 12 | ||||||
| 2026-04-17 | 13F | AdvisorNet Financial, Inc | 279 | 0,72 | 5 | 0,00 | ||||
| 2026-01-20 | 13F | Fundamentun, Llc | 53.097 | 3,98 | 938 | 3,31 | ||||
| 2025-11-06 | 13F | Liberty Square Wealth Partners Llc | 0 | -100,00 | 0 | |||||
| 2026-02-17 | 13F | Cetera Investment Advisers | 82.821 | -7,99 | 1.463 | -8,57 | ||||
| 2026-04-15 | 13F | Register Financial Advisors LLC | 10.538 | 0,00 | 185 | -1,08 | ||||
| 2026-04-20 | 13F | Tanager Wealth Management LLP | 1.587.632 | 9,56 | 27.847 | 8,82 | ||||
| 2026-01-26 | 13F | Key Capital Management, INC | 3 | 0 | ||||||
| 2026-02-12 | 13F | Summit Financial, LLC | 27.307 | -11,22 | 482 | -11,72 | ||||
| 2025-11-07 | 13F | Ballast, Inc. | 0 | -100,00 | 0 | -100,00 | ||||
| 2026-01-21 | 13F | Future Financial Wealth Managment LLC | 0 | -100,00 | 0 | |||||
| 2026-04-09 | 13F | DHJJ Financial Advisors, Ltd. | 0 | -100,00 | 0 | |||||
| 2026-02-17 | 13F | Qube Research & Technologies Ltd | 0 | -100,00 | 0 | |||||
| 2026-01-16 | 13F | Crowley Wealth Management, Inc. | 0 | -100,00 | 0 | |||||
| 2026-02-13 | 13F | Apriem Advisors | 21.000 | -7,49 | 371 | -8,19 | ||||
| 2026-04-15 | 13F | Wright Fund Managment, LLC | 0 | -100,00 | 0 | |||||
| 2026-04-21 | 13F | Pinnacle Associates Ltd | 0 | -100,00 | 0 | |||||
| 2026-02-13 | 13F | Mariner, LLC | 95.304 | -17,59 | 1.683 | -18,10 | ||||
| 2026-02-17 | 13F | Hyposwiss Advisors SA | 52.710 | 931 | ||||||
| 2026-04-14 | 13F | Tradewinds Capital Management, LLC | 631.540 | 11.077 | ||||||
| 2025-10-28 | 13F | Richardson Financial Services Inc. | 0 | -100,00 | 0 | -100,00 | ||||
| 2026-04-22 | 13F | MeadowBrook Investment Advisors LLC | 6.740 | 0,00 | 118 | -0,84 | ||||
| 2026-02-06 | 13F | GPS Wealth Strategies Group, LLC | 0 | -100,00 | 0 | |||||
| 2026-02-13 | 13F | Ausdal Financial Partners, Inc. | 32.366 | -6,20 | 572 | -6,85 | ||||
| 2026-01-20 | 13F | Wall Street Access Asset Management, LLC | 15.582 | 275 | ||||||
| 2025-11-12 | 13F | Orleans Capital Management Corp/la | 0 | -100,00 | 0 | -100,00 | ||||
| 2026-04-08 | 13F | Accel Wealth Management | 12.798 | 0,02 | 224 | -0,44 | ||||
| 2026-04-23 | 13F | Oppenheimer & Co Inc | 11.819 | -0,30 | 207 | -0,96 | ||||
| 2026-02-12 | 13F | Burke & Herbert Bank & Trust Co | 0 | -100,00 | 0 | |||||
| 2026-02-13 | 13F | Capital Square, LLC | 169.968 | 217,32 | 3.002 | 215,56 | ||||
| 2026-04-14 | 13F | Prospera Financial Services Inc | 11.134 | 0,27 | 195 | -0,51 | ||||
| 2026-04-23 | 13F | Pathway Financial Advisers, LLC | 15.258 | -9,92 | 268 | -10,70 | ||||
| 2026-01-28 | 13F | Joseph P. Lucia & Associates, LLC | 88.009 | -8,04 | 1.554 | -8,59 | ||||
| 2026-04-21 | 13F | Accredited Investor Services, Llc | 22.719 | 2,99 | 398 | 2,31 | ||||
| 2026-02-09 | 13F | Hartland & Co., LLC | 177 | 2,31 | 3 | 0,00 | ||||
| 2026-02-20 | 13F | Sunbelt Securities, Inc. | 16.851 | 3,06 | 298 | 2,41 | ||||
| 2026-01-21 | 13F | Flagship Harbor Advisors, Llc | 2.309 | 41 | ||||||
| 2026-02-13 | 13F | Balanced Rock Investment Advisor | 28.927 | 6,05 | 511 | 5,37 | ||||
| 2026-01-14 | 13F | Worth Asset Management, LLC | 0 | -100,00 | 0 | |||||
| 2026-02-13 | 13F | Ariadne Wealth Management, LP | 28.750 | 0,00 | 526 | 4,37 | ||||
| 2026-04-24 | 13F | Root Financial Partners, LLC | 2.310 | -1,58 | 41 | -2,44 | ||||
| 2026-04-22 | 13F | Silver Coast Investments LLC | 303.819 | 3,51 | 5.329 | 2,80 | ||||
| 2026-02-13 | 13F | Morgan Stanley | 2.541.327 | -1,51 | 44.880 | -2,12 | ||||
| 2026-02-10 | 13F | Tandem Financial, LLC | 32.423 | -24,37 | 559 | -26,54 | ||||
| 2025-11-05 | 13F | Howe & Rusling Inc | 0 | -100,00 | 0 | |||||
| 2026-02-17 | 13F | Bank Of America Corp /de/ | 4.645.730 | 12,20 | 82.044 | 11,50 | ||||
| 2026-01-28 | 13F | Chicago Partners Investment Group LLC | 102.047 | -5,01 | 1.884 | -2,54 | ||||
| 2026-02-06 | 13F | EverSource Wealth Advisors, LLC | 323 | -42,22 | 6 | -44,44 | ||||
| 2025-11-07 | 13F | Pnc Financial Services Group, Inc. | 0 | -100,00 | 0 | |||||
| 2026-01-27 | 13F | Fortitude Financial, LLC | 0 | -100,00 | 0 | |||||
| 2026-01-27 | 13F | Mainstay Capital Management Llc /adv | 12.670 | -5,43 | 224 | -6,30 | ||||
| 2026-02-10 | 13F | Castlekeep Investment Advisors Llc | 134.528 | 0,26 | 2.376 | -0,38 | ||||
| 2026-04-08 | 13F | High Point Wealth Management, LLC | 0 | -100,00 | 0 | |||||
| 2026-02-17 | 13F | Fmr Llc | 774 | -36,45 | 14 | -38,10 | ||||
| 2026-01-15 | 13F | MEMBERS Trust Co | 11.205 | 198 | ||||||
| 2026-04-22 | 13F | Princeton Global Asset Management LLC | 279 | 0,00 | 5 | 0,00 | ||||
| 2026-02-09 | 13F | Hantz Financial Services, Inc. | 493 | 0,00 | 0 | |||||
| 2026-04-23 | 13F | Powell Investment Advisors, LLC | 53.244 | 0,00 | 934 | -0,74 | ||||
| 2026-04-22 | 13F | Hofer & Associates. Inc | 14.349 | -2,23 | 252 | -3,09 | ||||
| 2026-04-22 | 13F | Coastal Investment Advisors, Inc. | 350 | 6 | ||||||
| 2026-04-08 | 13F | Sax Wealth Advisors, Llc | 75.622 | 0,00 | 1.335 | 0,00 | ||||
| 2026-02-09 | 13F | Integrity Alliance, Llc. | 84.629 | 2,18 | 1.495 | 1,56 | ||||
| 2026-02-09 | 13F | MSH Capital Advisors LLC | 100.676 | 13,82 | 1.778 | 13,11 | ||||
| 2026-01-21 | 13F | Capital Investment Advisory Services, LLC | 6.519 | 80,13 | 115 | 79,69 | ||||
| 2026-01-27 | 13F | Evergreen Capital Management Llc | 10.200 | 0,00 | 180 | -0,55 | ||||
| 2026-02-10 | 13F | Meramec Financial Planners, LLC | 1.928 | 35 | ||||||
| 2026-02-17 | 13F | Blair William & Co/il | 163.395 | -4,89 | 2.886 | -5,47 | ||||
| 2026-02-13 | 13F | Centaurus Financial, Inc. | 9.737 | 13,60 | 0 | |||||
| 2026-02-12 | 13F | Insigneo Advisory Services, Llc | 75.712 | 49,40 | 1.337 | 48,56 | ||||
| 2026-02-06 | 13F | Prevail Innovative Wealth Advisors, Llc | 79.064 | 1.396 | ||||||
| 2026-02-10 | 13F | Foundations Investment Advisors, LLC | 13.610 | -6,23 | 240 | -6,61 | ||||
| 2026-02-17 | 13F | Mpwm Advisory Solutions, Llc | 0 | -100,00 | 0 | |||||
| 2026-02-13 | 13F | SRS Capital Advisors, Inc. | 1.112 | 20 | ||||||
| 2026-03-09 | 13F | Lifetime Wealth Management P.C. | 77 | 1.437 | ||||||
| 2026-02-04 | 13F | Ameritas Advisory Services, LLC | 0 | -100,00 | 0 | -100,00 | ||||
| 2026-02-17 | 13F | Creative Planning | 106.569 | 21,33 | 1.882 | 20,64 | ||||
| 2026-02-09 | 13F | Cary Street Partners Financial Llc | 12.960 | 229 | ||||||
| 2026-02-17 | 13F | Raymond James Financial Inc | 1.847.906 | 4,77 | 32.634 | 4,12 | ||||
| 2026-02-03 | 13F | Sequoia Financial Advisors, LLC | 15.682 | 1,14 | 277 | 0,36 | ||||
| 2026-02-17 | 13F | Wiley Bros.-aintree Capital, Llc | 48.818 | 77,23 | 862 | 76,28 | ||||
| 2026-01-16 | 13F | Beaumont Financial Advisors, LLC | 27.413 | 1,05 | 484 | 0,41 | ||||
| 2026-02-10 | 13F | Acorn Wealth Advisors, LLC | 14.201 | -0,89 | 251 | -1,57 | ||||
| 2026-04-20 | 13F | Guild Investment Management, Inc. | 89.260 | 100,00 | 1.566 | 98,60 | ||||
| 2026-02-13 | 13F | Stifel Financial Corp | 83.693 | 0,60 | 1.478 | 0,00 | ||||
| 2026-02-04 | 13F | Pensionmark Financial Group, Llc | 17.635 | 7,04 | 311 | 6,51 | ||||
| 2026-01-26 | 13F | Private Trust Co Na | 15.363 | -1,21 | 271 | -1,81 | ||||
| 2026-01-26 | 13F | Roman Butler Fullerton & Co | 50.248 | 22,05 | 928 | 26,09 | ||||
| 2026-02-17 | 13F | Royal Bank Of Canada | 328.163 | 1,76 | 5.796 | 1,13 | ||||
| 2025-11-07 | 13F | Beacon Capital Management, LLC | 0 | -100,00 | 0 | |||||
| 2026-02-06 | 13F | Global Retirement Partners, LLC | 15.827 | 173,02 | 280 | 170,87 | ||||
| 2026-04-23 | 13F | Etesian Wealth Advisors, Inc. | 54.449 | 0,32 | 955 | -0,31 | ||||
| 2026-01-26 | 13F | Mirae Asset Global Investments Co., Ltd. | 46.655 | 26,09 | 824 | 25,27 | ||||
| 2026-01-28 | 13F | Geneos Wealth Management Inc. | 66.694 | -4,23 | 1.178 | -4,85 | ||||
| 2026-01-21 | 13F | Tandem Investment Partners LLC | 21.990 | 12,68 | 388 | 12,14 | ||||
| 2026-02-11 | 13F | Franklin Resources Inc | 60 | 0,00 | 1 | 0,00 | ||||
| 2026-02-12 | 13F | Commonwealth Equity Services, Llc | 468.030 | -4,31 | 8.265 | 103.212,50 | ||||
| 2026-02-12 | 13F | Steward Partners Investment Advisory, Llc | 275.973 | 0,08 | 4.874 | -0,53 | ||||
| 2026-02-12 | 13F | Kovack Advisors, Inc. | 10.797 | 0,00 | 191 | 0,00 | ||||
| 2026-04-13 | 13F | IFP Advisors, Inc | 22.645 | -6,67 | 397 | -7,24 | ||||
| 2025-11-13 | 13F | Quadrature Capital Ltd | 0 | -100,00 | 0 | |||||
| 2026-01-29 | 13F | Concurrent Investment Advisors, LLC | 335.329 | 0,62 | 5.922 | -0,02 | ||||
| 2026-02-17 | 13F | Susquehanna International Group, Llp | 18.278 | -78,09 | 323 | -78,27 | ||||
| 2026-04-01 | 13F | Signature Wealth Management Group | 82.466 | 4,32 | 1.446 | 3,58 | ||||
| 2026-04-03 | 13F | Hickory Point Bank & Trust | 671 | 12 | ||||||
| 2026-04-13 | 13F | Garrett Investment Advisors LLC | 14.899 | 261 | ||||||
| 2026-04-21 | 13F | Creekside Partners | 12.249 | -0,11 | 215 | -0,93 | ||||
| 2025-11-14 | 13F | Hrt Financial Lp | 0 | -100,00 | 0 | |||||
| 2026-04-07 | 13F | Park Avenue Securities Llc | 295.801 | -19,42 | 5 | -16,67 | ||||
| 2026-02-13 | 13F | Change Path, LLC | 0 | -100,00 | 0 | |||||
| 2026-02-13 | 13F | Mml Investors Services, Llc | 1.471.878 | 6,71 | 25.993 | 6,05 | ||||
| 2026-02-14 | 13F | Rockefeller Capital Management L.P. | 157.681 | 128,82 | 2.785 | 127,53 | ||||
| 2026-02-02 | 13F | Avidian Wealth Solutions, LLC | 86.976 | 0,65 | 1.536 | 0,00 | ||||
| 2026-02-03 | 13F | International Assets Investment Management, Llc | 2.130 | 38 | ||||||
| 2026-03-04 | 13F | AG Campbell Advisory, LLC | 50 | 1 | ||||||
| 2026-02-11 | 13F | Jpmorgan Chase & Co | 217 | -92,61 | 4 | -94,23 | ||||
| 2026-02-05 | 13F | Cambridge Investment Research Advisors, Inc. | 204.822 | 6,00 | 4 | 0,00 | ||||
| 2026-02-10 | 13F | Bnp Paribas Arbitrage, Sa | 58 | -15,94 | 1 | 0,00 | ||||
| 2026-02-13 | 13F | Resources Investment Advisors, LLC. | 100.731 | 379,10 | 1.779 | 376,68 | ||||
| 2026-02-06 | 13F | HighTower Advisors, LLC | 76.057 | 42,54 | 1.343 | 41,67 | ||||
| 2026-01-20 | 13F | Stratos Wealth Partners, LTD. | 23.916 | 1,97 | 422 | 1,44 | ||||
| 2025-11-12 | 13F | Cresset Asset Management, LLC | 25.580 | 0,00 | 455 | 3,89 | ||||
| 2026-04-22 | 13F | Samalin Investment Counsel, LLC | 18.309 | -15,84 | 321 | -16,41 | ||||
| 2026-04-14 | 13F | Patriot Investment Management Inc. | 0 | -100,00 | 0 | |||||
| 2026-01-22 | 13F | Harwood Advisory Group, LLC | 5.234 | 2,47 | 92 | 2,22 | ||||
| 2026-04-22 | 13F | Spire Wealth Management | 2 | 0 | ||||||
| 2026-02-05 | 13F | State of Wisconsin - Board of Commissioners of Public Lands | 1.525.220 | 0,00 | 26.935 | -0,62 | ||||
| 2025-10-28 | 13F | Gould Asset Management Llc /ca/ | 0 | -100,00 | 0 | |||||
| 2026-04-10 | 13F | AssuredPartners Investment Advisors, LLC | 139.754 | -0,64 | 2.467 | -0,68 | ||||
| 2026-04-17 | 13F | Mezzasalma Advisors, LLC | 14.085 | -87,27 | 247 | -87,51 | ||||
| 2026-04-21 | 13F | Dougherty & Associates, LLC | 512.478 | 6,41 | 8.989 | 5,68 | ||||
| 2026-04-22 | 13F | Pinnacle Bancorp, Inc. | 292 | 0,69 | 5 | 0,00 | ||||
| 2026-04-20 | 13F | Godsey & Gibb Associates | 2.318 | 0,00 | 41 | 0,00 | ||||
| 2026-02-12 | 13F | Proficio Capital Partners LLC | 51.995 | 918 | ||||||
| 2026-01-07 | 13F | Massmutual Trust Co Fsb/adv | 0 | -100,00 | 0 | |||||
| 2026-02-13 | 13F | Citigroup Inc | 176 | -98,24 | 3 | -98,31 | ||||
| 2026-02-13 | 13F | Wealth Alliance | 40.816 | 0,22 | 721 | -0,41 | ||||
| 2026-02-10 | 13F | Envestnet Asset Management Inc | 564.774 | 4,35 | 9.974 | 3,70 | ||||
| 2026-01-15 | 13F | Delta Capital Management Llc | 36.950 | 0,00 | 1 | |||||
| 2026-02-12 | 13F | Jane Street Group, Llc | 13.777 | 243 | ||||||
| 2026-04-15 | 13F | Meridian Financial Partners LLC | 107.529 | 21,18 | 1.896 | 15,97 | ||||
| 2026-02-09 | 13F | Coldstream Capital Management Inc | 16.537 | 33,97 | 292 | 33,33 |