Grundlæggende statistik
| Institutionelle aktier (lange) | 70.065.739 - 104,19% (ex 13D/G) - change of -25,41MM shares -26,62% MRQ |
| Institutionel værdi (lang) | $ 10.436.980 USD ($1000) |
Institutionelt ejerskab og aktionærer
MKS Inc. (US:MKSI) har 522 institutionelle ejere og aktionærer, der har indsendt 13D/G- eller 13F-formularer til Securities Exchange Commission (SEC). Disse institutioner har i alt 70,065,739 aktier. Største aktionærer omfatter Vanguard Group Inc, BlackRock, Inc., Invesco Ltd., Capital International Investors, Fmr Llc, Price T Rowe Associates Inc /md/, Victory Capital Management Inc, Wellington Management Group Llp, State Street Corp, and Jpmorgan Chase & Co .
MKS Inc. (NasdaqGS:MKSI) institutionel ejerskabsstruktur viser aktuelle positioner i virksomheden efter institutioner og fonde, samt seneste ændringer i positionsstørrelse. Større aktionærer kan omfatte individuelle investorer, investeringsforeninger, hedgefonde eller institutioner. Skema 13D angiver, at investoren besidder (eller besidder) mere end 5 % af virksomheden og har til hensigt (eller har til hensigt at) aktivt at forfølge en ændring i forretningsstrategi. Skema 13G indikerer en passiv investering på over 5%.
The share price as of April 2, 2026 is 234,66 / share. Previously, on April 7, 2025, the share price was 62,99 / share. This represents an increase of 272,54% over that period.

Fondens stemningsscore
Fund Sentiment Score (fka Ownership Accumulation Score) finder de aktier, der bliver mest købt af fonde. Det er resultatet af en sofistikeret, multi-faktor kvantitativ model, der identificerer virksomheder med de højeste niveauer af institutionel akkumulering. Scoringsmodellen bruger en kombination af den samlede stigning i oplyste ejere, ændringerne i porteføljeallokeringer i disse ejere og andre målinger. Tallet går fra 0 til 100, hvor højere tal indikerer et højere niveau af akkumulering for sine jævnaldrende, og 50 er gennemsnittet.
Opdateringsfrekvens: Dagligt
Se Ownership Explorer, som giver en liste over højest rangerende virksomheder.
AI+ Ask Fintel’s AI assistant about MKS Inc..
Select a question to share a public post with an AI-crafted answer.
Thinking of good questions…
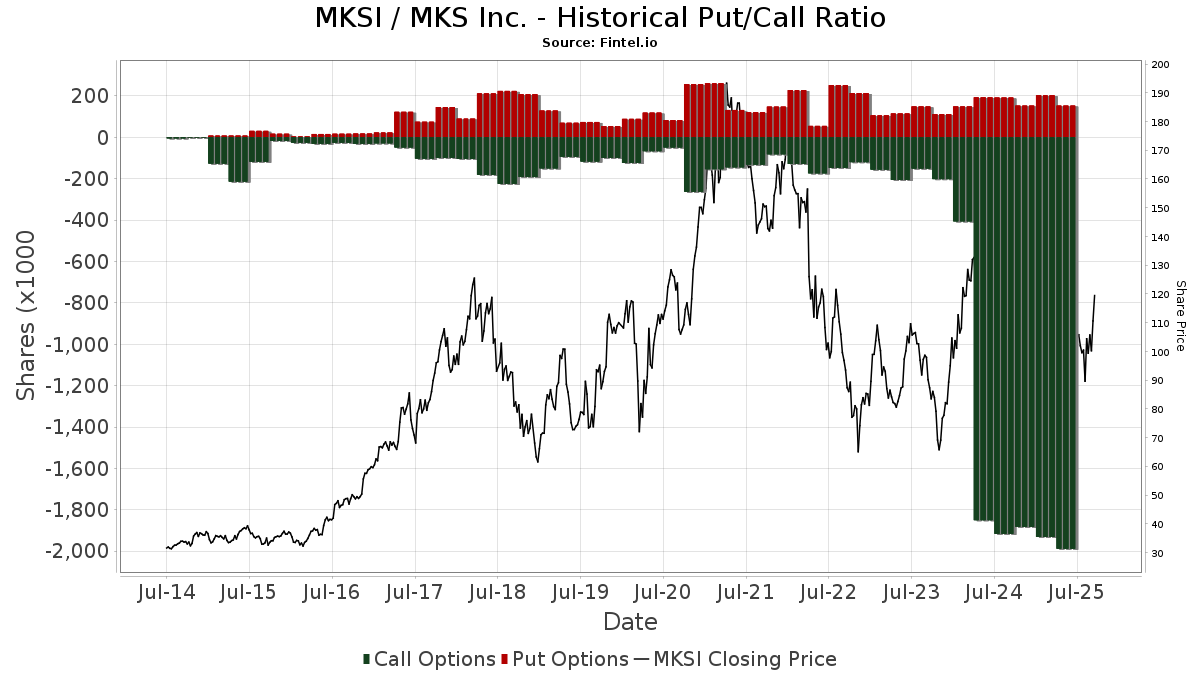
Institutionel Put/Call-forhold
Ud over at indberette standardaktie- og gældsudstedelser skal institutter med mere end 100 mill. aktiver under forvaltning også oplyse deres put- og call-optionsbeholdninger. Da salgsoptioner generelt indikerer negativ stemning, og købsoptioner indikerer positiv stemning, kan vi få en fornemmelse af den overordnede institutionelle stemning ved at plotte forholdet mellem put og kald. Diagrammet til højre viser det historiske put/call-forhold for dette instrument.
Brug af Put/Call Ratio som en indikator for investorernes stemning overvinder en af de vigtigste mangler ved at bruge totalt institutionelt ejerskab, som er, at en betydelig mængde af aktiver under forvaltning investeres passivt for at spore indekser. Passivt forvaltede fonde køber typisk ikke optioner, så indikatoren for put/call-forholdet følger mere nøje følelsen af aktivt forvaltede fonde.
13D/G-arkivering
Vi præsenterer 13D/G ansøgninger separat fra 13F ansøgninger på grund af den forskellige behandling af SEC. 13D/G-ansøgninger kan indgives af grupper af investorer (med én ledende), hvorimod 13F-ansøgninger ikke kan. Dette resulterer i situationer, hvor en investor kan indsende en 13D/G, der rapporterer én værdi for de samlede aktier (der repræsenterer alle de aktier, der ejes af investorgruppen), men derefter indsender en 13F, der rapporterer en anden værdi for de samlede aktier (der udelukkende repræsenterer deres egne) ejendomsret). Det betyder, at aktieejerskab af 13D/G-arkiver og 13F-arkiveringer ofte ikke er direkte sammenlignelige, så vi præsenterer dem separat.
Bemærk: Fra den 16. maj 2021 viser vi ikke længere ejere, der ikke har indsendt en 13D/G inden for det seneste år. Tidligere viste vi den fulde historie af 13D/G-arkiver. Generelt skal enheder, der er forpligtet til at indgive 13D/G-ansøgninger, indgive mindst årligt, før de indsender en afsluttende ansøgning. Dog forlader fonde nogle gange positioner uden at indsende en afsluttende ansøgning (dvs. de afvikler), så visning af den fulde historie resulterede nogle gange i forvirring om det nuværende ejerskab. For at undgå forvirring viser vi nu kun 'aktuelle' ejere - det vil sige - ejere, der har anmeldt inden for det seneste år.
Upgrade to unlock premium data.
| Fil dato | Form | Investor | Forrige Aktier |
Seneste Aktier |
Δ Aktier (Procent) |
Ejendomsret (Procent) |
Δ Ejerskab (Procent) |
|
|---|---|---|---|---|---|---|---|---|
| 2026-02-17 | PRICE T ROWE ASSOCIATES INC /MD/ | 4,129,128 | 2,753,871 | -33.31 | 4.10 | -33.87 | ||
| 2026-02-12 | Invesco Ltd. | 4,394,205 | 6.50 | |||||
| 2025-10-31 | VANGUARD GROUP INC | 6,892,941 | 7,752,097 | 12.46 | 11.54 | 11.93 | ||
| 2025-10-17 | BlackRock, Inc. | 6,874,519 | 5,887,663 | -14.36 | 8.80 | -13.73 | ||
| 2025-08-08 | VICTORY CAPITAL MANAGEMENT INC | 4,490,779 | 3,787,201 | -15.67 | 5.64 | -15.95 |
13F og NPORT arkivering
Detaljer om 13F-arkivering er gratis. Detaljer om NP-ansøgninger kræver et premium-medlemskab. Grønne rækker angiver nye positioner. Røde rækker angiver lukkede positioner. Klik på linket ikon for at se den fulde transaktionshistorik.
Opgrader
for at låse premium-data op og eksportere til Excel ![]() .
.
| Fil dato | Kilde | Investor | Type | Gennemsnitlig pris (Øst) |
Aktier | Δ Aktier (%) |
Rapporteret Værdi ($1000) |
Δ Værdi (%) |
Port Alloc (%) |
|
|---|---|---|---|---|---|---|---|---|---|---|
| 2026-02-17 | 13F | Nomura Holdings Inc | 364.033 | -14,65 | 58.172 | 10,20 | ||||
| 2026-02-11 | 13F | Sunrise Financial Services, LLC | 20 | 3 | ||||||
| 2026-02-17 | 13F | Nomura Holdings Inc | Call | 66.800 | 10.675 | |||||
| 2026-02-09 | 13F | CBIZ Investment Advisory Services, LLC | 72 | 12 | ||||||
| 2026-02-13 | 13F | Kennedy Capital Management, Inc. | 144.139 | -15,98 | 23.033 | 8,48 | ||||
| 2026-02-02 | 13F | Bay Harbor Wealth Management, LLC | 6 | 50,00 | 1 | |||||
| 2026-01-07 | 13F | Massmutual Trust Co Fsb/adv | 898 | 6,90 | 144 | 38,83 | ||||
| 2026-02-17 | 13F | Wiley Bros.-aintree Capital, Llc | 11.860 | 6,47 | 1.895 | 37,42 | ||||
| 2026-02-03 | 13F | Coston, McIsaac & Partners | 239 | 0,00 | 0 | |||||
| 2026-02-11 | 13F | Los Angeles Capital Management Llc | 295 | 41 | ||||||
| 2026-01-28 | 13F | Klp Kapitalforvaltning As | 15.000 | 7,14 | 2.397 | 38,39 | ||||
| 2026-02-17 | 13F | Nomura Holdings Inc | Put | 66.800 | 10.675 | |||||
| 2026-02-12 | 13F | EAM Investors, LLC | 26.866 | 4.293 | ||||||
| 2026-02-12 | 13F | Commonwealth Equity Services, Llc | 6.535 | -13,06 | 1.044 | |||||
| 2026-02-17 | 13F | State Of Wisconsin Investment Board | 45.616 | 9,73 | 7.289 | 41,67 | ||||
| 2026-02-10 | 13F | Natixis Advisors, L.p. | 522.415 | 8,57 | 83 | 40,68 | ||||
| 2025-11-12 | 13F | Transce3nd, LLC | 0 | -100,00 | 0 | |||||
| 2026-02-05 | 13F | Elyxium Wealth, LLC | 44 | 7 | ||||||
| 2026-02-12 | 13F | Loomis Sayles & Co L P | 184.233 | -12,95 | 29.440 | 12,39 | ||||
| 2026-02-05 | 13F | Amalgamated Bank | 30.459 | -0,66 | 5 | 33,33 | ||||
| 2026-02-10 | 13F | Nomura Asset Management Co Ltd | 400 | 0,00 | 64 | 28,57 | ||||
| 2025-11-07 | 13F | Gsa Capital Partners Llp | 0 | -100,00 | 0 | |||||
| 2026-02-06 | 13F | Profund Advisors Llc | 5.016 | 3,29 | 802 | 33,28 | ||||
| 2026-02-12 | 13F | MetLife Investment Management, LLC | 32.820 | -4,92 | 5.245 | 22,75 | ||||
| 2026-02-24 | 13F/A | Pacer Advisors, Inc. | 10.691 | -10,96 | 1.708 | 14,94 | ||||
| 2026-02-02 | 13F | Equitable Trust Co | 11.752 | 10,27 | 1.878 | 42,30 | ||||
| 2026-02-13 | 13F | Baird Financial Group, Inc. | 2.203 | 352 | ||||||
| 2026-02-17 | 13F | Delaware Management Holdings, Inc. | 150.666 | 24.076 | ||||||
| 2026-01-27 | 13F | Deroy & Devereaux Private Investment Counsel Inc | 23.555 | 4 | ||||||
| 2026-02-17 | 13F | Quantedge Capital Pte Ltd | 4.000 | 639 | ||||||
| 2026-02-17 | 13F | Delta Global Management LP | 327.390 | 116,05 | 52.317 | 178,94 | ||||
| 2025-11-14 | 13F | WealthTrak Capital Management LLC | 0 | -100,00 | 0 | |||||
| 2026-01-20 | 13F | Harbor Capital Advisors, Inc. | 18.221 | -23,22 | 3 | 0,00 | ||||
| 2026-02-17 | 13F | Two Sigma Investments, Lp | 29.358 | 373,52 | 4.691 | 511,60 | ||||
| 2026-02-12 | 13F | California Public Employees Retirement System | 114.384 | -0,04 | 18.279 | 29,05 | ||||
| 2026-02-12 | 13F | Great Lakes Advisors, Llc | 12.538 | -29,58 | 2.004 | -9,08 | ||||
| 2025-11-14 | 13F | Point72 Asia (Singapore) Pte. Ltd. | 20.880 | 2.584 | ||||||
| 2026-02-10 | 13F | Impact Partnership Wealth, LLC | 4.784 | 764 | ||||||
| 2026-02-12 | 13F | Wealthspire Advisors, LLC | 0 | -100,00 | 0 | |||||
| 2026-02-12 | 13F | EntryPoint Capital, LLC | 1.449 | -52,86 | 232 | -39,21 | ||||
| 2026-02-12 | 13F | South Dakota Investment Council | 8.781 | 0,00 | 1 | 0,00 | ||||
| 2026-02-17 | 13F | Shelton Capital Management | 2.240 | -6,16 | 358 | 21,02 | ||||
| 2026-01-14 | 13F | USA Financial Portformulas Corp | 164 | 26 | ||||||
| 2026-02-12 | 13F | Swiss National Bank | 132.500 | 1,92 | 21.174 | 31,59 | ||||
| 2026-02-05 | 13F | Atria Investments Llc | 4.900 | -2,64 | 783 | 25,72 | ||||
| 2026-02-17 | 13F | Aqr Capital Management Llc | 196.662 | 15,69 | 31.427 | 50,44 | ||||
| 2026-02-13 | 13F | Quinn Opportunity Partners LLC | 4.410 | 0,00 | 705 | 29,17 | ||||
| 2026-02-13 | 13F | Pinnacle Wealth Planning Services, Inc. | 795 | 127 | ||||||
| 2026-01-28 | 13F | Kingswood Wealth Advisors, Llc | 2.779 | 444 | ||||||
| 2026-02-10 | 13F | Eurizon Capital SGR S.p.A. | 1.049 | 170 | ||||||
| 2026-02-11 | 13F | Capital International Investors | 3.239.230 | -0,47 | 517.629 | 28,50 | ||||
| 2026-02-11 | 13F | Jpmorgan Chase & Co | 1.551.443 | 133,44 | 247.921 | 201,40 | ||||
| 2026-02-17 | 13F | Point72 Asset Management, L.P. | 625.799 | -38,26 | 100.003 | -20,28 | ||||
| 2026-02-23 | 13F | Kera Capital Partners, Inc. | 2.292 | 540 | ||||||
| 2026-02-06 | 13F | Mizuho Markets Cayman LP | 175.000 | 27.965 | ||||||
| 2026-01-30 | 13F | Mitsubishi UFJ Trust & Banking Corp | 7.086 | -3,87 | 1.132 | 24,12 | ||||
| 2026-02-13 | 13F | Journey Strategic Wealth Llc | 6.452 | 0,03 | 1.031 | 29,20 | ||||
| 2025-11-06 | 13F | Abich Financial Wealth Management LLC | 527 | 2.008,00 | 65 | 3.150,00 | ||||
| 2026-02-05 | 13F | North Dakota State Investment Board | 2.358 | 377 | ||||||
| 2026-02-06 | 13F | Pinnbrook Capital Management Lp | 55.298 | 8.837 | ||||||
| 2026-02-11 | 13F | SOUTH STATE Corp | 1.022 | 0,00 | 163 | 29,37 | ||||
| 2026-01-13 | 13F | Value Holdings Management Co. Llc | 297.714 | 0,00 | 48 | 30,56 | ||||
| 2026-02-11 | 13F | Hughes Financial Services, LLC | 18 | -21,74 | 3 | -33,33 | ||||
| 2026-02-09 | 13F | Cooke & Bieler Lp | 966.703 | -26,87 | 154.479 | -5,58 | ||||
| 2026-01-14 | 13F | Romano Brothers And Company | 2.057 | 0,00 | 329 | 29,13 | ||||
| 2026-02-12 | 13F | Front Row Advisors LLC | 7.910 | 1,61 | 1.264 | 31,26 | ||||
| 2026-02-17 | 13F | Tudor Investment Corp Et Al | 104.482 | 16.696 | ||||||
| 2026-02-17 | 13F | Tudor Investment Corp Et Al | Call | 7.300 | 1.167 | |||||
| 2025-11-07 | 13F | Shell Asset Management Co | 876 | -60,36 | 0 | |||||
| 2026-02-17 | 13F | Woodline Partners LP | 0 | -100,00 | 0 | |||||
| 2026-02-12 | 13F | ROSS\JOHNSON & Associates LLC | 1 | 0 | ||||||
| 2026-02-11 | 13F | United Financial Planning Group LLC | 10 | 2 | ||||||
| 2026-02-12 | 13F | Andra AP-fonden | 0 | -100,00 | 0 | |||||
| 2026-02-13 | 13F | Verition Fund Management LLC | 3.590 | -39,18 | 574 | -21,51 | ||||
| 2026-02-17 | 13F | Northern Trust Corp | 565.986 | -4,38 | 90.445 | 23,46 | ||||
| 2026-02-13 | 13F | Acumen Wealth Advisors, LLC | 37 | 6 | ||||||
| 2026-02-17 | 13F | Citadel Advisors Llc | 457.873 | 224,37 | 73.168 | 318,80 | ||||
| 2026-02-17 | 13F | Citadel Advisors Llc | Put | 43.800 | 53,68 | 6.999 | 98,44 | |||
| 2026-02-17 | 13F | Citadel Advisors Llc | Call | 44.800 | -19,71 | 7.159 | 3,66 | |||
| 2026-01-26 | 13F | Cwm, Llc | 7.693 | 15,01 | 1 | |||||
| 2026-02-09 | 13F | New Age Alpha Advisors, LLC | 14.639 | 1.020,90 | 2.339 | 1.352,80 | ||||
| 2026-01-20 | 13F | Signaturefd, Llc | 2.262 | 0,71 | 361 | 30,32 | ||||
| 2026-02-13 | 13F | University Of Texas/texas Am Investment Managment Co | 275 | 0,00 | 44 | 26,47 | ||||
| 2026-02-10 | 13F | Baker Avenue Asset Management, LP | 2.323 | 23,70 | 371 | 59,91 | ||||
| 2025-11-14 | 13F | Strategic Wealth Partners, Ltd. | 21 | 0,00 | 3 | 0,00 | ||||
| 2026-02-11 | 13F | Westfield Capital Management Co Lp | 839.773 | 159,70 | 134.196 | 235,30 | ||||
| 2026-02-17 | 13F | Bayesian Capital Management, LP | 0 | -100,00 | 0 | |||||
| 2026-02-12 | 13F | Quadrant Capital Group Llc | 4.335 | 1,29 | 693 | 30,81 | ||||
| 2026-02-17 | 13F | Advisory Services Network, LLC | 0 | -100,00 | 0 | |||||
| 2026-03-12 | 13F/A | Peak6 Llc | 0 | -100,00 | 0 | -100,00 | ||||
| 2026-01-21 | 13F | Greenleaf Trust | 2.634 | 30,46 | 421 | 68,67 | ||||
| 2026-02-13 | 13F | Cornerstone Financial Management LLC | 29 | 5 | ||||||
| 2026-02-13 | 13F | Financial Network Wealth Advisors LLC | 29 | 0,00 | 5 | 33,33 | ||||
| 2026-02-13 | 13F | Sei Investments Co | 126.058 | 12,38 | 20.145 | 45,10 | ||||
| 2026-02-17 | 13F | Wellington Management Group Llp | 2.552.021 | -15,32 | 407.813 | 9,33 | ||||
| 2026-02-09 | 13F | Keating Financial Advisory Services, Inc. | 51 | 8 | ||||||
| 2026-02-05 | 13F | Gamco Investors, Inc. Et Al | 3.885 | -50,73 | 621 | -36,41 | ||||
| 2026-02-17 | 13F | Readystate Asset Management Lp | 0 | -100,00 | 0 | |||||
| 2026-02-13 | 13F | First National Bank Of Omaha | 12.475 | -7,41 | 1.994 | 19,56 | ||||
| 2026-02-12 | 13F | Hollencrest Capital Management | 1.426 | 228 | ||||||
| 2026-03-13 | 13F/A | Pensionmark Financial Group, Llc | 1.319 | -18,48 | 211 | 5,00 | ||||
| 2026-02-13 | 13F | Victory Capital Management Inc | 2.562.399 | -28,47 | 409.471 | -7,65 | ||||
| 2026-02-06 | 13F | Covestor Ltd | 390 | 14,71 | 0 | |||||
| 2026-01-27 | 13F | Zurcher Kantonalbank (Zurich Cantonalbank) | 20.759 | 3.317 | ||||||
| 2026-02-13 | 13F | Ieq Capital, Llc | 11.907 | -38,21 | 1.903 | -20,25 | ||||
| 2026-02-02 | 13F | Qrg Capital Management, Inc. | 4.501 | 12,58 | 719 | 45,55 | ||||
| 2026-02-17 | 13F | North Capital, Inc. | 0 | -100,00 | 0 | |||||
| 2026-02-17 | 13F | Polar Capital Holdings Plc | 143.498 | -0,78 | 22.931 | 28,10 | ||||
| 2026-02-13 | 13F | Prudential Financial Inc | 24.077 | -45,46 | 3.848 | -29,58 | ||||
| 2026-02-10 | 13F | Bruce G. Allen Investments, LLC | 21 | 0,00 | 3 | 50,00 | ||||
| 2026-02-13 | 13F | Entropy Technologies, LP | 6.991 | 1.117 | ||||||
| 2026-02-04 | 13F | Securian Asset Management, Inc | 4.889 | -2,00 | 781 | 26,58 | ||||
| 2026-02-26 | 13F/A | Alpine Global Management, LLC | 4.000 | 639 | ||||||
| 2026-02-06 | 13F | Mizuho Markets Americas Llc | 56.281 | -81,54 | 8.994 | -76,16 | ||||
| 2026-02-11 | 13F | J.w. Cole Advisors, Inc. | 0 | -100,00 | 0 | |||||
| 2026-02-13 | 13F | Wells Fargo & Company/mn | 391.182 | 9,06 | 62.511 | 40,81 | ||||
| 2026-01-28 | 13F | Chicago Partners Investment Group LLC | 2.154 | 23,16 | 468 | 90,61 | ||||
| 2026-01-28 | 13F | WPG Advisers, LLC | 12 | -25,00 | 2 | 0,00 | ||||
| 2026-02-18 | 13F/A | Empowered Funds, LLC | 3.699 | -10,26 | 591 | 15,88 | ||||
| 2026-01-30 | 13F | Oakworth Capital, Inc. | 0 | -100,00 | 0 | |||||
| 2026-01-27 | 13F | Optas, LLC | 1.319 | 211 | ||||||
| 2026-02-10 | 13F | Commonwealth Of Pennsylvania Public School Empls Retrmt Sys | 16.808 | -2,48 | 2.686 | 25,88 | ||||
| 2026-01-07 | 13F | Retirement Wealth Solutions LLC | 20 | 0,00 | 3 | 50,00 | ||||
| 2026-02-17 | 13F | RMB Capital Management, LLC | 26.641 | -6,42 | 4.257 | 20,83 | ||||
| 2026-02-13 | 13F | Blue Grotto Capital, LLC | 415.500 | 96,13 | 66.397 | 153,23 | ||||
| 2026-02-13 | 13F | Panagora Asset Management Inc | 1.450 | 232 | ||||||
| 2026-02-13 | 13F | Brown Advisory Inc | 3.428 | 548 | ||||||
| 2026-01-21 | 13F | Yousif Capital Management, Llc | 20.815 | -1,44 | 4.385 | 67,71 | ||||
| 2026-02-17 | 13F | Millennium Management Llc | 817.251 | 83,14 | 130.597 | 136,45 | ||||
| 2026-01-08 | 13F | Versant Capital Management, Inc | 1.522 | 30,98 | 243 | 69,93 | ||||
| 2026-01-29 | 13F | Dunhill Financial, LLC | 1 | 0 | ||||||
| 2026-01-23 | 13F | Burney Co/ | 1.270 | 203 | ||||||
| 2026-01-27 | 13F | Brighton Jones Llc | 0 | -100,00 | 0 | |||||
| 2026-01-22 | 13F | Venturi Wealth Management, LLC | 4.314 | 0,14 | 689 | 29,27 | ||||
| 2026-01-28 | 13F | Oversea-Chinese Banking CORP Ltd | 62.830 | 168,25 | 10.040 | 246,45 | ||||
| 2026-02-10 | 13F | Lido Advisors, LLC | 6.007 | 0,22 | 761 | 2,56 | ||||
| 2026-02-05 | 13F | Allworth Financial LP | 541 | 14,86 | 86 | 48,28 | ||||
| 2026-01-30 | 13F | Activest Wealth Management | 0 | -100,00 | 0 | |||||
| 2026-02-03 | 13F | International Assets Investment Management, Llc | 69 | 11 | ||||||
| 2026-01-08 | 13F | Wealth Enhancement Advisory Services, Llc | 11.412 | 24,52 | 2.094 | 77,46 | ||||
| 2026-02-17 | 13F | ISAM Funds (UK) Ltd | 0 | -100,00 | 0 | -100,00 | ||||
| 2026-01-15 | 13F | Fortitude Family Office, LLC | 89 | 2,30 | 14 | 40,00 | ||||
| 2026-01-14 | 13F | Jfs Wealth Advisors, Llc | 22 | 175,00 | 4 | |||||
| 2026-02-02 | 13F | Fifth Third Bancorp | 620 | 0,16 | 99 | 30,26 | ||||
| 2026-02-13 | 13F | Y-Intercept (Hong Kong) Ltd | 0 | -100,00 | 0 | |||||
| 2026-02-17 | 13F | Oddo Bhf Asset Management Sas | 0 | -100,00 | 0 | |||||
| 2026-02-12 | 13F | Index Technologies Group LLC | 1.748 | 279 | ||||||
| 2026-02-09 | 13F | Systematic Financial Management Lp | 264.741 | -0,27 | 42.306 | 28,76 | ||||
| 2026-02-17 | 13F | Public Employees Retirement System Of Ohio | 55.319 | -11,19 | 8.840 | 14,66 | ||||
| 2026-02-05 | 13F | New York Life Investment Management Llc | 5.738 | -9,24 | 917 | 17,14 | ||||
| 2026-02-13 | 13F | Atlas Capital Advisors Llc | 5.971 | 954 | ||||||
| 2026-02-13 | 13F | Icon Advisers Inc/co | 18.000 | 24,14 | 2.876 | 60,31 | ||||
| 2026-02-20 | 13F | Dean Capital Management | 12.090 | 3,22 | 1.932 | 33,26 | ||||
| 2025-11-14 | 13F | Cubist Systematic Strategies, LLC | Put | 4.300 | 0,00 | 532 | 24,59 | |||
| 2025-11-14 | 13F | Cubist Systematic Strategies, LLC | Call | 4.300 | -8,51 | 532 | 14,16 | |||
| 2025-11-14 | 13F | Sherbrooke Park Advisers Llc | 0 | -100,00 | 0 | -100,00 | ||||
| 2026-02-13 | 13F | First Trust Advisors Lp | 52.976 | -54,46 | 8.466 | -41,21 | ||||
| 2026-01-29 | 13F | Teachers Retirement System Of The State Of Kentucky | 37.904 | -2,72 | 6 | 50,00 | ||||
| 2026-02-06 | 13F | Handelsbanken Fonder AB | 158.400 | 44,53 | 25 | 92,31 | ||||
| 2026-02-17 | 13F | Canada Pension Plan Investment Board | 35.000 | 157,35 | 5.593 | 232,32 | ||||
| 2026-02-17 | 13F | Watershed Asset Management, L.L.C. | 2.902 | 464 | ||||||
| 2026-02-11 | 13F | Meeder Advisory Services, Inc. | 4.724 | 755 | ||||||
| 2025-11-14 | 13F | D. E. Shaw & Co., Inc. | 0 | -100,00 | 0 | |||||
| 2026-01-09 | 13F | Assenagon Asset Management S.A. | 92.856 | 14.838 | ||||||
| 2026-02-11 | 13F | IMA Wealth, Inc. | 39 | 875,00 | 6 | |||||
| 2026-02-13 | 13F | Diametric Capital, LP | 0 | -100,00 | 0 | -100,00 | ||||
| 2026-01-28 | 13F | Teacher Retirement System Of Texas | 2.221 | -74,72 | 355 | -67,43 | ||||
| 2026-01-30 | 13F | Innealta Capital, Llc | 1.436 | 229 | ||||||
| 2026-02-13 | 13F | Harber Asset Management Llc | 52.539 | -23,06 | 8.396 | -0,67 | ||||
| 2026-02-13 | 13F | Ubs Asset Management Americas Inc | 200.179 | -3,03 | 31.989 | 25,20 | ||||
| 2026-02-10 | 13F | Goldman Sachs Group Inc | 179.998 | -16,79 | 28.764 | 7,44 | ||||
| 2026-01-21 | 13F | Raleigh Capital Management Inc. | 0 | 0 | ||||||
| 2026-02-13 | 13F | Great West Life Assurance Co /can/ | 38.169 | -30,91 | 6 | 0,00 | ||||
| 2026-02-17 | 13F | Alliancebernstein L.p. | 86.122 | 1,66 | 13.762 | 31,27 | ||||
| 2026-02-05 | 13F | Northwestern Mutual Investment Management Company, Llc | 15.028 | 0,39 | 2.401 | 29,64 | ||||
| 2026-02-12 | 13F | Hilton Capital Management, LLC | 23.140 | 3.698 | ||||||
| 2026-02-06 | 13F | Tortoise Investment Management, LLC | 0 | -100,00 | 0 | |||||
| 2026-02-17 | 13F | Defiance ETFs, LLC | 237.906 | 38.498 | ||||||
| 2026-02-02 | 13F | Principal Financial Group Inc | 765.595 | -6,49 | 122.353 | 20,74 | ||||
| 2026-02-13 | 13F | Headlands Technologies LLC | 2.676 | 428 | ||||||
| 2026-02-11 | 13F | LPL Financial LLC | 11.910 | 73,59 | 1.903 | 124,15 | ||||
| 2026-01-14 | 13F | Exchange Traded Concepts, Llc | 1.442 | 230 | ||||||
| 2026-02-06 | 13F | Pnc Financial Services Group, Inc. | 10.004 | 30,48 | 1.599 | 68,57 | ||||
| 2026-02-23 | 13F | Virtu Financial LLC | 7.295 | 1 | ||||||
| 2026-02-17 | 13F | Raymond James Financial Inc | 249.347 | 40,67 | 40.040 | 82,51 | ||||
| 2025-12-09 | 13F/A | Tudor Investment Corp Et Al | Put | 0 | -100,00 | 0 | ||||
| 2025-11-14 | 13F | National Bank Of Canada /fi/ | Put | 0 | -100,00 | 0 | -100,00 | |||
| 2025-10-28 | 13F | Arlington Trust Co LLC | 0 | -100,00 | 0 | |||||
| 2026-02-17 | 13F | Caption Management, LLC | Call | 65.000 | 0,00 | 10.387 | 29,11 | |||
| 2026-01-30 | 13F/A | M&t Bank Corp | 22.044 | 5,51 | 3.523 | 36,29 | ||||
| 2025-10-21 | 13F | Altfest L J & Co Inc | 0 | -100,00 | 0 | |||||
| 2026-01-06 | 13F | Nelson, Van Denburg & Campbell Wealth Management Group, LLC | 2.695 | 23,85 | 431 | 59,85 | ||||
| 2026-02-17 | 13F | Caption Management, LLC | 16.328 | 0,00 | 2.609 | 29,16 | ||||
| 2026-02-05 | 13F | GABELLI & Co INVESTMENT ADVISERS, INC. | 2.220 | 0,00 | 355 | 29,20 | ||||
| 2026-02-17 | 13F | Capstone Investment Advisors, Llc | 0 | -100,00 | 0 | -100,00 | ||||
| 2026-02-12 | 13F | BRYN MAWR TRUST Co | 157 | 0,00 | 25 | 31,58 | ||||
| 2026-02-17 | 13F | Schonfeld Strategic Advisors LLC | 0 | -100,00 | 0 | |||||
| 2026-02-17 | 13F | Signature Equity Partners, LLC | 9 | 1 | ||||||
| 2026-02-17 | 13F | Brevan Howard Capital Management LP | 7.275 | -79,98 | 1.163 | -74,16 | ||||
| 2026-01-23 | 13F | Farther Finance Advisors, LLC | 348 | 118,87 | 56 | 189,47 | ||||
| 2026-02-12 | 13F | Dimensional Fund Advisors Lp | 1.117.487 | -11,69 | 178.581 | 14,04 | ||||
| 2026-01-29 | 13F | IMC-Chicago, LLC | Call | 12.300 | -13,38 | 1.966 | 11,84 | |||
| 2026-02-17 | 13F | Prelude Capital Management, Llc | 6.825 | -7,81 | 1.091 | 19,00 | ||||
| 2026-02-13 | 13F | Quarry LP | 13 | -89,60 | 2 | -86,67 | ||||
| 2026-01-29 | 13F | UBS Group AG | Call | 907.200 | 0,00 | 144.971 | 29,11 | |||
| 2026-02-03 | 13F | Sequoia Financial Advisors, LLC | 2.036 | 325 | ||||||
| 2026-02-06 | 13F | Leonteq Securities AG | 707 | 14,40 | 113 | 47,37 | ||||
| 2026-01-29 | 13F | UBS Group AG | 323.713 | -50,49 | 51.729 | -36,08 | ||||
| 2026-02-04 | 13F | Virginia Retirement Systems Et Al | 15.100 | 57,29 | 2.413 | 103,03 | ||||
| 2026-01-28 | 13F | Salomon & Ludwin, LLC | 395 | 0,00 | 70 | 27,78 | ||||
| 2026-02-06 | 13F | Lsv Asset Management | 31.492 | 5 | ||||||
| 2026-02-06 | 13F | IFP Advisors, Inc | 172 | 616,67 | 27 | 1.250,00 | ||||
| 2025-10-21 | 13F | Optimum Investment Advisors | 665 | 6,40 | 82 | 32,26 | ||||
| 2026-02-05 | 13F | Thrivent Financial For Lutherans | 87.605 | -16,63 | 14 | 0,00 | ||||
| 2026-02-13 | 13F | Stifel Financial Corp | 58.696 | 0,54 | 9.380 | 29,81 | ||||
| 2025-11-14 | 13F | Axa S.a. | 0 | -100,00 | 0 | |||||
| 2026-02-17 | 13F | Light Street Capital Management, Llc | 19.582 | 3.129 | ||||||
| 2026-02-17 | 13F | Elequin Capital Lp | 176 | 28 | ||||||
| 2026-02-17 | 13F | NorthRock Partners, LLC | 0 | -100,00 | 0 | |||||
| 2026-02-09 | 13F | Legal & General Group Plc | 99.589 | -3,71 | 15.914 | 24,33 | ||||
| 2026-02-09 | 13F | Coldstream Capital Management Inc | 5.566 | 15,10 | 889 | 48,66 | ||||
| 2026-01-29 | 13F | Washington Capital Management Inc | 5.500 | -14,06 | 879 | 10,86 | ||||
| 2026-02-12 | 13F | Skopos Labs, Inc. | 7.399 | 203,74 | 1.204 | 393,44 | ||||
| 2026-02-17 | 13F | Aster Capital Management (DIFC) Ltd | 561 | -27,71 | 90 | -7,29 | ||||
| 2025-10-30 | 13F | Twin Peaks Wealth Advisors, LLC | 0 | -100,00 | 0 | |||||
| 2026-02-17 | 13F | Balyasny Asset Management Llc | 511.620 | -39,83 | 81.757 | -22,31 | ||||
| 2026-01-28 | 13F | Arizona State Retirement System | 18.809 | -5,13 | 3.006 | 22,50 | ||||
| 2026-02-13 | 13F | Macquarie Group Ltd | 0 | -100,00 | 0 | |||||
| 2025-11-14 | 13F | Aigen Investment Management, Lp | 0 | -100,00 | 0 | |||||
| 2026-02-06 | 13F | FourThought Financial Partners, LLC | 1.577 | -15,40 | 252 | 9,57 | ||||
| 2026-02-10 | 13F | Phillips Wealth Planners LLC | 1.584 | -12,39 | 350 | 38,49 | ||||
| 2026-02-03 | 13F | Crossmark Global Holdings, Inc. | 3.340 | 12,88 | 534 | 45,63 | ||||
| 2026-02-12 | 13F | State Board Of Administration Of Florida Retirement System | 54.101 | 0,71 | 8.645 | 30,02 | ||||
| 2026-02-17 | 13F | Old West Investment Management, LLC | 16.350 | 3,16 | 2.613 | 33,20 | ||||
| 2026-02-17 | 13F | Summit Partners Public Asset Management, Llc | Put | 129.000 | -40,00 | 20.614 | -22,53 | |||
| 2026-02-06 | 13F | Mach-1 Financial Group, Inc. | 1.423 | 227 | ||||||
| 2025-10-31 | 13F | Cullen/frost Bankers, Inc. | 0 | -100,00 | 0 | |||||
| 2026-02-17 | 13F | Toronto Dominion Bank | 3 | 1 | ||||||
| 2026-02-17 | 13F | Summit Partners Public Asset Management, Llc | 381.500 | -36,00 | 60.964 | -17,38 | ||||
| 2026-01-13 | 13F | CoreCap Advisors, LLC | 41 | 0,00 | 7 | 20,00 | ||||
| 2026-01-27 | 13F | Evergreen Capital Management Llc | 3.435 | -3,24 | 549 | 24,83 | ||||
| 2026-02-10 | 13F | State of Wyoming | 4.465 | 31,48 | 714 | 69,76 | ||||
| 2026-02-11 | 13F | J.Safra Asset Management Corp | 20 | 33,33 | 3 | 200,00 | ||||
| 2026-01-27 | 13F | Hgk Asset Management Inc | 6.310 | -39,26 | 1.008 | -21,56 | ||||
| 2026-02-17 | 13F | Captrust Financial Advisors | 3.432 | 26,83 | 548 | 64,07 | ||||
| 2026-02-12 | 13F | Callan Family Office, LLC | 4.593 | 58,87 | 734 | 105,32 | ||||
| 2026-02-17 | 13F | Frontier Capital Management Co Llc | 550.735 | -49,04 | 88.007 | -34,21 | ||||
| 2026-01-23 | 13F | Private Wealth Management Group, LLC | 19 | 0,00 | 3 | 50,00 | ||||
| 2025-11-14 | 13F | Binnacle Investments Inc | 4 | 0 | ||||||
| 2025-11-06 | 13F | CENTRAL TRUST Co | 0 | -100,00 | 0 | |||||
| 2026-01-30 | 13F | Us Bancorp \de\ | 6.382 | 0,19 | 1.020 | 29,31 | ||||
| 2026-02-17 | 13F | SummitTX Capital, L.P. | 205.750 | 4,58 | 32.879 | 35,03 | ||||
| 2026-02-17 | 13F | Sora Investors Llc | 0 | -100,00 | 0 | -100,00 | ||||
| 2026-02-05 | 13F | Qsemble Capital Management, LP | 1.891 | 302 | ||||||
| 2026-01-20 | 13F | Hanson & Doremus Investment Management | 6.005 | 0,00 | 1 | |||||
| 2026-02-13 | 13F | Truvestments Capital Llc | 402 | -0,99 | 64 | 28,00 | ||||
| 2026-02-17 | 13F | Two Sigma Advisers, Lp | 2.100 | 336 | ||||||
| 2026-02-09 | 13F | Optimize Financial Inc | 13.435 | 1,45 | 2.147 | 30,93 | ||||
| 2026-01-23 | 13F | Tectonic Advisors Llc | 3.112 | 2,74 | 497 | 32,89 | ||||
| 2026-02-10 | 13F | Intech Investment Management Llc | 6.717 | 50,03 | 1.073 | 93,68 | ||||
| 2026-02-13 | 13F | Nfj Investment Group, Llc | 85.590 | -15,86 | 13.677 | 8,64 | ||||
| 2026-02-12 | 13F | Federated Hermes, Inc. | 99.313 | -0,62 | 15.870 | 28,32 | ||||
| 2026-02-10 | 13F | CIBC Asset Management Inc | 2.107 | 0,00 | 337 | 29,23 | ||||
| 2026-02-17 | 13F | XTX Topco Ltd | 19.944 | 3.187 | ||||||
| 2026-02-13 | 13F | FirstWave Capital Management LLC | 8.021 | 1.282 | ||||||
| 2026-02-17 | 13F | Gotham Asset Management, LLC | 225.215 | 13,08 | 35.989 | 46,00 | ||||
| 2026-02-17 | 13F | Divisar Capital Management LLC | 77.501 | 25,00 | 12.385 | 61,40 | ||||
| 2026-02-17 | 13F | BlueCrest Capital Management Ltd | 15.640 | 2.499 | ||||||
| 2026-02-17 | 13F | Advisor Group Holdings, Inc. | 5.196 | 2,22 | 831 | 39,73 | ||||
| 2026-02-10 | 13F | Principia Wealth Advisory, LLC | 10 | 0,00 | 2 | 0,00 | ||||
| 2026-02-13 | 13F | Pathstone Holdings, LLC | 19.652 | -6,72 | 3.140 | 20,44 | ||||
| 2026-02-05 | 13F | Fourier Capital Management Ltd | 43.531 | 6.956 | ||||||
| 2026-02-12 | 13F | Hrt Financial Lp | 4.169 | -98,44 | 1 | -100,00 | ||||
| 2026-02-17 | 13F | Janus Henderson Group Plc | 29.070 | 0,00 | 4.647 | 29,23 | ||||
| 2026-02-12 | 13F | Colonial Trust Co / SC | 34 | 0,00 | 5 | 25,00 | ||||
| 2026-01-08 | 13F | Oliver Luxxe Assets LLC | 22.641 | 3.618 | ||||||
| 2026-02-11 | 13F | Franklin Resources Inc | 1.041.725 | -26,06 | 166.468 | -4,54 | ||||
| 2026-02-17 | 13F | DV Trading LLC | 72 | 12 | ||||||
| 2026-02-13 | 13F | State Street Corp | 2.017.590 | -1,29 | 322.411 | 27,44 | ||||
| 2026-01-08 | 13F | Armstrong Advisory Group, Inc | 96 | 0,00 | 15 | 36,36 | ||||
| 2026-02-24 | 13F | Bell Investment Advisors, Inc | 106 | 63,08 | 17 | 100,00 | ||||
| 2026-01-29 | 13F | Polaris Capital Management, LLC | 265.100 | -33,94 | 42.363 | -14,71 | ||||
| 2026-02-13 | 13F | Morgan Stanley | 590.521 | -9,51 | 94.366 | 16,83 | ||||
| 2026-02-17 | 13F | Bank Of America Corp /de/ | 480.227 | 12,20 | 76.740 | 44,87 | ||||
| 2026-01-26 | 13F | KBC Group NV | 2.039 | 14,04 | 0 | |||||
| 2025-11-14 | 13F | Sculptor Capital LP | 0 | -100,00 | 0 | |||||
| 2026-01-08 | 13F | True Wealth Design, LLC | 83 | 5,06 | 13 | 44,44 | ||||
| 2026-01-15 | 13F | Retirement Systems of Alabama | 156.714 | -0,37 | 25.043 | 28,63 | ||||
| 2026-01-21 | 13F | Capital Advisors, Ltd. LLC | 137 | 0,00 | 0 | |||||
| 2026-02-10 | 13F | Ellevest, Inc. | 5.182 | 8,46 | 828 | 40,10 | ||||
| 2026-01-23 | 13F | Rsm Us Wealth Management Llc | 1.448 | 234 | ||||||
| 2026-02-05 | 13F | Bessemer Group Inc | 158.030 | -25,47 | 25 | -3,85 | ||||
| 2026-02-17 | 13F | Weiss Asset Management LP | 0 | -100,00 | 0 | -100,00 | ||||
| 2026-02-10 | 13F | Bnp Paribas Arbitrage, Sa | 160.613 | 133,90 | 25.666 | 202,01 | ||||
| 2026-02-03 | 13F | Farmers & Merchants Investments Inc | 59 | 5,36 | 9 | 50,00 | ||||
| 2026-02-17 | 13F | Fmr Llc | 3.198.335 | -7,11 | 511.094 | 19,93 | ||||
| 2026-02-13 | 13F | Fairman Group, LLC | 24 | 4 | ||||||
| 2026-02-13 | 13F | Squarepoint Ops LLC | 26.648 | 4.258 | ||||||
| 2026-02-17 | 13F | CWM Advisors, LLC | 10.946 | 197,36 | 1.749 | 284,40 | ||||
| 2026-02-03 | 13F | Ballentine Partners, LLC | 1.577 | 252 | ||||||
| 2026-02-13 | 13F | Bank Of Nova Scotia | 72.250 | 11.546 | ||||||
| 2026-02-12 | 13F | Cloud Capital Management, LLC | 0 | -100,00 | 0 | |||||
| 2026-02-17 | 13F | Parallax Volatility Advisers, L.P. | Call | 15.000 | 2.397 | |||||
| 2026-02-13 | 13F | Barclays Plc | 340.318 | -66,61 | 54.383 | -50,91 | ||||
| 2026-01-29 | 13F | Vanguard Group Inc | 7.487.305 | -3,42 | 1.196.471 | 24,70 | ||||
| 2026-02-13 | 13F | Citigroup Inc | 66.311 | 0,80 | 10.596 | 30,14 | ||||
| 2026-01-29 | 13F | State Of Michigan Retirement System | 15.840 | -1,25 | 2.531 | 27,51 | ||||
| 2026-01-22 | 13F | City Holding Co | 102 | 16 | ||||||
| 2026-01-21 | 13F | Oak Thistle LLC | 0 | -100,00 | 0 | -100,00 | ||||
| 2026-02-17 | 13F | Agf Management Ltd | 69.733 | 11.143 | ||||||
| 2026-02-04 | 13F | Swiss Life Asset Management Ltd | 4.948 | 59,25 | 791 | 105,73 | ||||
| 2026-02-05 | 13F | Td Private Client Wealth Llc | 1 | 0 | ||||||
| 2026-02-04 | 13F | Bailard, Inc. | 0 | -100,00 | 0 | |||||
| 2026-02-13 | 13F | National Bank Of Canada /fi/ | 3.835 | -31,30 | 613 | -11,30 | ||||
| 2026-02-17 | 13F | Dean Investment Associates, Llc | 23.480 | 2,65 | 3.752 | 32,58 | ||||
| 2026-02-17 | 13F | Jones Financial Companies Lllp | 2.224 | 23,35 | 355 | 62,10 | ||||
| 2026-02-11 | 13F | CLARET ASSET MANAGEMENT Corp | 2.282 | -0,22 | 0 | |||||
| 2026-02-13 | 13F | Ossiam | 0 | -100,00 | 0 | |||||
| 2026-02-05 | 13F | Cambridge Investment Research Advisors, Inc. | 1.591 | -9,65 | 0 | |||||
| 2026-01-29 | 13F | Nbc Securities, Inc. | Put | 2 | 1 | |||||
| 2026-01-26 | 13F | Whittier Trust Co Of Nevada Inc | 216 | 0,00 | 40 | 34,48 | ||||
| 2026-01-09 | 13F | SG Americas Securities, LLC | 19.124 | 265,17 | 3 | |||||
| 2026-02-02 | 13F | Cornerstone Planning Group LLC | 30 | 0,00 | 7 | 75,00 | ||||
| 2026-01-23 | 13F | Assetmark, Inc | 77 | 37,50 | 12 | 100,00 | ||||
| 2026-02-09 | 13F | Hantz Financial Services, Inc. | 24.383 | -12,93 | 4 | 0,00 | ||||
| 2026-01-26 | 13F | Merit Financial Group, LLC | 3.411 | 16,22 | 545 | 50,14 | ||||
| 2026-01-23 | 13F | State of Alaska, Department of Revenue | 6.666 | -9,19 | 1 | |||||
| 2026-02-17 | 13F | Creative Planning | 42.827 | -0,63 | 6.844 | 28,29 | ||||
| 2026-02-17 | 13F | Mirabella Financial Services Llp | 3.189 | 14,92 | 510 | 48,40 | ||||
| 2026-01-28 | 13F | Legacy Capital Group California, Inc. | 1.565 | 250 | ||||||
| 2026-02-10 | 13F | Dynasty Wealth Management, Llc | 2.438 | -9,67 | 390 | 16,47 | ||||
| 2026-02-13 | 13F | Neuberger Berman Group LLC | 1.461.189 | -10,62 | 233.498 | 15,40 | ||||
| 2026-02-17 | 13F | Cnh Partners Llc | 40.090 | 7,35 | 6.406 | 39,63 | ||||
| 2026-02-13 | 13F | Fieldview Capital Management, LLC | 25.208 | 3,48 | 4.028 | 33,60 | ||||
| 2026-03-12 | 13F/A | Peak6 Llc | Call | 114.100 | 85,53 | 18.233 | 139,56 | |||
| 2025-10-24 | 13F | Hemington Wealth Management | 81 | 65,31 | 0 | |||||
| 2026-01-29 | 13F | Quent Capital, LLC | 92 | 39,39 | 15 | 75,00 | ||||
| 2026-03-06 | 13F | Hsbc Holdings Plc | 9.390 | -49,96 | 1.511 | -34,60 | ||||
| 2026-01-28 | 13F | Quaker Wealth Management, LLC | 12 | 0,00 | 2 | 0,00 | ||||
| 2026-02-12 | 13F | Leith Wheeler Investment Counsel Ltd. | 48.469 | -27,83 | 7.745 | -6,82 | ||||
| 2026-03-12 | 13F/A | Peak6 Llc | Put | 9.000 | 1.438 | |||||
| 2026-02-17 | 13F | Summit Partners Public Asset Management, Llc | Call | 0 | -100,00 | 0 | ||||
| 2025-10-17 | 13F | MKT Advisors LLC | 0 | -100,00 | 0 | |||||
| 2026-02-17 | 13F | Sig Brokerage, Lp | 0 | -100,00 | 0 | |||||
| 2026-02-09 | 13F | Smithfield Trust Co | 155 | 0,00 | 0 | |||||
| 2025-11-12 | 13F | NewSquare Capital LLC | 0 | -100,00 | 0 | -100,00 | ||||
| 2026-02-03 | 13F | Robeco Schweiz AG | 52.630 | 8.410 | ||||||
| 2026-02-13 | 13F | Schroder Investment Management Group | 514 | -60,88 | 83 | -48,12 | ||||
| 2026-01-29 | 13F | Rakuten Securities, Inc. | 12 | 2 | ||||||
| 2026-02-17 | 13F | Cetera Investment Advisers | 27.051 | 2,14 | 4.323 | 31,89 | ||||
| 2026-02-11 | 13F | Winnow Wealth Llc | 0 | -100,00 | 0 | |||||
| 2026-02-11 | 13F | Simplex Trading, Llc | Put | 1.100 | -82,81 | 176 | ||||
| 2026-02-12 | 13F | CIBC Private Wealth Group, LLC | 256 | 55,15 | 41 | 100,00 | ||||
| 2026-02-11 | 13F | Simplex Trading, Llc | Call | 35.600 | 67,92 | 5.689 | 284.300,00 | |||
| 2026-02-13 | 13F | DeepCurrents Investment Group LLC | Call | 0 | -100,00 | 0 | ||||
| 2026-01-30 | 13F | Torren Management, LLC | 106 | 17 | ||||||
| 2026-02-17 | 13F | Southpoint Capital Advisors LP | 600.000 | 95.880 | ||||||
| 2026-02-13 | 13F | Cetera Trust Company, N.A | 2.915 | 0,00 | 466 | 29,17 | ||||
| 2026-02-10 | 13F | Root Financial Partners, LLC | 141 | 24,78 | 23 | 69,23 | ||||
| 2026-02-13 | 13F | Rhumbline Advisers | 176.041 | -4,02 | 28.131 | 23,92 | ||||
| 2026-02-09 | 13F | Hartland & Co., LLC | 1.009 | -52,89 | 161 | -39,25 | ||||
| 2026-02-17 | 13F | Hancock Whitney Corp | 5.386 | 1,30 | 861 | 30,70 | ||||
| 2026-02-12 | 13F | Ci Investments Inc. | 0 | -100,00 | 0 | |||||
| 2026-02-17 | 13F | Ameriprise Financial Inc | 142.495 | -21,06 | 22.771 | 1,92 | ||||
| 2026-02-17 | 13F | Ameriprise Financial Inc | Put | 11.600 | -41,41 | 1.854 | -24,37 | |||
| 2026-02-03 | 13F | Crestwood Advisors Group LLC | 1.287 | 206 | ||||||
| 2026-02-11 | 13F | Parallel Advisors, LLC | 960 | 2,89 | 153 | 33,04 | ||||
| 2026-02-11 | 13F | Zions Bancorporation, National Association /ut/ | 30 | 5 | ||||||
| 2026-02-13 | 13F | Edgestream Partners, L.P. | 58.881 | 230,77 | 9.409 | 327,10 | ||||
| 2026-02-12 | 13F | Principal Securities, Inc. | 0 | -100,00 | 0 | |||||
| 2026-01-08 | 13F | Fulton Bank, N.a. | 3.918 | -6,07 | 626 | 21,32 | ||||
| 2026-02-13 | 13F | Dynamic Technology Lab Private Ltd | 6.338 | 93,82 | 1.013 | 150,12 | ||||
| 2026-01-20 | 13F | Cromwell Holdings LLC | 10 | 0,00 | 2 | 0,00 | ||||
| 2026-01-30 | 13F | Bogart Wealth, LLC | 23 | 0,00 | 4 | 50,00 | ||||
| 2026-02-17 | 13F | Infrastructure Capital Advisors, Llc | 3.572 | -22,21 | 571 | -13,51 | ||||
| 2026-02-13 | 13F | BNP Paribas Asset Management Holding S.A. | 26.059 | 3.890,66 | 4 | |||||
| 2026-02-13 | 13F | Walleye Capital LLC | Put | 200 | -71,43 | 32 | -63,95 | |||
| 2026-02-17 | 13F | Shellback Capital, LP | 36.407 | 5.818 | ||||||
| 2026-02-13 | 13F | Parkside Financial Bank & Trust | 172 | 13,91 | 27 | 50,00 | ||||
| 2026-02-13 | 13F | Walleye Capital LLC | 11.453 | -77,23 | 1.830 | -70,60 | ||||
| 2026-02-13 | 13F | Walleye Capital LLC | Call | 100 | -50,00 | 16 | -37,50 | |||
| 2026-01-08 | 13F | Wedmont Private Capital | 3.064 | 7,40 | 561 | 52,86 | ||||
| 2026-02-09 | 13F | Harbour Investments, Inc. | 7 | 16,67 | 1 | |||||
| 2026-02-17 | 13F | Trexquant Investment LP | 9.159 | 27,10 | 1.464 | 64,20 | ||||
| 2026-01-29 | 13F | Comerica Bank | 39.852 | -79,15 | 6.368 | -73,08 | ||||
| 2026-01-28 | 13F | Geneos Wealth Management Inc. | 430 | 0,00 | 69 | 28,30 | ||||
| 2026-01-09 | 13F | Park Place Capital Corp | 40 | 6 | ||||||
| 2026-02-17 | 13F | Polymer Capital Management (US) LLC | 2.425 | 388 | ||||||
| 2026-01-12 | 13F | DAVENPORT & Co LLC | 2.017 | 2,70 | 324 | 34,44 | ||||
| 2026-02-02 | 13F | Oppenheimer Asset Management Inc. | 2.958 | 473 | ||||||
| 2026-01-23 | 13F | Avion Wealth | 40 | -24,53 | 0 | |||||
| 2026-02-13 | 13F | Public Employees Retirement Association Of Colorado | 6.840 | 0,00 | 1 | |||||
| 2026-02-02 | 13F | Danske Bank A/s | 300 | 0,00 | 48 | 27,03 | ||||
| 2026-02-19 | 13F | CI Private Wealth, LLC | 133.036 | 2.170,24 | 3.445 | 375,17 | ||||
| 2026-02-09 | 13F | Wcm Investment Management, Llc | 18.556 | -45,17 | 3.003 | -27,37 | ||||
| 2026-01-16 | 13F | DiNuzzo Private Wealth, Inc. | 5 | 66,67 | 1 | |||||
| 2026-02-11 | 13F | Vise Technologies, Inc. | 5.307 | 26,87 | 848 | 64,02 | ||||
| 2026-02-09 | 13F | Huntington National Bank | 125 | -10,71 | 20 | 11,76 | ||||
| 2026-02-13 | 13F | American Century Companies Inc | 397.564 | 18.521,26 | 63.531 | 23.964,77 | ||||
| 2026-02-03 | 13F | Everence Capital Management Inc | 2.100 | 0,00 | 0 | |||||
| 2026-01-13 | 13F | Norden Group Llc | 1.361 | 217 | ||||||
| 2026-02-02 | 13F | Horizon Investments, LLC | 7.136 | 25,94 | 1.140 | 62,62 | ||||
| 2026-02-17 | 13F | Guggenheim Capital Llc | 9.812 | 1,71 | 1.568 | 31,24 | ||||
| 2025-11-13 | 13F | Vestcor Inc | 0 | -100,00 | 0 | |||||
| 2026-02-12 | 13F | Steward Partners Investment Advisory, Llc | 213 | 0,00 | 34 | 30,77 | ||||
| 2026-02-11 | 13F | O'shaughnessy Asset Management, Llc | 2.417 | 386 | ||||||
| 2026-02-12 | 13F | Bank Of Montreal /can/ | 164.794 | 52,24 | 26.334 | 96,57 | ||||
| 2026-02-13 | 13F | Manufacturers Life Insurance Company, The | 0 | -100,00 | 0 | |||||
| 2025-11-10 | 13F | Optiver Holding B.V. | 0 | -100,00 | 0 | |||||
| 2026-02-17 | 13F | Amundi | 140.223 | 37,22 | 22.408 | 57,22 | ||||
| 2026-02-12 | 13F | Voya Investment Management Llc | 11.145 | 30,49 | 1.781 | 68,40 | ||||
| 2026-02-11 | 13F | Group One Trading, L.p. | Put | 1.100 | -21,43 | 176 | 1,16 | |||
| 2026-02-13 | 13F | Neo Ivy Capital Management | 0 | -100,00 | 0 | -100,00 | ||||
| 2026-02-17 | 13F | Susquehanna International Group, Llp | Put | 71.900 | 810,13 | 11.490 | 1.075,95 | |||
| 2026-02-17 | 13F | Susquehanna International Group, Llp | Call | 201.700 | 40,46 | 32.232 | 81,35 | |||
| 2026-02-04 | 13F | First National Advisers, LLC | 1.427 | -19,24 | 228 | 4,59 | ||||
| 2026-02-17 | 13F | Ancora Advisors, LLC | 82 | 13 | ||||||
| 2026-02-17 | 13F | Susquehanna International Group, Llp | 2.743 | -86,14 | 438 | -82,12 | ||||
| 2026-02-17 | 13F | Hood River Capital Management LLC | 58.878 | 9.409 | ||||||
| 2026-01-20 | 13F | eCIO, Inc. | 394 | 63 | ||||||
| 2026-02-12 | 13F | Counterpoint Mutual Funds LLC | 1.943 | 310 | ||||||
| 2026-02-13 | 13F | SRS Capital Advisors, Inc. | 217 | -88,08 | 35 | -84,89 | ||||
| 2025-11-14 | 13F | Wolverine Trading, Llc | Call | 191.200 | 23,91 | 23.353 | 51,03 | |||
| 2026-02-11 | 13F | Harvest Fund Management Co., Ltd | 2.124 | 605,65 | 0 | |||||
| 2025-11-14 | 13F | Wolverine Trading, Llc | Put | 54.400 | 22,25 | 6.644 | 49,00 | |||
| 2026-01-28 | 13F | Universal- Beteiligungs- und Servicegesellschaft mbH | 17.492 | 42,99 | 2.795 | 84,61 | ||||
| 2026-02-13 | 13F | Channing Capital Management, LLC | 531.179 | -28,62 | 84.882 | -7,84 | ||||
| 2026-02-11 | 13F | Capital Research Global Investors | 0 | -100,00 | 0 | |||||
| 2026-02-09 | 13F | Roubaix Capital, LLC | 0 | -100,00 | 0 | |||||
| 2026-02-12 | 13F | Ensign Peak Advisors, Inc | 3.747 | -65,93 | 599 | -56,06 | ||||
| 2026-02-17 | 13F | Quantinno Capital Management LP | 230.899 | 45,04 | 36.898 | 87,27 | ||||
| 2026-01-20 | 13F | Thurston, Springer, Miller, Herd & Titak, Inc. | 0 | -100,00 | 0 | |||||
| 2026-02-11 | 13F | Deutsche Bank Ag\ | 133.976 | -0,16 | 21.409 | 28,91 | ||||
| 2025-11-12 | 13F | Rafferty Asset Management, LLC | 0 | -100,00 | 0 | |||||
| 2026-01-26 | 13F | AE Wealth Management LLC | 2.602 | 52,88 | 416 | 97,62 | ||||
| 2026-02-17 | 13F | Candelo Capital Management LP | 35.107 | 5.610 | ||||||
| 2026-02-18 | 13F | EP Wealth Advisors, Inc. | 4.384 | 21,10 | 701 | 94,99 | ||||
| 2026-02-05 | 13F | Leuthold Group, Llc | 2.618 | 1,12 | 418 | 30,63 | ||||
| 2026-01-23 | 13F | TFC Financial Management | 1 | 0 | ||||||
| 2026-01-16 | 13F | Linden Thomas Advisory Services, LLC | 8.221 | -0,25 | 1.314 | 28,73 | ||||
| 2026-02-10 | 13F | Globeflex Capital L P | 36.314 | 10,54 | 5.803 | 42,73 | ||||
| 2026-02-13 | 13F | Mml Investors Services, Llc | 3.374 | 18,22 | 539 | 52,69 | ||||
| 2026-02-10 | 13F | Norges Bank | 922.737 | 147.453 | ||||||
| 2026-02-13 | 13F | Smartleaf Asset Management LLC | 876 | 236,92 | 142 | 354,84 | ||||
| 2026-02-17 | 13F | Concentric Capital Strategies, LP | 102.590 | 36,95 | 16.394 | 76,82 | ||||
| 2026-02-17 | 13F | Engineers Gate Manager LP | 12.231 | 212,49 | 1.955 | 303,72 | ||||
| 2026-02-17 | 13F | Maryland State Retirement & Pension System | 3.348 | 0,00 | 535 | 29,23 | ||||
| 2025-10-15 | 13F | Net Worth Advisory Group | 0 | -100,00 | 0 | |||||
| 2026-02-17 | 13F | Glenview Capital Management, Llc | 74.200 | -56,84 | 11.857 | -44,28 | ||||
| 2026-02-13 | 13F | Healthcare Of Ontario Pension Plan Trust Fund | 0 | -100,00 | 0 | -100,00 | ||||
| 2025-11-14 | 13F | Holocene Advisors, LP | 0 | -100,00 | 0 | |||||
| 2026-02-09 | 13F | Wellington Shields Capital Management, LLC | 54.161 | -1,31 | 8.655 | 27,41 | ||||
| 2026-02-12 | 13F | Nuveen, LLC | 341.424 | 21,40 | 54.560 | 56,73 | ||||
| 2026-01-30 | 13F | New York State Teachers Retirement System | 65.286 | 0,00 | 10 | 25,00 | ||||
| 2026-03-06 | 13F | Union Savings Bank | 43 | 7 | ||||||
| 2026-01-30 | 13F | Archer Investment Corp | 3.970 | 0,00 | 634 | 29,12 | ||||
| 2025-11-13 | 13F | Landscape Capital Management, L.l.c. | 0 | -100,00 | 0 | |||||
| 2026-02-13 | 13F | JustInvest LLC | 18.476 | 4,24 | 2.952 | 34,61 | ||||
| 2026-02-18 | 13F | Mackenzie Financial Corp | 4.175 | 674 | ||||||
| 2026-02-17 | 13F | Lazard Asset Management Llc | 5.878 | 106,90 | 939 | 167,52 | ||||
| 2026-02-19 | 13F | Mcguire Capital Advisors Inc | 6 | 1 | ||||||
| 2026-02-17 | 13F | Russell Investments Group, Ltd. | 34.989 | -1,08 | 5.594 | 27,78 | ||||
| 2026-02-13 | 13F | Needham Investment Management Llc | 130.500 | -0,19 | 20.854 | 28,87 | ||||
| 2026-02-13 | 13F | Banco Santander, S.A. | 11.748 | 2,17 | 1.877 | 31,90 | ||||
| 2026-02-18 | 13F | State of Tennessee, Treasury Department | 29.270 | -12,65 | 6.890 | 66,14 | ||||
| 2026-02-13 | 13F | Umb Bank N A/mo | 1.459 | 53,42 | 233 | 99,15 | ||||
| 2026-02-17 | 13F | Worldquant Millennium Advisors Llc | 16.281 | 2.602 | ||||||
| 2026-02-11 | 13F | Group One Trading, L.p. | Call | 200 | -93,75 | 32 | -92,17 | |||
| 2026-02-10 | 13F | Envestnet Asset Management Inc | 93.164 | -8,46 | 14.888 | 18,18 | ||||
| 2026-02-12 | 13F | BlackRock, Inc. | 6.138.839 | 0,25 | 980.986 | 29,44 | ||||
| 2026-02-17 | 13F | Mercer Global Advisors Inc /adv | 10.968 | 47,96 | 1.753 | 91,06 | ||||
| 2026-02-17 | 13F | Private Advisor Group, LLC | 4.141 | 662 | ||||||
| 2026-02-05 | 13F | Gabelli Funds Llc | 47.026 | 1,51 | 7.515 | 31,07 | ||||
| 2026-02-09 | 13F | Westover Capital Advisors, LLC | 1.500 | 240 | ||||||
| 2026-02-17 | 13F | Shapiro Capital Management Llc | 89.315 | -71,10 | 14.273 | -62,69 | ||||
| 2026-01-29 | 13F | Sanctuary Advisors, LLC | 9.073 | 6,98 | 1.450 | 38,13 | ||||
| 2026-02-13 | 13F | Resources Investment Advisors, LLC. | 1.908 | -7,38 | 305 | 19,22 | ||||
| 2026-02-17 | 13F | Integrated Advisors Network LLC | 1.779 | 284 | ||||||
| 2025-11-13 | 13F | Newbridge Financial Services Group, Inc. | 0 | -100,00 | 0 | |||||
| 2026-02-13 | 13F | Estabrook Capital Management | 250 | 0,00 | 40 | 30,00 | ||||
| 2026-02-04 | 13F | Madison Asset Management, LLC | 921.450 | -5,60 | 147.248 | 21,88 | ||||
| 2026-02-20 | 13F | Sunbelt Securities, Inc. | 14 | 0,00 | 2 | 100,00 | ||||
| 2026-02-17 | 13F | Price T Rowe Associates Inc /md/ | 2.753.850 | -24,20 | 440 | -2,00 | ||||
| 2026-02-17 | 13F | Cinctive Capital Management LP | 31.897 | 5.097 | ||||||
| 2026-01-15 | 13F | Fifth Third Wealth Advisors LLC | 2.004 | 0,20 | 320 | 29,55 | ||||
| 2026-01-05 | 13F | GAMMA Investing LLC | 2.862 | 15,12 | 457 | 48,86 | ||||
| 2026-02-11 | 13F | Group One Trading, L.p. | 6 | 1 | ||||||
| 2026-02-13 | 13F | Sterling Capital Management LLC | 16.987 | -1,00 | 2.715 | 27,84 | ||||
| 2026-02-12 | 13F | New York State Common Retirement Fund | 151.334 | -32,15 | 24.183 | -12,40 | ||||
| 2026-02-11 | 13F | Ameritas Investment Partners, Inc. | 12.310 | 1.967 | ||||||
| 2025-11-14 | 13F | AXA Investment Managers S.A. | 30.544 | 3.780 | ||||||
| 2026-02-13 | 13F | Police & Firemen's Retirement System of New Jersey | 28.116 | -5,45 | 4.493 | 22,07 | ||||
| 2026-02-09 | 13F | Geode Capital Management, Llc | 1.254.049 | 0,44 | 200.438 | 29,69 | ||||
| 2026-02-10 | 13F | Acadian Asset Management Llc | 555 | 0 | ||||||
| 2026-01-27 | 13F/A | Capital Performance Advisors Llp | 1.275 | 204 | ||||||
| 2026-01-30 | 13F | North Star Investment Management Corp. | 17 | 3 | ||||||
| 2026-02-13 | 13F | Transamerica Financial Advisors, Inc. | 36 | 6 | ||||||
| 2026-02-11 | 13F | Inceptionr Llc | 0 | -100,00 | 0 | -100,00 | ||||
| 2026-01-14 | 13F | ORG Partners LLC | 31 | 5 | ||||||
| 2026-02-12 | 13F | Brown Brothers Harriman & Co | 27 | 4 | ||||||
| 2026-01-16 | 13F | Louisiana State Employees Retirement System | 18.600 | -0,53 | 2.972 | 28,44 | ||||
| 2026-01-21 | 13F | SJS Investment Consulting Inc. | 243 | 0,83 | 39 | 31,03 | ||||
| 2026-02-12 | 13F | Campbell & CO Investment Adviser LLC | 1.364 | 218 | ||||||
| 2026-02-10 | 13F | Rothschild Investment Llc | 52 | 100,00 | 8 | 166,67 | ||||
| 2026-02-05 | 13F | 1620 Investment Advisors, Inc. | 893 | -46,81 | 143 | -31,40 | ||||
| 2026-02-13 | 13F | Cramer Rosenthal Mcglynn Llc | 230.692 | 36.865 | ||||||
| 2026-01-09 | 13F | Zrc Wealth Management, Llc | 34 | 209,09 | 5 | 400,00 | ||||
| 2026-01-15 | 13F | Nisa Investment Advisors, Llc | 17.737 | 0,01 | 2.834 | 29,11 | ||||
| 2026-02-12 | 13F | Federation des caisses Desjardins du Quebec | 4.882 | 17,21 | 780 | 51,46 | ||||
| 2026-02-10 | 13F | Bank of New York Mellon Corp | 788.648 | 21,12 | 126.026 | 56,38 | ||||
| 2026-02-13 | 13F | Kestra Advisory Services, LLC | 254 | 41 | ||||||
| 2026-02-17 | 13F | Capital Fund Management S.a. | 16.913 | 2.703 | ||||||
| 2026-01-21 | 13F | Aaron Wealth Advisors LLC | 5.372 | 19,91 | 858 | 54,87 | ||||
| 2026-02-17 | 13F | Laird Norton Trust Company, Llc | 1.544 | 247 | ||||||
| 2026-01-16 | 13F | Ronald Blue Trust, Inc. | 4.227 | 4,50 | 675 | 35,00 | ||||
| 2026-02-10 | 13F | Daiwa Securities Group Inc. | 530 | 10,42 | 0 | |||||
| 2026-01-26 | 13F/A | Phocas Financial Corp. | 73.365 | -0,24 | 11.724 | 28,80 | ||||
| 2026-01-27 | 13F | GHP Investment Advisors, Inc. | 47.561 | 2,98 | 7.600 | 32,96 | ||||
| 2026-02-09 | 13F | Quest Partners LLC | 345 | 88,52 | 55 | 150,00 | ||||
| 2026-02-17 | 13F | Utah Retirement Systems | 3.600 | 0,00 | 575 | 29,21 | ||||
| 2026-01-23 | 13F | Stephenson National Bank & Trust | 1.162 | 110,13 | 186 | 172,06 | ||||
| 2026-02-11 | 13F | Prestige Wealth Management Group LLC | 22 | 0,00 | 4 | 50,00 | ||||
| 2025-11-03 | 13F | Stonegate Investment Group, LLC | 2.961 | -6,71 | 366 | 16,19 | ||||
| 2026-02-11 | 13F | Syon Capital Llc | 3.831 | 612 | ||||||
| 2026-02-18 | 13F | GWM Advisors LLC | 2.659 | 425 | ||||||
| 2026-02-06 | 13F | Creative Financial Designs Inc /adv | 118 | 555,56 | 19 | 800,00 | ||||
| 2026-01-08 | 13F | Nordea Investment Management Ab | 599.842 | -62,43 | 96.605 | -50,67 | ||||
| 2026-02-13 | 13F | MAI Capital Management | 1.103 | 4,35 | 176 | 35,38 | ||||
| 2026-01-27 | 13F | Bayforest Capital Ltd | 0 | -100,00 | 0 | |||||
| 2026-02-17 | 13F | Algert Global Llc | 18.280 | 3 | ||||||
| 2026-02-13 | 13F | Mariner, LLC | 9.488 | -1,25 | 1.517 | 27,50 | ||||
| 2026-02-14 | 13F | Rockefeller Capital Management L.P. | 557 | 34,22 | 89 | 74,51 | ||||
| 2026-02-03 | 13F | SBI Securities Co., Ltd. | 22 | -45,00 | 4 | -25,00 | ||||
| 2026-01-26 | 13F | Whittier Trust Co | 977 | 0,00 | 179 | 33,58 | ||||
| 2026-02-17 | 13F | Silvercrest Asset Management Group Llc | 156.605 | -8,46 | 25.025 | 18,19 | ||||
| 2026-02-12 | 13F | Xponance, Inc. | 6.842 | -15,98 | 1.093 | 8,54 | ||||
| 2026-02-12 | 13F | Sit Investment Associates Inc | 0 | -100,00 | 0 | |||||
| 2026-02-17 | 13F | Tower Research Capital LLC (TRC) | 4.887 | -60,73 | 781 | -49,35 | ||||
| 2026-02-13 | 13F | Treasurer of the State of North Carolina | 28.143 | -6,82 | 4 | 33,33 | ||||
| 2025-11-14 | 13F | Point72 Europe (London) LLP | 2.057 | 255 | ||||||
| 2026-02-17 | 13F | Summit Trail Advisors, Llc | 14.172 | 4,20 | 2.265 | 34,52 | ||||
| 2026-02-06 | 13F | Bare Financial Services, Inc | 50 | 0,00 | 8 | 16,67 | ||||
| 2026-02-11 | 13F | Rise Advisors, LLC | 0 | -100,00 | 0 | |||||
| 2026-02-03 | 13F | Mitsubishi UFJ Kokusai Asset Management Co., Ltd. | 191 | 0,00 | 32 | 39,13 | ||||
| 2026-02-09 | 13F | Royce & Associates Lp | 616.605 | -25,45 | 98.533 | -3,75 | ||||
| 2026-01-27 | 13F | Forum Financial Management, LP | 2.323 | 0,09 | 371 | 29,27 | ||||
| 2026-02-17 | 13F | Jain Global LLC | 127.003 | -4,65 | 20.295 | 23,11 | ||||
| 2026-02-10 | 13F/A | Northwestern Mutual Wealth Management Co | 618 | 46,45 | 99 | 88,46 | ||||
| 2026-02-17 | 13F | Harvey Partners, LLC | 289.197 | 0,07 | 46.214 | 29,20 | ||||
| 2026-02-03 | 13F | Ethic Inc. | 16.366 | 19,27 | 2.615 | 54,00 | ||||
| 2026-02-23 | 13F | Mv Capital Management, Inc. | 16 | 0,00 | 3 | 100,00 | ||||
| 2026-01-29 | 13F | Nbc Securities, Inc. | 17 | 0,00 | 3 | 0,00 | ||||
| 2026-01-30 | 13F | State of New Jersey Common Pension Fund D | 23.156 | -1,33 | 3.700 | 27,41 | ||||
| 2026-02-05 | 13F | HFM Investment Advisors, LLC | 3 | 0,00 | 0 | |||||
| 2026-02-17 | 13F | Aequim Alternative Investments LP | 28.189 | 4.505 | ||||||
| 2026-01-21 | 13F | Stone House Investment Management, LLC | 1 | 0 | ||||||
| 2026-02-13 | 13F | Ceredex Value Advisors LLC | 186.535 | -6,79 | 29.808 | 20,34 | ||||
| 2026-02-12 | 13F | Rossby Financial, LCC | 62 | 10 | ||||||
| 2026-02-13 | 13F | Walleye Trading LLC | Put | 6.300 | -3,08 | 1.007 | 25,12 | |||
| 2026-02-13 | 13F | Walleye Trading LLC | Call | 3.500 | 75,00 | 559 | 126,32 | |||
| 2025-11-14 | 13F | Freestone Grove Partners LP | 0 | -100,00 | 0 | |||||
| 2026-02-06 | 13F | Global Retirement Partners, LLC | 165 | 560,00 | 26 | 766,67 | ||||
| 2026-02-17 | 13F | Aquatic Capital Management LLC | 14.369 | 2.296 | ||||||
| 2026-01-29 | 13F | UMA Financial Services, Inc. | 120 | 0,00 | 19 | 35,71 | ||||
| 2026-02-13 | 13F | Walleye Trading LLC | 1.349 | 216 | ||||||
| 2025-11-14 | 13F | Natixis | 0 | -100,00 | 0 | |||||
| 2026-02-17 | 13F | SageView Advisory Group, LLC | 117 | 19 | ||||||
| 2025-11-14 | 13F | Texas Permanent School Fund | 0 | -100,00 | 0 | |||||
| 2026-02-13 | 13F | Charles Schwab Investment Management Inc | 870.654 | 2,88 | 139.131 | 32,82 | ||||
| 2026-02-04 | 13F | Summit Wealth Group Llc / Co | 0 | -100,00 | 0 | -100,00 | ||||
| 2026-02-04 | 13F | Oregon Public Employees Retirement Fund | 13.397 | -0,58 | 2.141 | 28,37 | ||||
| 2026-01-26 | 13F | Bcm Advisors, Llc | 4.903 | 0,00 | 1.064 | 54,65 | ||||
| 2026-02-12 | 13F/A | Pinebridge Investments Llc | 5.301 | 847 | ||||||
| 2026-02-17 | 13F | Credit Agricole S A | 29.405 | 4.699 | ||||||
| 2026-01-29 | 13F | Cornerstone Investment Partners, LLC | 9.037 | 0,03 | 1.444 | 29,16 | ||||
| 2026-02-06 | 13F | ProShare Advisors LLC | 11.229 | 24,06 | 1.794 | 60,18 | ||||
| 2026-01-12 | 13F | Rialto Wealth Management, LLC | 11 | 10,00 | 2 | 0,00 | ||||
| 2026-02-06 | 13F | Vestmark Advisory Solutions, Inc. | 14.460 | 2.311 | ||||||
| 2026-01-27 | 13F | Wealth Enhancement Trust Services, Inc. | 34 | 5 | ||||||
| 2026-02-13 | 13F | Colony Group, LLC | 19.926 | 3.184 | ||||||
| 2026-02-06 | 13F | EverSource Wealth Advisors, LLC | 755 | 2,44 | 121 | 31,87 | ||||
| 2026-02-04 | 13F | Atlantic Union Bankshares Corp | 462 | 0,00 | 74 | 28,07 | ||||
| 2026-02-06 | 13F | Larson Financial Group LLC | 648 | 21,58 | 104 | 58,46 | ||||
| 2026-02-17 | 13F | Qube Research & Technologies Ltd | 4.358 | 696 | ||||||
| 2026-02-10 | 13F | Mutual Of America Capital Management Llc | 45.402 | -3,59 | 7.255 | 24,49 | ||||
| 2026-02-12 | 13F | Custom Index Systems, Llc | 2.888 | -39,34 | 462 | -21,73 | ||||
| 2026-02-17 | 13F | Expect Equity LLC | 24.015 | -23,74 | 3.838 | -1,54 | ||||
| 2026-02-18 | 13F | Vident Advisory, LLC | 2.190 | -9,02 | 350 | 17,51 | ||||
| 2026-02-11 | 13F | Cerity Partners LLC | 20.185 | 19,42 | 3.226 | 54,16 | ||||
| 2026-01-29 | 13F | DecisionPoint Financial, LLC | 8 | 0,00 | 1 | 0,00 | ||||
| 2026-01-07 | 13F | Aventura Private Wealth, LLC | 32 | 0,00 | 5 | 66,67 | ||||
| 2026-02-06 | 13F | HighTower Advisors, LLC | 6.111 | 6,95 | 977 | 38,05 | ||||
| 2026-02-10 | 13F | New Mexico Educational Retirement Board | 13.200 | 0,00 | 2 | 100,00 | ||||
| 2026-02-17 | 13F | Park West Asset Management LLC | 278.614 | 364,36 | 44.523 | 499,54 | ||||
| 2026-02-11 | 13F | Atlantic Private Wealth, LLC | 5 | 1 | ||||||
| 2026-02-13 | 13F | Kilter Group LLC | 4 | 1 | ||||||
| 2026-02-13 | 13F | Commerce Bank | 4.788 | -0,29 | 765 | 28,79 | ||||
| 2026-02-19 | 13F | Invesco Ltd. | 3.855.511 | 61,77 | 616.111 | 108,86 | ||||
| 2026-01-20 | 13F | AdvisorNet Financial, Inc | 115 | 0,00 | 18 | 28,57 | ||||
| 2026-01-28 | 13F | CAPROCK Group, Inc. | 1.378 | 220 | ||||||
| 2026-02-13 | 13F | Toroso Investments, LLC | 35.074 | 44,46 | 5.605 | 86,49 | ||||
| 2026-02-11 | 13F | Janney Montgomery Scott LLC | 16.473 | 5,84 | 3 | 100,00 | ||||
| 2026-01-29 | 13F | Pictet Asset Management Holding SA | 10.247 | 7,92 | 1.637 | 39,32 | ||||
| 2026-02-17 | 13F | Royal Bank Of Canada | 309.842 | -54,42 | 49.514 | -41,15 | ||||
| 2026-02-12 | 13F | Jane Street Group, Llc | 383.115 | 191,03 | 61.222 | 275,75 | ||||
| 2026-02-17 | 13F | PDT Partners, LLC | 10.070 | 0,00 | 1.609 | 29,13 | ||||
| 2026-02-02 | 13F | Strs Ohio | 80.803 | 9,79 | 12.912 | 41,75 | ||||
| 2026-02-12 | 13F | Jane Street Group, Llc | Put | 13.000 | 66,67 | 2.077 | 115,23 | |||
| 2026-02-17 | 13F | California State Teachers Retirement System | 63.854 | 2,62 | 10.204 | 32,49 | ||||
| 2026-02-12 | 13F | Jane Street Group, Llc | Call | 539.300 | -0,37 | 86.180 | 28,63 | |||
| 2026-02-17 | 13F | Man Group plc | 3.011 | 481 | ||||||
| 2025-11-04 | 13F | High Note Wealth, LLC | 0 | -100,00 | 0 | |||||
| 2026-02-13 | 13F | Arrowstreet Capital, Limited Partnership | 55.082 | 40,68 | 8.802 | 81,63 | ||||
| 2026-02-13 | 13F | Caxton Associates Llp | 7.811 | 1.248 | ||||||
| 2026-02-06 | 13F | Meiji Yasuda Asset Management Co Ltd. | 1.541 | 246 | ||||||
| 2026-01-29 | 13F | Inscription Capital, LLC | 1.638 | 262 | ||||||
| 2026-02-12 | 13F | Brinker Capital Investments, LLC | 16.358 | -5,84 | 2.614 | 21,58 | ||||
| 2026-01-06 | 13F | Investors Research Corp | 0 | -100,00 | 0 | |||||
| 2026-02-09 | 13F | Atlantic Trust, LLC | 82 | 0,00 | 13 | 30,00 | ||||
| 2026-02-20 | 13F | Kovitz Investment Group Partners, LLC | 0 | -100,00 | 0 | |||||
| 2026-02-12 | 13F | Penserra Capital Management LLC | 237.906 | -19,62 | 38 | 5,56 | ||||
| 2025-11-06 | 13F | Illinois Municipal Retirement Fund | 0 | -100,00 | 0 |