Grundlæggende statistik
| Institutionelle aktier (lange) | 20.463.599 - 102,62% (ex 13D/G) - change of -7,27MM shares -26,22% MRQ |
| Institutionel værdi (lang) | $ 3.813.531 USD ($1000) |
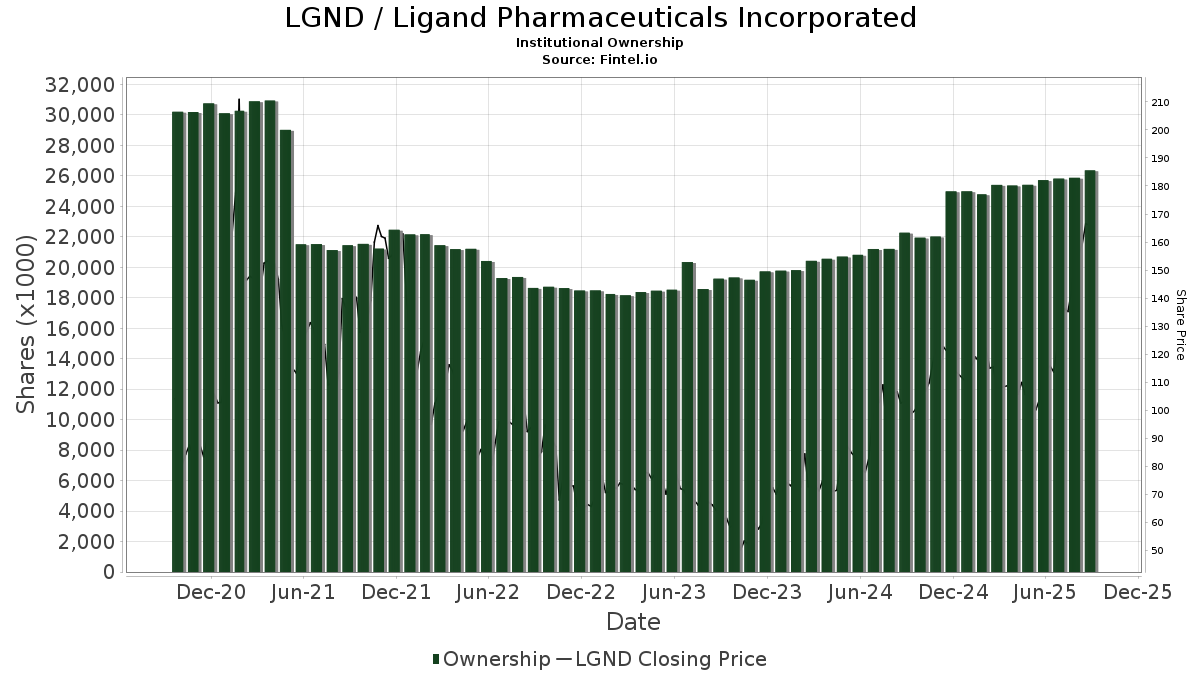
Institutionelt ejerskab og aktionærer
Ligand Pharmaceuticals Incorporated (US:LGND) har 349 institutionelle ejere og aktionærer, der har indsendt 13D/G- eller 13F-formularer til Securities Exchange Commission (SEC). Disse institutioner har i alt 20,463,599 aktier. Største aktionærer omfatter BlackRock, Inc., Vanguard Group Inc, Janus Henderson Group Plc, State Street Corp, Delaware Management Holdings, Inc., Fmr Llc, Chicago Capital, LLC, Invesco Ltd., Massachusetts Financial Services Co /ma/, and Stephens Investment Management Group LLC .
Ligand Pharmaceuticals Incorporated (NasdaqGM:LGND) institutionel ejerskabsstruktur viser aktuelle positioner i virksomheden efter institutioner og fonde, samt seneste ændringer i positionsstørrelse. Større aktionærer kan omfatte individuelle investorer, investeringsforeninger, hedgefonde eller institutioner. Skema 13D angiver, at investoren besidder (eller besidder) mere end 5 % af virksomheden og har til hensigt (eller har til hensigt at) aktivt at forfølge en ændring i forretningsstrategi. Skema 13G indikerer en passiv investering på over 5%.
The share price as of April 7, 2026 is 205,10 / share. Previously, on April 8, 2025, the share price was 96,67 / share. This represents an increase of 112,17% over that period.
Fondens stemningsscore
Fund Sentiment Score (fka Ownership Accumulation Score) finder de aktier, der bliver mest købt af fonde. Det er resultatet af en sofistikeret, multi-faktor kvantitativ model, der identificerer virksomheder med de højeste niveauer af institutionel akkumulering. Scoringsmodellen bruger en kombination af den samlede stigning i oplyste ejere, ændringerne i porteføljeallokeringer i disse ejere og andre målinger. Tallet går fra 0 til 100, hvor højere tal indikerer et højere niveau af akkumulering for sine jævnaldrende, og 50 er gennemsnittet.
Opdateringsfrekvens: Dagligt
Se Ownership Explorer, som giver en liste over højest rangerende virksomheder.
AI+ Ask Fintel’s AI assistant about Ligand Pharmaceuticals Incorporated.
Select a question to share a public post with an AI-crafted answer.
Thinking of good questions…
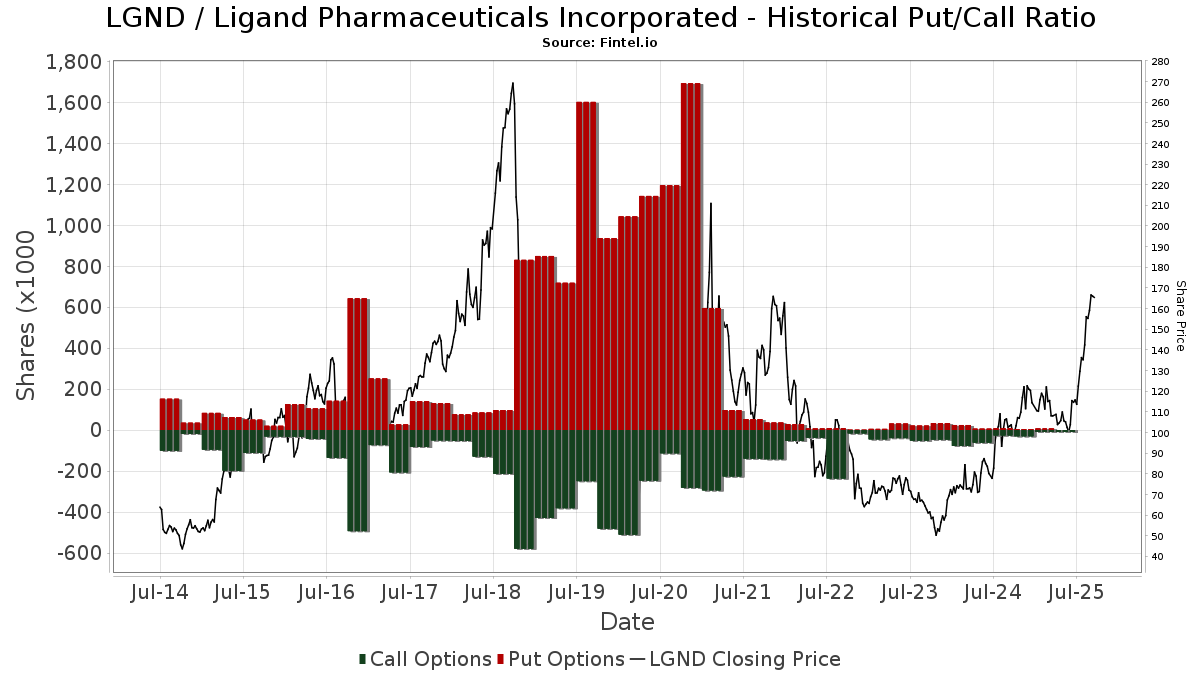
Institutionel Put/Call-forhold
Ud over at indberette standardaktie- og gældsudstedelser skal institutter med mere end 100 mill. aktiver under forvaltning også oplyse deres put- og call-optionsbeholdninger. Da salgsoptioner generelt indikerer negativ stemning, og købsoptioner indikerer positiv stemning, kan vi få en fornemmelse af den overordnede institutionelle stemning ved at plotte forholdet mellem put og kald. Diagrammet til højre viser det historiske put/call-forhold for dette instrument.
Brug af Put/Call Ratio som en indikator for investorernes stemning overvinder en af de vigtigste mangler ved at bruge totalt institutionelt ejerskab, som er, at en betydelig mængde af aktiver under forvaltning investeres passivt for at spore indekser. Passivt forvaltede fonde køber typisk ikke optioner, så indikatoren for put/call-forholdet følger mere nøje følelsen af aktivt forvaltede fonde.
13D/G-arkivering
Vi præsenterer 13D/G ansøgninger separat fra 13F ansøgninger på grund af den forskellige behandling af SEC. 13D/G-ansøgninger kan indgives af grupper af investorer (med én ledende), hvorimod 13F-ansøgninger ikke kan. Dette resulterer i situationer, hvor en investor kan indsende en 13D/G, der rapporterer én værdi for de samlede aktier (der repræsenterer alle de aktier, der ejes af investorgruppen), men derefter indsender en 13F, der rapporterer en anden værdi for de samlede aktier (der udelukkende repræsenterer deres egne) ejendomsret). Det betyder, at aktieejerskab af 13D/G-arkiver og 13F-arkiveringer ofte ikke er direkte sammenlignelige, så vi præsenterer dem separat.
Bemærk: Fra den 16. maj 2021 viser vi ikke længere ejere, der ikke har indsendt en 13D/G inden for det seneste år. Tidligere viste vi den fulde historie af 13D/G-arkiver. Generelt skal enheder, der er forpligtet til at indgive 13D/G-ansøgninger, indgive mindst årligt, før de indsender en afsluttende ansøgning. Dog forlader fonde nogle gange positioner uden at indsende en afsluttende ansøgning (dvs. de afvikler), så visning af den fulde historie resulterede nogle gange i forvirring om det nuværende ejerskab. For at undgå forvirring viser vi nu kun 'aktuelle' ejere - det vil sige - ejere, der har anmeldt inden for det seneste år.
Upgrade to unlock premium data.
| Fil dato | Form | Investor | Forrige Aktier |
Seneste Aktier |
Δ Aktier (Procent) |
Ejendomsret (Procent) |
Δ Ejerskab (Procent) |
|
|---|---|---|---|---|---|---|---|---|
| 2025-11-14 | JANUS HENDERSON GROUP PLC | 1,060,734 | 1,042,378 | -1.73 | 5.30 | -3.64 | ||
| 2025-10-17 | BlackRock, Inc. | 2,945,939 | 2,839,251 | -3.62 | 14.50 | -7.05 |
13F og NPORT arkivering
Detaljer om 13F-arkivering er gratis. Detaljer om NP-ansøgninger kræver et premium-medlemskab. Grønne rækker angiver nye positioner. Røde rækker angiver lukkede positioner. Klik på linket ikon for at se den fulde transaktionshistorik.
Opgrader
for at låse premium-data op og eksportere til Excel ![]() .
.
| Fil dato | Kilde | Investor | Type | Gennemsnitlig pris (Øst) |
Aktier | Δ Aktier (%) |
Rapporteret Værdi ($1000) |
Δ Værdi (%) |
Port Alloc (%) |
|
|---|---|---|---|---|---|---|---|---|---|---|
| 2026-02-17 | 13F | Aster Capital Management (DIFC) Ltd | 19 | 4 | ||||||
| 2026-02-17 | 13F | Gotham Asset Management, LLC | 9.346 | -1,36 | 1.767 | 5,30 | ||||
| 2026-02-17 | 13F | Canada Pension Plan Investment Board | 1.600 | -54,29 | 303 | -51,21 | ||||
| 2026-01-27 | 13F | Acuitas Investments, LLC | 0 | -100,00 | 0 | |||||
| 2026-02-12 | 13F | Loomis Sayles & Co L P | 382.677 | -4,46 | 72.353 | 1,97 | ||||
| 2025-11-13 | 13F | Mark Sheptoff Financial Planning, Llc | 0 | -100,00 | 0 | |||||
| 2026-02-02 | 13F | Equitable Trust Co | 5.035 | -14,88 | 952 | -9,17 | ||||
| 2026-02-11 | 13F | Franklin Resources Inc | 496.160 | 115,86 | 93.809 | 130,40 | ||||
| 2026-02-12 | 13F | EAM Investors, LLC | 21.092 | -30,10 | 3.988 | -24,17 | ||||
| 2026-02-09 | 13F | Fisher Asset Management, LLC | 130.858 | 20,13 | 24.741 | 28,22 | ||||
| 2026-02-13 | 13F | Public Sector Pension Investment Board | 0 | -100,00 | 0 | |||||
| 2026-02-12 | 13F | Advisors Asset Management, Inc. | 3.336 | -1,97 | 631 | 4,65 | ||||
| 2026-02-05 | 13F | Stephens Investment Management Group LLC | 501.040 | -9,65 | 94.732 | -3,56 | ||||
| 2026-02-10 | 13F | Future Fund LLC | 9.280 | 1.755 | ||||||
| 2026-02-13 | 13F | SRS Capital Advisors, Inc. | 50 | -24,24 | 9 | -18,18 | ||||
| 2026-02-06 | 13F | Legato Capital Management LLC | 26.241 | 61,02 | 4.961 | 71,90 | ||||
| 2026-02-09 | 13F | Legal & General Group Plc | 108.383 | 0,01 | 20.492 | 6,75 | ||||
| 2026-01-27 | 13F | Gf Fund Management Co. Ltd. | 386 | -8,53 | 73 | -2,70 | ||||
| 2026-02-13 | 13F | Jacobs Levy Equity Management, Inc | 126.754 | -0,73 | 23.965 | 5,96 | ||||
| 2026-02-17 | 13F | Jones Financial Companies Lllp | 63 | 0,00 | 12 | 10,00 | ||||
| 2026-01-26 | 13F | Whittier Trust Co Of Nevada Inc | 7 | 1 | ||||||
| 2026-02-10 | 13F | Intech Investment Management Llc | 7.585 | 24,10 | 1.434 | 32,53 | ||||
| 2026-02-04 | 13F | Swiss Life Asset Management Ltd | 1.823 | 345 | ||||||
| 2026-01-23 | 13F | Private Wealth Management Group, LLC | 10 | 0,00 | 2 | 0,00 | ||||
| 2026-02-13 | 13F | Citigroup Inc | 18.292 | -14,47 | 3.458 | -8,71 | ||||
| 2026-02-17 | 13F | Janus Henderson Group Plc | 995.400 | -4,51 | 188.199 | 1,92 | ||||
| 2026-02-12 | 13F | Granite Investment Partners, LLC | 57.926 | -5,99 | 10.952 | 0,34 | ||||
| 2026-02-13 | 13F | Squarepoint Ops LLC | 0 | -100,00 | 0 | |||||
| 2026-02-05 | 13F | Bessemer Group Inc | 23.510 | 3.051,47 | 4 | |||||
| 2026-02-17 | 13F | State Of Wisconsin Investment Board | 11.155 | -2,00 | 2.109 | 4,61 | ||||
| 2026-02-10 | 13F | Quantbot Technologies LP | 4.644 | 878 | ||||||
| 2026-04-07 | 13F | Comprehensive Financial Planning, Inc./PA | 66 | 0,00 | 13 | 8,33 | ||||
| 2026-02-05 | 13F | Atria Investments Llc | 3.966 | -22,77 | 750 | -17,60 | ||||
| 2026-02-13 | 13F | Financial Network Wealth Advisors LLC | 14 | -41,67 | 3 | -50,00 | ||||
| 2025-11-14 | 13F | Capstone Investment Advisors, Llc | 2.153 | -85,99 | 381 | -78,19 | ||||
| 2026-02-09 | 13F | Simplify Asset Management Inc. | 0 | -100,00 | 0 | |||||
| 2026-02-17 | 13F | Alpine Global Management, LLC | 1.500 | 284 | ||||||
| 2026-02-12 | 13F | Cornerstone Capital, Inc. | 5.117 | -1,35 | 968 | 5,34 | ||||
| 2026-02-17 | 13F | Nomura Holdings Inc | 116.417 | -4,08 | 22.011 | 2,38 | ||||
| 2026-02-12 | 13F | Jane Street Group, Llc | Put | 0 | -100,00 | 0 | -100,00 | |||
| 2026-02-13 | 13F | FORA Capital, LLC | 1.922 | 337 | ||||||
| 2026-02-10 | 13F | Bnp Paribas Arbitrage, Sa | 34.957 | 754,28 | 6.609 | 812,85 | ||||
| 2026-01-28 | 13F | Villere St Denis J & Co Llc | 202.452 | -27,68 | 38.278 | -22,81 | ||||
| 2026-02-13 | 13F | Baird Financial Group, Inc. | 12.823 | 2,07 | 2.424 | 8,94 | ||||
| 2026-01-23 | 13F | Assetmark, Inc | 6.191 | 4.933,33 | 1.171 | 5.471,43 | ||||
| 2026-01-23 | 13F | Rsm Us Wealth Management Llc | 1.404 | -13,23 | 267 | -6,64 | ||||
| 2026-02-17 | 13F | Delaware Management Holdings, Inc. | 644.093 | 121.779 | ||||||
| 2026-02-10 | 13F | Goldman Sachs Group Inc | 429.004 | 16,64 | 81.112 | 24,50 | ||||
| 2026-02-12 | 13F | EntryPoint Capital, LLC | 3.009 | 0,00 | 569 | 6,57 | ||||
| 2026-01-28 | 13F | Klp Kapitalforvaltning As | 4.200 | 7,69 | 794 | 15,07 | ||||
| 2026-02-10 | 13F | Connor, Clark & Lunn Investment Management Ltd. | 6.033 | 1.141 | ||||||
| 2026-02-03 | 13F | Farmers & Merchants Investments Inc | 13 | 0,00 | 2 | 0,00 | ||||
| 2026-01-22 | 13F | Maseco Llp | 275 | 0,00 | 52 | 6,25 | ||||
| 2026-02-06 | 13F | Profund Advisors Llc | 2.234 | -15,79 | 422 | -10,02 | ||||
| 2025-11-14 | 13F | Quarry LP | 0 | -100,00 | 0 | |||||
| 2026-02-17 | 13F | Equitable Holdings, Inc. | 9.605 | 8,70 | 1.816 | 16,04 | ||||
| 2026-02-10 | 13F | State of Wyoming | 894 | 169 | ||||||
| 2026-02-13 | 13F | State Street Corp | 751.205 | 0,25 | 142.030 | 7,00 | ||||
| 2026-02-17 | 13F | Wellington Management Group Llp | 8.426 | 1,32 | 1.593 | 8,15 | ||||
| 2026-02-11 | 13F | Group One Trading, L.p. | 2.953 | 768,53 | 558 | 830,00 | ||||
| 2026-02-18 | 13F | Garton & Associates Financial Advisors LLC | 25 | 5 | ||||||
| 2026-02-04 | 13F | Oregon Public Employees Retirement Fund | 4.485 | 0,97 | 848 | 7,76 | ||||
| 2026-02-06 | 13F | Tortoise Investment Management, LLC | 0 | -100,00 | 0 | |||||
| 2026-02-17 | 13F | Fmr Llc | 579.155 | 26,67 | 109.501 | 35,20 | ||||
| 2026-02-12 | 13F | Commonwealth Equity Services, Llc | 1.105 | 209 | ||||||
| 2026-02-17 | 13F | Northern Trust Corp | 250.640 | -5,76 | 47.389 | 0,59 | ||||
| 2026-01-14 | 13F | USA Financial Portformulas Corp | 227 | 43 | ||||||
| 2026-02-13 | 13F | Verition Fund Management LLC | 0 | -100,00 | 0 | |||||
| 2026-01-29 | 13F | Calamos Advisors LLC | 21.045 | 1,50 | 3.979 | 8,33 | ||||
| 2026-02-12 | 13F | Wedbush Securities Inc | 1.083 | -4,41 | 0 | |||||
| 2025-11-14 | 13F | Main Management ETF Advisors, LLC | 0 | -100,00 | 0 | |||||
| 2025-11-20 | 13F | Tweedy, Browne Co LLC | 0 | -100,00 | 0 | |||||
| 2026-02-11 | 13F | GW&K Investment Management, LLC | 117.432 | 265,43 | 22 | 340,00 | ||||
| 2026-02-17 | 13F | Susquehanna International Group, Llp | 5.409 | -38,58 | 1.023 | -34,49 | ||||
| 2026-02-13 | 13F | Prudential Financial Inc | 45.636 | 57,22 | 8.628 | 67,83 | ||||
| 2026-02-13 | 13F | Pinnacle Wealth Planning Services, Inc. | 365 | 69 | ||||||
| 2026-02-09 | 13F | Quest Partners LLC | 0 | -100,00 | 0 | -100,00 | ||||
| 2026-02-13 | 13F | Barclays Plc | 32.982 | -24,10 | 6.236 | 43,37 | ||||
| 2026-02-12 | 13F | Swiss National Bank | 38.600 | 3,21 | 7.298 | 10,16 | ||||
| 2026-02-13 | 13F | Victory Capital Management Inc | 256.410 | 0,63 | 48.479 | 7,41 | ||||
| 2026-02-12 | 13F | MetLife Investment Management, LLC | 10.655 | -3,95 | 2.015 | 2,49 | ||||
| 2026-02-06 | 13F | Creative Financial Designs Inc /adv | 10 | 0,00 | 2 | 0,00 | ||||
| 2026-01-26 | 13F | Cwm, Llc | 342 | 2,70 | 0 | |||||
| 2026-02-02 | 13F | Fifth Third Bancorp | 152 | 4,83 | 29 | 12,00 | ||||
| 2026-02-17 | 13F | Susquehanna International Group, Llp | Put | 2.800 | 47,37 | 529 | 57,44 | |||
| 2026-01-28 | 13F | DekaBank Deutsche Girozentrale | 11.185 | 0,00 | 1 | -100,00 | ||||
| 2026-02-17 | 13F | Susquehanna International Group, Llp | Call | 12.300 | 36,67 | 2.326 | 45,86 | |||
| 2025-10-30 | 13F | Twin Peaks Wealth Advisors, LLC | 0 | -100,00 | 0 | -100,00 | ||||
| 2026-01-12 | 13F | Abound Wealth Management | 1 | 0,00 | 0 | |||||
| 2025-11-14 | 13F | Texas Permanent School Fund | 0 | -100,00 | 0 | |||||
| 2026-01-28 | 13F | WPG Advisers, LLC | 11 | 0,00 | 2 | 100,00 | ||||
| 2026-01-22 | 13F | Massachusetts Financial Services Co /ma/ | 507.019 | -6,43 | 95.862 | -0,13 | ||||
| 2026-02-17 | 13F | Public Employees Retirement System Of Ohio | 8.285 | 0,00 | 1.566 | 6,75 | ||||
| 2026-01-27 | 13F | Jackson, Grant Investment Advisers, Inc. | 500 | 0,00 | 95 | 6,82 | ||||
| 2026-02-12 | 13F | Wealthspire Advisors, LLC | 0 | -100,00 | 0 | |||||
| 2026-02-17 | 13F | Bank Of America Corp /de/ | 120.169 | -1,83 | 22.720 | 4,78 | ||||
| 2026-02-06 | 13F | EverSource Wealth Advisors, LLC | 39 | -47,30 | 7 | -46,15 | ||||
| 2026-01-15 | 13F | Fortitude Family Office, LLC | 1 | 0 | ||||||
| 2026-01-28 | 13F | B. Metzler seel. Sohn & Co. AG | 6.879 | 1.301 | ||||||
| 2026-02-10 | 13F | Rothschild Investment Llc | 433 | 0,00 | 82 | 6,58 | ||||
| 2025-11-03 | 13F | Townsquare Capital Llc | 0 | -100,00 | 0 | |||||
| 2026-02-06 | 13F | Handelsbanken Fonder AB | 6.358 | 0,00 | 1 | 0,00 | ||||
| 2026-02-06 | 13F | Pnc Financial Services Group, Inc. | 2.240 | 22,40 | 424 | 30,56 | ||||
| 2026-02-17 | 13F | Freestone Grove Partners LP | 2.867 | 542 | ||||||
| 2025-10-14 | 13F | Exchange Traded Concepts, Llc | 0 | -100,00 | 0 | -100,00 | ||||
| 2026-02-17 | 13F | Private Capital Management, LLC | 208.891 | -8,04 | 39.495 | -1,85 | ||||
| 2026-04-07 | 13F | Signaturefd, Llc | 282 | 1,08 | 56 | 7,69 | ||||
| 2026-02-13 | 13F | American Century Companies Inc | 40.885 | -10,34 | 7.730 | -4,30 | ||||
| 2026-02-17 | 13F | Price T Rowe Associates Inc /md/ | 19.992 | 5,69 | 4 | 0,00 | ||||
| 2026-02-13 | 13F | First Trust Advisors Lp | 69.220 | 33,92 | 13.087 | 42,93 | ||||
| 2026-02-17 | 13F | Clark Capital Management Group, Inc. | 79.778 | -3,87 | 15.084 | 2,60 | ||||
| 2026-01-29 | 13F | Ashton Thomas Private Wealth, LLC | 2.103 | 4,42 | 398 | 11,52 | ||||
| 2026-02-17 | 13F | Quantinno Capital Management LP | 2.999 | 20,73 | 567 | 28,86 | ||||
| 2026-01-28 | 13F | Universal- Beteiligungs- und Servicegesellschaft mbH | 20.902 | -4,28 | 3.952 | 2,15 | ||||
| 2026-02-13 | 13F | JustInvest LLC | 1.391 | 4,12 | 263 | 11,02 | ||||
| 2026-01-29 | 13F | Comerica Bank | 5.432 | -16,88 | 1.027 | -11,24 | ||||
| 2026-02-13 | 13F | Mml Investors Services, Llc | 3.734 | -5,75 | 706 | 0,57 | ||||
| 2026-02-13 | 13F | Rhumbline Advisers | 56.736 | -4,52 | 10.727 | 1,92 | ||||
| 2026-02-13 | 13F | Charles Schwab Investment Management Inc | 184.284 | 1,08 | 34.843 | 7,89 | ||||
| 2026-02-11 | 13F | Parallel Advisors, LLC | 73 | 62,22 | 14 | 85,71 | ||||
| 2026-02-04 | 13F | Bailard, Inc. | 1.400 | 0,00 | 265 | 6,88 | ||||
| 2026-02-17 | 13F | Maryland State Retirement & Pension System | 2.872 | 2,17 | 543 | 9,26 | ||||
| 2026-01-30 | 13F | New York State Teachers Retirement System | 26.950 | 0,00 | 5 | 25,00 | ||||
| 2026-02-18 | 13F | State of Tennessee, Treasury Department | 5.119 | -34,29 | 983 | -28,72 | ||||
| 2026-01-16 | 13F | Longboard Asset Management, LP | 0 | -100,00 | 0 | |||||
| 2026-02-13 | 13F | Stifel Financial Corp | 18.722 | -8,73 | 3.540 | -2,59 | ||||
| 2026-02-12 | 13F | BRYN MAWR TRUST Co | 190 | -82,44 | 36 | -81,68 | ||||
| 2026-04-07 | 13F | City Center Advisors, LLC | 1.795 | 358 | ||||||
| 2026-02-11 | 13F | Picton Mahoney Asset Management | 11 | 0,00 | 2 | |||||
| 2026-02-02 | 13F | Principal Financial Group Inc | 93.830 | -0,82 | 17.740 | 5,87 | ||||
| 2026-01-29 | 13F | Teachers Retirement System Of The State Of Kentucky | 4.791 | -2,26 | 1 | |||||
| 2026-02-11 | 13F | Rise Advisors, LLC | 0 | -100,00 | 0 | |||||
| 2026-02-17 | 13F | Susquehanna Portfolio Strategies, LLC | 7.744 | 33,59 | 1.464 | 42,69 | ||||
| 2026-04-08 | 13F | Wealth Enhancement Advisory Services, Llc | 2.698 | 0,37 | 538 | 2,28 | ||||
| 2026-02-13 | 13F | Macquarie Group Ltd | 0 | -100,00 | 0 | |||||
| 2026-02-12 | 13F | Bank Of Montreal /can/ | 126.063 | 0,23 | 23.835 | 6,98 | ||||
| 2026-02-09 | 13F | Annis Gardner Whiting Capital Advisors, LLC | 4 | 0,00 | 1 | |||||
| 2026-02-17 | 13F | Royal Bank Of Canada | 108.796 | 5,12 | 20.569 | 12,20 | ||||
| 2026-02-17 | 13F | Persistent Asset Partners Ltd | 791 | 150 | ||||||
| 2026-02-03 | 13F | SBI Securities Co., Ltd. | 1 | 0,00 | 0 | |||||
| 2026-02-10 | 13F | CIBC World Markets Inc. | 25.630 | -56,66 | 4.846 | -53,74 | ||||
| 2026-02-13 | 13F | Great West Life Assurance Co /can/ | 16.750 | -28,11 | 3 | -25,00 | ||||
| 2026-02-13 | 13F | Umb Bank N A/mo | 89 | 17,11 | 17 | 23,08 | ||||
| 2026-02-13 | 13F | Greenline Wealth Management LLC | 16 | 3 | ||||||
| 2026-02-10 | 13F | Envestnet Asset Management Inc | 27.735 | -13,10 | 5.244 | -7,25 | ||||
| 2026-02-13 | 13F | Dynamic Technology Lab Private Ltd | 1.130 | 214 | ||||||
| 2026-01-27 | 13F | Bayforest Capital Ltd | 385 | 73 | ||||||
| 2026-02-03 | 13F | Cheviot Value Management, LLC | 200 | 0,00 | 38 | 2,70 | ||||
| 2026-02-17 | 13F | Alliancebernstein L.p. | 24.171 | 8,62 | 4.570 | 15,96 | ||||
| 2026-02-17 | 13F | Fred Alger Management, Llc | 3.762 | -35,89 | 711 | -31,57 | ||||
| 2026-02-11 | 13F | Fiera Capital Corp | 131.236 | 24.813 | ||||||
| 2026-02-13 | 13F | Ashford Capital Management Inc | 213.778 | -12,54 | 40.419 | -6,65 | ||||
| 2026-02-04 | 13F | LRI Investments, LLC | 50 | -12,28 | 9 | -10,00 | ||||
| 2026-02-17 | 13F | Elequin Capital Lp | 34 | 6 | ||||||
| 2026-02-11 | 13F | Deutsche Bank Ag\ | 307.871 | 0,11 | 58.209 | 6,85 | ||||
| 2026-01-16 | 13F | Louisiana State Employees Retirement System | 9.000 | 0,00 | 1.702 | 6,71 | ||||
| 2026-02-12 | 13F | Tripletail Wealth Management, LLC | 710 | 0,00 | 130 | 0,78 | ||||
| 2025-11-13 | 13F | Norges Bank | 0 | -100,00 | 0 | |||||
| 2026-02-17 | 13F | Granahan Investment Management Inc/ma | 0 | -100,00 | 0 | |||||
| 2026-04-06 | 13F | Versant Capital Management, Inc | 261 | 1,95 | 52 | 8,33 | ||||
| 2026-02-06 | 13F | Global Retirement Partners, LLC | 418 | 77,12 | 79 | 92,68 | ||||
| 2026-01-30 | 13F | Sigma Planning Corp | 3.000 | 567 | ||||||
| 2026-02-12 | 13F | Nuveen, LLC | 37.599 | -1,31 | 7.109 | 5,33 | ||||
| 2026-02-17 | 13F | Russell Investments Group, Ltd. | 138.464 | 1,71 | 26.179 | 8,56 | ||||
| 2026-01-21 | 13F | Flagship Harbor Advisors, Llc | 1 | 0 | ||||||
| 2026-02-06 | 13F | IFP Advisors, Inc | 342 | 1.040,00 | 65 | 1.180,00 | ||||
| 2026-02-12 | 13F | State Board Of Administration Of Florida Retirement System | 3.805 | 35,65 | 719 | 44,96 | ||||
| 2026-01-26 | 13F | KBC Group NV | 660 | 0,00 | 0 | |||||
| 2026-02-12 | 13F | Dimensional Fund Advisors Lp | 432.992 | -17,35 | 81.867 | -11,78 | ||||
| 2026-02-11 | 13F | Illinois Municipal Retirement Fund | 11.716 | 19,30 | 2.215 | 27,37 | ||||
| 2026-01-29 | 13F | St Germain D J Co Inc | 75 | 0,00 | 14 | 7,69 | ||||
| 2026-01-30 | 13F | Keybank National Association/oh | 1.477 | 11,14 | 279 | 18,72 | ||||
| 2026-02-12 | 13F | JPL Wealth Management, LLC | 0 | -100,00 | 0 | |||||
| 2026-01-09 | 13F | Congress Asset Management Co /ma | 480.063 | -28,06 | 90.766 | -23,22 | ||||
| 2026-01-27 | 13F | Evergreen Capital Management Llc | 2.276 | -0,96 | 430 | 5,65 | ||||
| 2026-02-04 | 13F | Virginia Retirement Systems Et Al | 1.500 | 284 | ||||||
| 2026-02-17 | 13F | Redwood Park Advisors LLC | 415 | 0,00 | 78 | 6,85 | ||||
| 2025-11-25 | 13F | Court Place Advisors, LLC | 5.158 | -1,90 | 914 | 52,93 | ||||
| 2026-01-09 | 13F | Park Place Capital Corp | 4 | 1 | ||||||
| 2026-02-13 | 13F | Mariner, LLC | 0 | -100,00 | 0 | |||||
| 2026-02-03 | 13F | Crossmark Global Holdings, Inc. | 2.264 | 25,22 | 428 | 33,75 | ||||
| 2026-02-11 | 13F | Cookson Peirce & Co Inc | 10.147 | 3,93 | 1.918 | 10,93 | ||||
| 2026-01-28 | 13F | Teacher Retirement System Of Texas | 2.901 | -38,67 | 548 | -34,53 | ||||
| 2026-02-13 | 13F | Ubs Asset Management Americas Inc | 363.584 | -3,46 | 68.743 | 3,04 | ||||
| 2026-02-17 | 13F | Blair William & Co/il | 8.474 | 1,05 | 1.602 | 7,88 | ||||
| 2025-11-14 | 13F | Binnacle Investments Inc | 5 | 0,00 | 1 | |||||
| 2026-02-10 | 13F | Blue Barn Wealth, LLC | 0 | -100,00 | 0 | |||||
| 2026-02-02 | 13F | Kornitzer Capital Management Inc /ks | 60.342 | -33,81 | 11.409 | -29,36 | ||||
| 2026-02-12 | 13F | Jane Street Group, Llc | Call | 8.200 | 412,50 | 1.550 | 447,70 | |||
| 2026-02-12 | 13F | Jane Street Group, Llc | 15.962 | -69,22 | 3.018 | -67,16 | ||||
| 2026-02-17 | 13F | MIRAE ASSET GLOBAL ETFS HOLDINGS Ltd. | 9.036 | 1,88 | 1.708 | 8,72 | ||||
| 2025-11-12 | 13F | Park Square Financial Group, LLC | 0 | -100,00 | 0 | |||||
| 2026-01-26 | 13F | Chicago Capital, LLC | 561.423 | -1,26 | 106.148 | 5,39 | ||||
| 2026-02-12 | 13F | Callan Family Office, LLC | 3.186 | 11,20 | 602 | 18,74 | ||||
| 2026-02-17 | 13F | Cim Investment Mangement Inc | 1.435 | 0,00 | 271 | 6,69 | ||||
| 2026-02-13 | 13F | Nfj Investment Group, Llc | 12.291 | -4,25 | 2.324 | 2,20 | ||||
| 2026-01-30 | 13F | Us Bancorp \de\ | 1.236 | -11,46 | 234 | -5,67 | ||||
| 2026-01-28 | 13F | Salomon & Ludwin, LLC | 144 | -0,69 | 28 | 3,85 | ||||
| 2026-02-02 | 13F | Truist Financial Corp | 1.679 | 0,00 | 317 | 6,73 | ||||
| 2026-02-13 | 13F | OMERS ADMINISTRATION Corp | 0 | -100,00 | 0 | |||||
| 2026-02-17 | 13F | Captrust Financial Advisors | 14.579 | -2,86 | 2.756 | 3,69 | ||||
| 2026-04-07 | 13F | Park Avenue Securities Llc | 0 | -100,00 | 0 | |||||
| 2026-04-07 | 13F | Farther Finance Advisors, LLC | 718 | 11,32 | 143 | 18,18 | ||||
| 2026-02-13 | 13F/A | Virtus ETF Advisers LLC | 0 | -100,00 | 0 | |||||
| 2025-11-06 | 13F | CBIZ Investment Advisory Services, LLC | 0 | -100,00 | 0 | |||||
| 2026-01-09 | 13F | SG Americas Securities, LLC | 10.817 | -7,72 | 2 | 0,00 | ||||
| 2026-02-17 | 13F | Raymond James Financial Inc | 18.756 | -0,55 | 3.546 | 6,17 | ||||
| 2026-02-06 | 13F | Bare Financial Services, Inc | 41 | 0,00 | 8 | 0,00 | ||||
| 2026-02-12 | 13F | BlackRock, Inc. | 2.940.231 | 1,93 | 555.909 | 8,80 | ||||
| 2025-10-22 | 13F | Geneos Wealth Management Inc. | 0 | -100,00 | 0 | -100,00 | ||||
| 2026-01-22 | 13F | Red Tortoise LLC | 35 | 0,00 | 7 | 0,00 | ||||
| 2026-02-11 | 13F | Simplex Trading, Llc | 2.055 | 24,77 | 389 | |||||
| 2026-02-05 | 13F | Thrivent Financial For Lutherans | 13.525 | -4,34 | 3 | 0,00 | ||||
| 2026-02-11 | 13F | LPL Financial LLC | 4.273 | 25,42 | 808 | 33,83 | ||||
| 2026-02-17 | 13F | XTX Topco Ltd | 7.717 | 1.459 | ||||||
| 2025-11-19 | 13F | Caitong International Asset Management Co., Ltd | 0 | -100,00 | 0 | |||||
| 2026-02-03 | 13F | Merrithew & Thorsten Inc | 129 | 0 | ||||||
| 2026-02-06 | 13F | Envestnet Portfolio Solutions, Inc. | 1.407 | -9,81 | 266 | -3,62 | ||||
| 2026-02-12 | 13F | Castleark Management Llc | 66.736 | 3,19 | 12.618 | 10,13 | ||||
| 2026-02-06 | 13F | GPS Wealth Strategies Group, LLC | 70 | 0,00 | 13 | 8,33 | ||||
| 2026-01-28 | 13F | Arizona State Retirement System | 5.506 | -3,40 | 1.041 | 3,17 | ||||
| 2026-02-13 | 13F | Caxton Associates Llp | 14.508 | 0,00 | 2.743 | 6,77 | ||||
| 2026-01-26 | 13F | Private Trust Co Na | 48 | 0,00 | 9 | 12,50 | ||||
| 2026-02-13 | 13F | Sei Investments Co | 46.368 | 69,08 | 8.767 | 80,48 | ||||
| 2026-02-11 | 13F | Zions Bancorporation, National Association /ut/ | 3 | 1 | ||||||
| 2025-11-14 | 13F | Tudor Investment Corp Et Al | 17.703 | |||||||
| 2026-02-10 | 13F | Hillsdale Investment Management Inc. | 40 | 8 | ||||||
| 2026-02-09 | 13F | Geode Capital Management, Llc | 493.589 | 4,09 | 93.336 | 11,10 | ||||
| 2026-02-13 | 13F | MAI Capital Management | 5.158 | 975 | ||||||
| 2026-04-06 | 13F | GAMMA Investing LLC | 644 | 2,71 | 129 | 8,47 | ||||
| 2026-02-19 | 13F | Invesco Ltd. | 516.464 | 36,52 | 97.648 | 45,72 | ||||
| 2026-02-17 | 13F/A | Uniplan Investment Counsel, Inc. | 42.364 | 0,45 | 8.010 | 7,20 | ||||
| 2026-02-13 | 13F | Manufacturers Life Insurance Company, The | 0 | -100,00 | 0 | |||||
| 2026-02-17 | 13F | ExodusPoint Capital Management, LP | 0 | -100,00 | 0 | -100,00 | ||||
| 2026-01-23 | 13F | Gibbs Wealth Management | 3.348 | -47,21 | 692 | -38,47 | ||||
| 2026-02-17 | 13F | DV Trading LLC | 1 | 0 | ||||||
| 2026-02-13 | 13F | Neuberger Berman Group LLC | 1.271 | -3,86 | 240 | 2,56 | ||||
| 2026-01-30 | 13F | NJ State Employees Deferred Compensation Plan | 0 | -100,00 | 0 | |||||
| 2026-01-30 | 13F | State of New Jersey Common Pension Fund D | 6.689 | -50,53 | 1.265 | -47,22 | ||||
| 2026-01-13 | 13F | Norden Group Llc | 1.321 | -36,95 | 250 | -32,88 | ||||
| 2026-02-17 | 13F | Creative Planning | 7.145 | 16,90 | 1.351 | 24,77 | ||||
| 2025-10-24 | 13F | Opal Wealth Advisors, LLC | 0 | -100,00 | 0 | |||||
| 2026-02-13 | 13F | BNP Paribas Asset Management Holding S.A. | 258 | 47,43 | 0 | |||||
| 2026-02-13 | 13F | Bridgewater Associates, LP | 4.207 | 226,63 | 795 | 248,68 | ||||
| 2026-01-22 | 13F | Richardson Financial Services Inc. | 228 | 8,57 | 43 | 16,22 | ||||
| 2026-02-10 | 13F | Root Financial Partners, LLC | 7 | 1 | ||||||
| 2026-02-12 | 13F | Ankerstar Wealth, LLC | 3 | 1 | ||||||
| 2026-02-13 | 13F | Rafferty Asset Management, LLC | 1.270 | -2,53 | 240 | 4,35 | ||||
| 2026-02-11 | 13F | Cerity Partners LLC | 1.531 | 5,44 | 289 | 12,45 | ||||
| 2026-02-17 | 13F | Ameriprise Financial Inc | 98.264 | -2,94 | 18.579 | 3,59 | ||||
| 2026-02-09 | 13F | Wcm Investment Management, Llc | 45.621 | 8.677 | ||||||
| 2026-02-06 | 13F | ProShare Advisors LLC | 4.640 | 7,88 | 877 | 15,24 | ||||
| 2026-02-13 | 13F | Cetera Trust Company, N.A | 2.880 | 0,00 | 545 | 6,67 | ||||
| 2026-02-13 | 13F | Edgestream Partners, L.P. | 22.889 | 109,47 | 4.328 | 123,62 | ||||
| 2026-02-13 | 13F | Arrowstreet Capital, Limited Partnership | 20.036 | 3.788 | ||||||
| 2026-02-13 | 13F | Martingale Asset Management L P | 15.322 | -17,05 | 2.897 | -11,49 | ||||
| 2026-02-17 | 13F | Scarborough Advisors, LLC | 33 | 0,00 | 6 | 20,00 | ||||
| 2026-02-06 | 13F | HighTower Advisors, LLC | 6.616 | 0,44 | 1.251 | 7,20 | ||||
| 2026-02-12 | 13F | Brinker Capital Investments, LLC | 3.501 | 195,19 | 662 | 214,76 | ||||
| 2026-02-02 | 13F | Danske Bank A/s | 100 | 0,00 | 19 | 5,88 | ||||
| 2026-01-13 | 13F | Mather Group, Llc. | 0 | -100,00 | 0 | |||||
| 2026-02-10 | 13F/A | Northwestern Mutual Wealth Management Co | 38 | 0,00 | 7 | 16,67 | ||||
| 2026-04-07 | 13F | CoreCap Advisors, LLC | 3 | 0,00 | 1 | |||||
| 2026-02-17 | 13F | Man Group plc | 3.450 | 652 | ||||||
| 2026-02-17 | 13F | Qube Research & Technologies Ltd | 15.393 | 323,82 | 2.910 | 352,57 | ||||
| 2026-02-11 | 13F | Manchester Capital Management LLC | 9 | 2 | ||||||
| 2026-01-29 | 13F | Pictet Asset Management Holding SA | 64.386 | -3,86 | 12.547 | 8,11 | ||||
| 2026-01-15 | 13F | BTC Capital Management, Inc. | 2.143 | -28,47 | 406 | -23,58 | ||||
| 2026-02-13 | 13F | Ranger Investment Management, L.P. | 269.983 | -1,95 | 51.046 | 4,66 | ||||
| 2026-02-17 | 13F | Cetera Investment Advisers | 3.335 | 111,61 | 631 | 125,81 | ||||
| 2026-02-17 | 13F | Trexquant Investment LP | 11.550 | -74,04 | 2.184 | -72,30 | ||||
| 2026-01-23 | 13F | State of Alaska, Department of Revenue | 13.649 | 25,31 | 3 | 100,00 | ||||
| 2026-02-11 | 13F | Janney Capital Management LLC | 2.393 | 1,83 | 0 | |||||
| 2026-02-17 | 13F | Quadrature Capital Ltd | 0 | -100,00 | 0 | |||||
| 2026-01-30 | 13F | Bogart Wealth, LLC | 18 | 0,00 | 3 | 0,00 | ||||
| 2026-02-09 | 13F | Hantz Financial Services, Inc. | 354 | 114,55 | 0 | |||||
| 2026-02-12 | 13F | Principal Securities, Inc. | 1.127 | 237,43 | 213 | 261,02 | ||||
| 2026-02-05 | 13F | Amalgamated Bank | 5.687 | 0,92 | 1 | |||||
| 2026-02-03 | 13F | F/M Investments LLC | 46.130 | -10,39 | 8.722 | -4,35 | ||||
| 2026-01-16 | 13F | Linden Thomas Advisory Services, LLC | 16.575 | -1,37 | 3.134 | 5,24 | ||||
| 2026-02-17 | 13F | Diadema Partners Lp | 2.987 | 565 | ||||||
| 2026-01-23 | 13F | Steigerwald, Gordon & Koch Inc. | 1.566 | 0,00 | 296 | 6,86 | ||||
| 2026-02-11 | 13F | Los Angeles Capital Management Llc | 10.321 | 118,02 | 1.931 | 130,31 | ||||
| 2026-01-23 | 13F | Avion Wealth | 9 | 0,00 | 0 | |||||
| 2026-01-21 | 13F | Portside Wealth Group, LLC | 2.833 | -32,84 | 536 | -28,38 | ||||
| 2026-02-17 | 13F | Citadel Advisors Llc | Call | 7.400 | 8,82 | 1.399 | 16,20 | |||
| 2026-02-17 | 13F | Citadel Advisors Llc | 2.066 | -84,48 | 391 | -83,46 | ||||
| 2026-02-17 | 13F | Citadel Advisors Llc | Put | 3.500 | 662 | |||||
| 2026-02-02 | 13F | Oppenheimer Asset Management Inc. | 1.183 | 224 | ||||||
| 2026-02-17 | 13F | Susquehanna Fundamental Investments, Llc | 1.184 | 0,00 | 224 | 6,70 | ||||
| 2026-02-02 | 13F | Montag A & Associates Inc | 0 | -100,00 | 0 | |||||
| 2026-02-17 | 13F | Advisory Services Network, LLC | 0 | -100,00 | 0 | |||||
| 2026-02-09 | 13F | Huntington National Bank | 701 | 17.425,00 | 133 | |||||
| 2026-01-30 | 13F | Torren Management, LLC | 123 | 23 | ||||||
| 2026-02-14 | 13F | Rockefeller Capital Management L.P. | 727 | -1,89 | 137 | 4,58 | ||||
| 2026-02-17 | 13F | Aquatic Capital Management LLC | 0 | -100,00 | 0 | |||||
| 2026-02-12 | 13F | Voya Investment Management Llc | 3.447 | 0,00 | 652 | 6,72 | ||||
| 2026-02-02 | 13F | CENTRAL TRUST Co | 112 | 7,69 | 21 | 16,67 | ||||
| 2025-11-12 | 13F | Advantage Alpha Capital Partners LP | 0 | -100,00 | 0 | -100,00 | ||||
| 2026-02-13 | 13F | Parkside Financial Bank & Trust | 69 | 16,95 | 13 | 30,00 | ||||
| 2026-02-13 | 13F | Fiduciary Trust Co | 2.143 | 26,21 | 405 | 35,00 | ||||
| 2026-02-18 | 13F | Mackenzie Financial Corp | 1.195 | 2,22 | 227 | 9,18 | ||||
| 2026-02-17 | 13F | Guggenheim Capital Llc | 5.257 | 994 | ||||||
| 2026-02-17 | 13F | CWM Advisors, LLC | 0 | 0 | ||||||
| 2026-01-30 | 13F | Moody Aldrich Partners Llc | 19.581 | -24,35 | 3.702 | -19,26 | ||||
| 2026-01-12 | 13F | Contravisory Investment Management, Inc. | 2.036 | -6,65 | 385 | -0,52 | ||||
| 2026-02-09 | 13F | Atlantic Trust, LLC | 0 | -100,00 | 0 | |||||
| 2026-02-19 | 13F | CI Private Wealth, LLC | 12.388 | 339,29 | 1.347 | 169,74 | ||||
| 2026-02-13 | 13F | Essex Investment Management Co Llc | 60.020 | -1,84 | 11.348 | 4,77 | ||||
| 2026-02-12 | 13F | CIBC Private Wealth Group, LLC | 183 | 22,82 | 35 | 30,77 | ||||
| 2026-02-13 | 13F | Smartleaf Asset Management LLC | 305 | 12,55 | 58 | 26,09 | ||||
| 2026-02-17 | 13F | Glenmede Trust Co Na | 4.482 | 847 | ||||||
| 2026-01-27 | 13F | First Horizon Corp | 574 | 114,18 | 109 | 129,79 | ||||
| 2026-02-17 | 13F | Summit Global Investments | 2.417 | 67,61 | 0 | |||||
| 2026-02-06 | 13F | Larson Financial Group LLC | 49 | 0,00 | 9 | 12,50 | ||||
| 2026-02-12 | 13F | Steward Partners Investment Advisory, Llc | 129 | 22,86 | 24 | 33,33 | ||||
| 2026-02-17 | 13F | Amundi | 3.033 | -9,62 | 573 | -6,37 | ||||
| 2026-02-13 | 13F | Public Employees Retirement Association Of Colorado | 2.555 | 0,00 | 0 | |||||
| 2025-11-14 | 13F | Skopos Labs, Inc. | 0 | -100,00 | 0 | |||||
| 2026-02-04 | 13F | Pier 88 Investment Partners Llc | 8.520 | 18,33 | 1.611 | 26,27 | ||||
| 2026-02-05 | 13F | Baader Bank INC | 0 | -100,00 | 0 | |||||
| 2026-02-17 | 13F | Voloridge Investment Management, Llc | 12.038 | 40,04 | 2.276 | 49,54 | ||||
| 2026-01-23 | 13F | Optima Capital Llc | 3 | 1 | ||||||
| 2026-02-05 | 13F | Isthmus Partners, Llc | 24.708 | -16,24 | 4.672 | -10,60 | ||||
| 2026-01-14 | 13F | Jfs Wealth Advisors, Llc | 3 | 1 | ||||||
| 2026-01-15 | 13F | Allspring Global Investments Holdings, LLC | 71.818 | -33,76 | 13.653 | -29,68 | ||||
| 2026-01-29 | 13F | UBS Group AG | 143.067 | 27,75 | 27.050 | 36,36 | ||||
| 2025-11-07 | 13F | CenterBook Partners LP | 6.434 | -52,22 | 1.140 | -25,56 | ||||
| 2026-01-27 | 13F | Zurcher Kantonalbank (Zurich Cantonalbank) | 3.193 | 0,00 | 604 | 6,73 | ||||
| 2026-02-17 | 13F | Aqr Capital Management Llc | 5.158 | 12,52 | 975 | 20,07 | ||||
| 2026-02-17 | 13F | Optiver Holding B.V. | 0 | -100,00 | 0 | |||||
| 2026-02-11 | 13F | Ameritas Investment Partners, Inc. | 1.594 | 301 | ||||||
| 2026-01-29 | 13F | Supplemental Annuity Collective Trust of NJ | 1.290 | -32,11 | 244 | -27,68 | ||||
| 2026-01-07 | 13F | Massmutual Trust Co Fsb/adv | 150 | 4,17 | 28 | 12,00 | ||||
| 2026-02-09 | 13F | Keating Financial Advisory Services, Inc. | 8 | 2 | ||||||
| 2026-02-05 | 13F | Stephens Inc /ar/ | 1.656 | -0,24 | 313 | 6,46 | ||||
| 2026-02-03 | 13F | International Assets Investment Management, Llc | 13 | 2 | ||||||
| 2026-02-06 | 13F | Covestor Ltd | 343 | 17.050,00 | 0 | |||||
| 2026-02-10 | 13F | Lido Advisors, LLC | 2.232 | 1,41 | 401 | 3,08 | ||||
| 2026-02-11 | 13F | Erste Asset Management GmbH | 4.300 | 839 | ||||||
| 2026-02-13 | 13F | Rice Hall James & Associates, Llc | 279.627 | -5,05 | 52.869 | 1,35 | ||||
| 2026-02-26 | 13F | TD Capital Management LLC | 1 | 0 | ||||||
| 2026-02-13 | 13F | Police & Firemen's Retirement System of New Jersey | 5.232 | -0,91 | 989 | 5,78 | ||||
| 2026-02-17 | 13F | California State Teachers Retirement System | 18.797 | 2,65 | 3.554 | 9,56 | ||||
| 2026-02-17 | 13F | Cape Investment Advisory, Inc. | 8 | 2 | ||||||
| 2026-02-13 | 13F | Transamerica Financial Advisors, Inc. | 80 | 15 | ||||||
| 2026-02-10 | 13F | Daiwa Securities Group Inc. | 58 | -7,94 | 0 | |||||
| 2026-02-02 | 13F | Millstone Evans Group, LLC | 133 | 0,00 | 25 | 8,70 | ||||
| 2026-02-10 | 13F | Commonwealth Of Pennsylvania Public School Empls Retrmt Sys | 4.873 | -2,36 | 921 | 4,19 | ||||
| 2026-02-13 | 13F | Morgan Stanley | 193.402 | 2,49 | 36.567 | 9,39 | ||||
| 2026-01-21 | 13F | Yousif Capital Management, Llc | 5.402 | -12,22 | 1.062 | -2,66 | ||||
| 2026-01-26 | 13F | CWC Advisors, LLC. | 3.531 | -0,20 | 668 | 6,55 | ||||
| 2026-02-12 | 13F | DRW Securities, LLC | 0 | -100,00 | 0 | |||||
| 2026-02-17 | 13F | D. E. Shaw & Co., Inc. | Call | 7.600 | 375,00 | 1.437 | 407,42 | |||
| 2026-01-30 | 13F | American Capital Advisory, LLC | 4 | 1 | ||||||
| 2026-02-17 | 13F | D. E. Shaw & Co., Inc. | 36.551 | 108,70 | 6.911 | 122,76 | ||||
| 2026-02-10 | 13F | One Capital Management, LLC | 9.287 | 1.756 | ||||||
| 2026-02-13 | 13F | Kestra Advisory Services, LLC | 166 | 31 | ||||||
| 2026-01-15 | 13F | Nisa Investment Advisors, Llc | 730 | -8,52 | 138 | -2,13 | ||||
| 2026-01-21 | 13F | Sound Income Strategies, LLC | 57 | 11 | ||||||
| 2026-02-05 | 13F | Dana Investment Advisors, Inc. | 69.396 | -4,49 | 13.121 | 1,94 | ||||
| 2026-01-16 | 13F | Standard Life Aberdeen plc | 119.309 | -37,12 | 22.558 | -32,89 | ||||
| 2026-04-07 | 13F | Retirement Wealth Solutions LLC | 21 | -63,16 | 4 | -60,00 | ||||
| 2025-11-21 | 13F/A | CIBC Bancorp USA Inc. | 2.034 | 360 | ||||||
| 2026-01-16 | 13F | Ronald Blue Trust, Inc. | 3 | 1 | ||||||
| 2026-02-17 | 13F | Driehaus Capital Management Llc | 122.326 | -24,86 | 23.128 | -19,80 | ||||
| 2025-11-13 | 13F | Glenmede Investment Management, LP | 4.739 | 839 | ||||||
| 2026-02-17 | 13F | Kemnay Advisory Services Inc. | 44 | 8 | ||||||
| 2026-02-09 | 13F | Lisanti Capital Growth, LLC | 43.742 | 47,39 | 8.270 | 57,34 | ||||
| 2026-02-11 | 13F | Allianz Asset Management GmbH | 1.080 | 204 | ||||||
| 2026-02-11 | 13F | Jpmorgan Chase & Co | 56.590 | 42,48 | 10.699 | 52,08 | ||||
| 2026-02-12 | 13F | Quadrant Capital Group Llc | 5.658 | 0,00 | 1.070 | 6,69 | ||||
| 2026-02-09 | 13F | Jackson Creek Investment Advisors LLC | 8.313 | -42,55 | 2 | -50,00 | ||||
| 2026-02-12 | 13F | Cibc World Markets Corp | 1.283 | -45,43 | 243 | -9,36 | ||||
| 2026-01-29 | 13F | Cornerstone Investment Partners, LLC | 1.698 | 0,06 | 321 | 7,00 | ||||
| 2026-01-08 | 13F | Nordea Investment Management Ab | 53.725 | -11,93 | 10.189 | -4,62 | ||||
| 2026-02-10 | 13F | Mutual Of America Capital Management Llc | 2.250 | 2,51 | 425 | 9,54 | ||||
| 2026-01-29 | 13F | Vanguard Group Inc | 2.073.892 | -0,12 | 392.111 | 6,61 | ||||
| 2026-02-17 | 13F | Virtus Investment Advisers, Inc. | 3.605 | -7,16 | 682 | -0,87 | ||||
| 2026-02-17 | 13F | Point72 Asset Management, L.P. | 0 | -100,00 | 0 | |||||
| 2026-01-29 | 13F | Impax Asset Management Group plc | 165.208 | -17,48 | 31.236 | -11,92 | ||||
| 2026-02-05 | 13F | Allworth Financial LP | 551 | 1,47 | 104 | 8,33 | ||||
| 2026-02-10 | 13F | Acadian Asset Management Llc | 933 | 0 | ||||||
| 2026-02-12 | 13F | Xponance, Inc. | 1.536 | 2,47 | 290 | 9,43 | ||||
| 2026-02-12 | 13F | Brown Brothers Harriman & Co | 46 | 9 | ||||||
| 2026-02-09 | 13F | Penn Capital Management Co Inc | 98.848 | -7,86 | 18.710 | -1,65 | ||||
| 2026-02-13 | 13F | Sterling Capital Management LLC | 1.004 | -14,55 | 190 | -9,13 | ||||
| 2026-02-13 | 13F | Commerce Bank | 1.308 | 247 | ||||||
| 2026-02-10 | 13F | 1492 Capital Management LLC | 1.876 | 0,00 | 355 | 6,63 | ||||
| 2026-02-13 | 13F | Wells Fargo & Company/mn | 132.636 | 15,16 | 25.077 | 22,91 | ||||
| 2026-01-12 | 13F | Rialto Wealth Management, LLC | 1 | 0 | ||||||
| 2026-02-17 | 13F | Tower Research Capital LLC (TRC) | 757 | 79,38 | 143 | 93,24 | ||||
| 2026-01-26 | 13F | Mirae Asset Global Investments Co., Ltd. | 956 | 26,12 | 181 | 34,33 | ||||
| 2026-01-16 | 13F | Crewe Advisors LLC | 142 | 6,77 | 27 | 13,04 | ||||
| 2026-02-04 | 13F | Pacer Advisors, Inc. | 0 | -100,00 | 0 | |||||
| 2026-01-29 | 13F | China Universal Asset Management Co., Ltd. | 3.207 | -6,64 | 606 | -0,33 | ||||
| 2026-02-10 | 13F | Bank of New York Mellon Corp | 122.265 | -4,11 | 23.117 | 2,35 | ||||
| 2026-01-21 | 13F | Westfuller Advisors, LLC | 16 | 0,00 | 3 | 50,00 | ||||
| 2026-01-21 | 13F | Sowell Financial Services LLC | 1.328 | 251 | ||||||
| 2026-01-14 | 13F | Woodstock Corp | 20.005 | -0,10 | 3.782 | 6,63 | ||||
| 2026-02-17 | 13F | Advisor Group Holdings, Inc. | 59.405 | -41,03 | 11.232 | -36,95 | ||||
| 2026-02-11 | 13F | Gilpin Wealth Management, Llc | 2 | 0 | ||||||
| 2026-01-16 | 13F | Ellsworth Advisors, LLC | 6.565 | -6,73 | 1.287 | -0,23 | ||||
| 2026-02-12 | 13F | Integrated Quantitative Investments LLC | 3.635 | 687 | ||||||
| 2026-02-12 | 13F | New York State Common Retirement Fund | 107.530 | 24,27 | 20.331 | 32,64 | ||||
| 2026-02-02 | 13F | Strs Ohio | 6.100 | -6,15 | 1.153 | 0,17 |
Other Listings
| DE:LGDN | 168,00 € |