Grundlæggende statistik
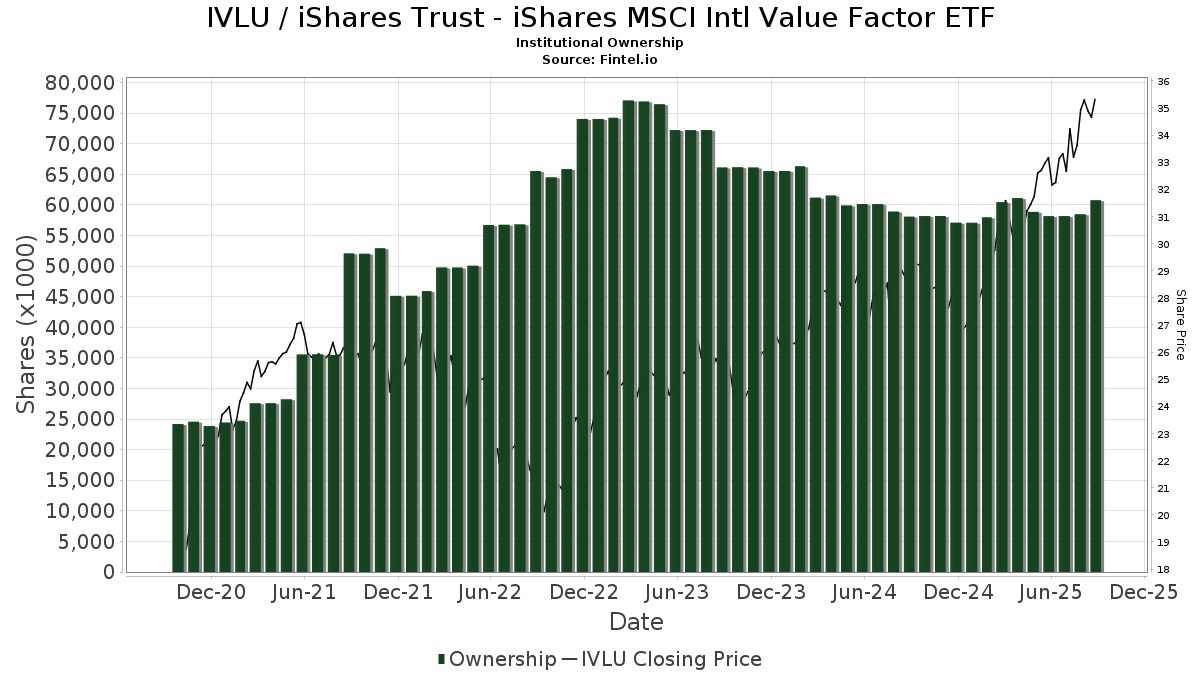
| Institutionelle ejere | 289 total, 289 long only, 0 short only, 0 long/short - change of 8,21% MRQ |
| Gennemsnitlig porteføljeallokering | 0.3108 % - change of 3,76% MRQ |
| Institutionelle aktier (lange) | 60.740.617 (ex 13D/G) - change of 2,59MM shares 4,45% MRQ |
| Institutionel værdi (lang) | $ 1.968.370 USD ($1000) |
Institutionelt ejerskab og aktionærer
iShares Trust - iShares MSCI Intl Value Factor ETF (US:IVLU) har 289 institutionelle ejere og aktionærer, der har indsendt 13D/G- eller 13F-formularer til Securities Exchange Commission (SEC). Disse institutioner har i alt 60,740,617 aktier. Største aktionærer omfatter Northwestern Mutual Wealth Management Co, Fmr Llc, Jpmorgan Chase & Co, Envestnet Asset Management Inc, Mercer Global Advisors Inc /adv, Colony Group, LLC, Bank Of America Corp /de/, Kathmere Capital Management, LLC, Morgan Stanley, and Armbruster Capital Management, Inc. .
iShares Trust - iShares MSCI Intl Value Factor ETF (ARCA:IVLU) institutionel ejerskabsstruktur viser aktuelle positioner i virksomheden efter institutioner og fonde, samt seneste ændringer i positionsstørrelse. Større aktionærer kan omfatte individuelle investorer, investeringsforeninger, hedgefonde eller institutioner. Skema 13D angiver, at investoren besidder (eller besidder) mere end 5 % af virksomheden og har til hensigt (eller har til hensigt at) aktivt at forfølge en ændring i forretningsstrategi. Skema 13G indikerer en passiv investering på over 5%.
The share price as of September 16, 2025 is 35,63 / share. Previously, on September 17, 2024, the share price was 28,90 / share. This represents an increase of 23,29% over that period.
Fondens stemningsscore
Fund Sentiment Score (fka Ownership Accumulation Score) finder de aktier, der bliver mest købt af fonde. Det er resultatet af en sofistikeret, multi-faktor kvantitativ model, der identificerer virksomheder med de højeste niveauer af institutionel akkumulering. Scoringsmodellen bruger en kombination af den samlede stigning i oplyste ejere, ændringerne i porteføljeallokeringer i disse ejere og andre målinger. Tallet går fra 0 til 100, hvor højere tal indikerer et højere niveau af akkumulering for sine jævnaldrende, og 50 er gennemsnittet.
Opdateringsfrekvens: Dagligt
Se Ownership Explorer, som giver en liste over højest rangerende virksomheder.
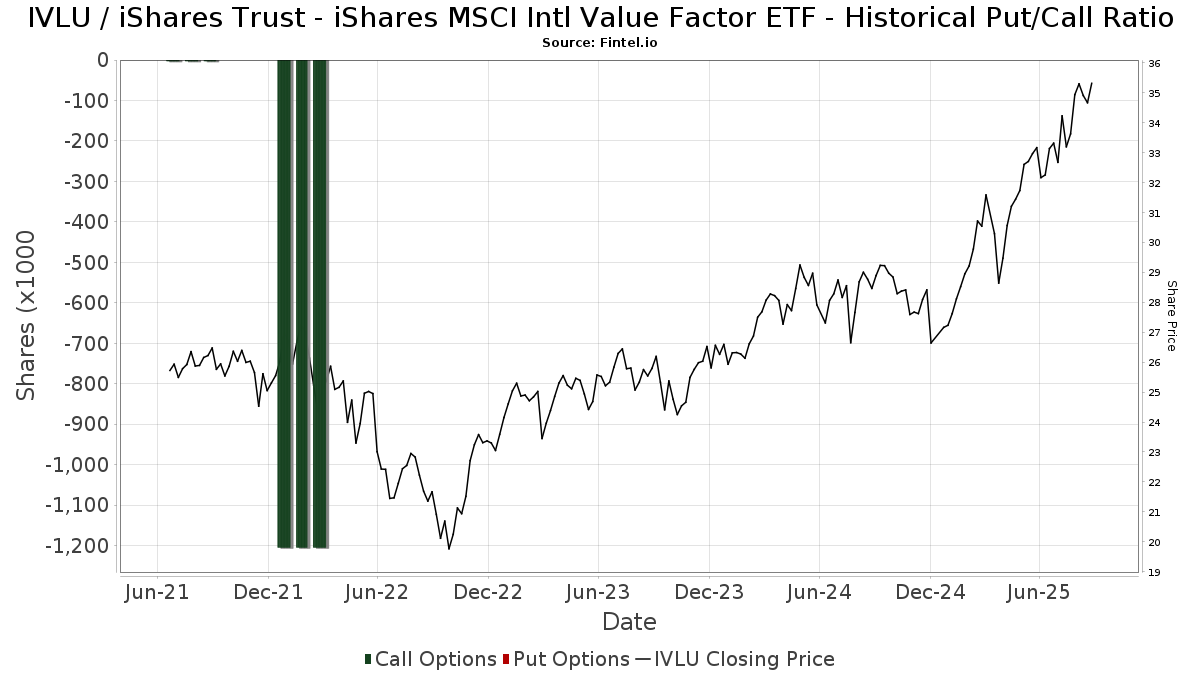
Institutionel Put/Call-forhold
Ud over at indberette standardaktie- og gældsudstedelser skal institutter med mere end 100 mill. aktiver under forvaltning også oplyse deres put- og call-optionsbeholdninger. Da salgsoptioner generelt indikerer negativ stemning, og købsoptioner indikerer positiv stemning, kan vi få en fornemmelse af den overordnede institutionelle stemning ved at plotte forholdet mellem put og kald. Diagrammet til højre viser det historiske put/call-forhold for dette instrument.
Brug af Put/Call Ratio som en indikator for investorernes stemning overvinder en af de vigtigste mangler ved at bruge totalt institutionelt ejerskab, som er, at en betydelig mængde af aktiver under forvaltning investeres passivt for at spore indekser. Passivt forvaltede fonde køber typisk ikke optioner, så indikatoren for put/call-forholdet følger mere nøje følelsen af aktivt forvaltede fonde.
13D/G-arkivering
Vi præsenterer 13D/G ansøgninger separat fra 13F ansøgninger på grund af den forskellige behandling af SEC. 13D/G-ansøgninger kan indgives af grupper af investorer (med én ledende), hvorimod 13F-ansøgninger ikke kan. Dette resulterer i situationer, hvor en investor kan indsende en 13D/G, der rapporterer én værdi for de samlede aktier (der repræsenterer alle de aktier, der ejes af investorgruppen), men derefter indsender en 13F, der rapporterer en anden værdi for de samlede aktier (der udelukkende repræsenterer deres egne) ejendomsret). Det betyder, at aktieejerskab af 13D/G-arkiver og 13F-arkiveringer ofte ikke er direkte sammenlignelige, så vi præsenterer dem separat.
Bemærk: Fra den 16. maj 2021 viser vi ikke længere ejere, der ikke har indsendt en 13D/G inden for det seneste år. Tidligere viste vi den fulde historie af 13D/G-arkiver. Generelt skal enheder, der er forpligtet til at indgive 13D/G-ansøgninger, indgive mindst årligt, før de indsender en afsluttende ansøgning. Dog forlader fonde nogle gange positioner uden at indsende en afsluttende ansøgning (dvs. de afvikler), så visning af den fulde historie resulterede nogle gange i forvirring om det nuværende ejerskab. For at undgå forvirring viser vi nu kun 'aktuelle' ejere - det vil sige - ejere, der har anmeldt inden for det seneste år.
Upgrade to unlock premium data.
13F og NPORT arkivering
Detaljer om 13F-arkivering er gratis. Detaljer om NP-ansøgninger kræver et premium-medlemskab. Grønne rækker angiver nye positioner. Røde rækker angiver lukkede positioner. Klik på linket ikon for at se den fulde transaktionshistorik.
Opgrader
for at låse premium-data op og eksportere til Excel ![]() .
.
| Fil dato | Kilde | Investor | Type | Gennemsnitlig pris (Øst) |
Aktier | Δ Aktier (%) |
Rapporteret Værdi ($1000) |
Δ Værdi (%) |
Port Alloc (%) |
|
|---|---|---|---|---|---|---|---|---|---|---|
| 2025-08-13 | 13F | Custom Index Systems, Llc | 49.452 | 63,65 | 1.626 | 77,70 | ||||
| 2025-08-14 | 13F | Beaird Harris Wealth Management, LLC | 0 | -100,00 | 0 | |||||
| 2025-08-15 | 13F | High Falls Advisors, Inc | 29.045 | 4,78 | 955 | 13,69 | ||||
| 2025-07-09 | 13F | Breakwater Capital Group | 35.877 | 15,39 | 1.180 | 25,16 | ||||
| 2025-07-17 | 13F | PMG Wealth Management, Inc. | 85.601 | 2.815 | ||||||
| 2025-07-25 | 13F | Envestnet Portfolio Solutions, Inc. | 10.253 | 13,34 | 337 | 22,99 | ||||
| 2025-07-16 | 13F | Plancorp, LLC | 324.507 | -4,36 | 10.673 | 3,78 | ||||
| 2025-08-13 | 13F | Transce3nd, LLC | 62 | 0,00 | 2 | 100,00 | ||||
| 2025-07-14 | 13F | U.S. Capital Wealth Advisors, LLC | 95.225 | 11,31 | 3.132 | 20,75 | ||||
| 2025-08-14 | 13F | Mml Investors Services, Llc | 205.122 | 974,95 | 7 | |||||
| 2025-08-14 | 13F | Goldman Sachs Group Inc | 142.439 | -41,22 | 4.685 | -36,22 | ||||
| 2025-07-14 | 13F | Painted Porch Advisors LLC | 264 | 0,00 | 9 | 0,00 | ||||
| 2025-08-14 | 13F | GWM Advisors LLC | 153.148 | 43,68 | 5.037 | 55,94 | ||||
| 2025-08-12 | 13F | BlackRock, Inc. | 167.887 | -35,47 | 5.522 | -29,98 | ||||
| 2025-07-30 | 13F | Eqis Capital Management, Inc. | 364.176 | -55,90 | 11.978 | -52,14 | ||||
| 2025-08-14 | 13F | Ancora Advisors, LLC | 556 | 0,00 | 18 | 12,50 | ||||
| 2025-07-08 | 13F | Parallel Advisors, LLC | 160.957 | 12,35 | 5.294 | 21,90 | ||||
| 2025-08-13 | 13F | Per Stirling Capital Management, LLC. | 302.477 | 1,45 | 9.948 | 10,09 | ||||
| 2025-08-14 | 13F | Fmr Llc | 7.528.185 | -7,81 | 247.602 | 0,04 | ||||
| 2025-07-18 | 13F | Magnolia Private Wealth, LLC | 7.827 | 0,00 | 257 | 8,44 | ||||
| 2025-08-14 | 13F | Css Llc/il | 70.300 | 0,00 | 2.312 | 8,54 | ||||
| 2025-07-25 | 13F | Ackerman Capital Advisors, LLC | 413.433 | 0,60 | 13.598 | 9,16 | ||||
| 2025-08-14 | 13F | UBS Group AG | 117.546 | 8,02 | 3.866 | 17,22 | ||||
| 2025-07-16 | 13F | Ironwood Wealth Management, Inc. | 277.158 | -0,67 | 9.141 | 17,16 | ||||
| 2025-07-21 | 13F | Ascent Group, LLC | 30.424 | 50,94 | 1.001 | 63,93 | ||||
| 2025-08-14 | 13F | Mariner, LLC | 52.099 | 57,88 | 1.714 | 71,30 | ||||
| 2025-06-17 | 13F | Howe & Rusling Inc | 0 | -100,00 | 0 | |||||
| 2025-08-01 | 13F | Ashton Thomas Private Wealth, LLC | 289.990 | -1,12 | 9.538 | 7,30 | ||||
| 2025-07-17 | 13F | Halbert Hargrove Global Advisors, Llc | 0 | -100,00 | 0 | |||||
| 2025-08-13 | 13F | Cerity Partners LLC | 76.309 | -0,87 | 2.510 | 7,54 | ||||
| 2025-08-14 | 13F/A | Bank Julius Baer & Co. Ltd, Zurich | 49.428 | 0,00 | 1.626 | 8,48 | ||||
| 2025-07-23 | 13F | Elevate Wealth Advisory, Inc | 4.151 | 2,29 | 137 | 11,48 | ||||
| 2025-08-13 | 13F | SCS Capital Management LLC | 116.839 | 0,70 | 3.843 | 9,27 | ||||
| 2025-08-26 | NP | EVTTX - The E-Valuator Conservative/Moderate (30%-50%) RMS Fund Service Class Shares | 5.478 | 180 | ||||||
| 2025-08-07 | 13F | Addison Advisors LLC | 925 | 0,00 | 30 | 7,14 | ||||
| 2025-07-25 | 13F | Sequoia Financial Advisors, LLC | 51.975 | 0,38 | 1.709 | 8,92 | ||||
| 2025-04-14 | 13F | Pallas Capital Advisors LLC | 0 | -100,00 | 0 | |||||
| 2025-08-06 | 13F | Commonwealth Equity Services, Llc | 50.534 | 52,01 | 2 | 0,00 | ||||
| 2025-08-13 | 13F | Russell Investments Group, Ltd. | 599 | 31,36 | 20 | 46,15 | ||||
| 2025-08-15 | 13F | Kestra Advisory Services, LLC | 142.308 | -29,37 | 4.681 | -23,37 | ||||
| 2025-08-12 | 13F | Atlas Capital Advisors Llc | 290.051 | -2,54 | 9.540 | 5,75 | ||||
| 2025-07-31 | 13F | Glass Jacobson Investment Advisors llc | 5.152 | 2,20 | 169 | 24,26 | ||||
| 2025-08-07 | 13F | Allworth Financial LP | 52.064 | 0,28 | 1.712 | 6,93 | ||||
| 2025-08-26 | NP | EVMLX - The E-Valuator Moderate (50%-70%) RMS Fund Service Class Shares | 28.955 | 952 | ||||||
| 2025-08-15 | 13F | Semmax Financial Advisors Inc. | 78 | 0,00 | 3 | 0,00 | ||||
| 2025-08-07 | 13F | Vise Technologies, Inc. | 54.008 | 1.776 | ||||||
| 2025-08-07 | 13F | Shared Vision Wealth Group LLC | 26.536 | -0,81 | 874 | 7,90 | ||||
| 2025-08-14 | 13F | Two Sigma Securities, Llc | 0 | -100,00 | 0 | |||||
| 2025-04-30 | 13F | Stratos Wealth Advisors, LLC | 0 | -100,00 | 0 | -100,00 | ||||
| 2025-05-13 | 13F | Thrivent Financial For Lutherans | 0 | -100,00 | 0 | |||||
| 2025-08-01 | 13F | Envestnet Asset Management Inc | 4.292.836 | -0,49 | 141.191 | 7,98 | ||||
| 2025-08-14 | 13F | Aqr Capital Management Llc | 17.355 | 11,25 | 571 | 20,76 | ||||
| 2025-08-11 | 13F | Morling Financial Advisors, LLC | 397 | 0,00 | 13 | 8,33 | ||||
| 2025-08-13 | 13F | Elgethun Capital Management | 6.129 | -2,34 | 202 | 5,79 | ||||
| 2025-07-09 | 13F | Fiduciary Alliance LLC | 7.128 | 0,35 | 234 | 8,84 | ||||
| 2025-05-13 | 13F | United Capital Financial Advisers, Llc | 0 | -100,00 | 0 | |||||
| 2025-08-14 | 13F | Wells Fargo & Company/mn | 1.419 | -62,37 | 47 | -59,65 | ||||
| 2025-07-28 | 13F | RCS Financial Planning, LLC | 9.708 | 19,45 | 319 | 29,67 | ||||
| 2025-07-24 | 13F | MA Private Wealth | 30.890 | 0,00 | 1.016 | 8,44 | ||||
| 2025-08-12 | 13F | Steward Partners Investment Advisory, Llc | 894 | 0,00 | 29 | 7,41 | ||||
| 2025-08-14 | 13F | Jane Street Group, Llc | 73.317 | 20,97 | 2.411 | 31,32 | ||||
| 2025-08-06 | 13F | Valued Wealth Advisors LLC | 69.182 | 17,14 | 2.275 | 27,09 | ||||
| 2025-08-26 | NP | EVAGX - The E-Valuator Aggressive Growth (85%-99%) RMS Fund Service Class Shares | 86.872 | 2.857 | ||||||
| 2025-08-13 | 13F | EverSource Wealth Advisors, LLC | 10.321 | 7,02 | 339 | 16,10 | ||||
| 2025-07-17 | 13F | One Wealth Advisors, LLC | 310.429 | 3,26 | 10.210 | 12,05 | ||||
| 2025-07-31 | 13F | CNB Bank | 590 | 0,00 | 19 | 11,76 | ||||
| 2025-07-22 | 13F | Merit Financial Group, LLC | 8.936 | -18,82 | 294 | -12,01 | ||||
| 2025-07-31 | 13F | Buckingham Strategic Partners | 284.373 | -6,13 | 9.353 | 1,86 | ||||
| 2025-07-15 | 13F | Mather Group, Llc. | 0 | -100,00 | 0 | |||||
| 2025-07-16 | 13F | West Branch Capital LLC | 350 | 0,00 | 12 | 10,00 | ||||
| 2025-07-07 | 13F | Versant Capital Management, Inc | 1.946 | -10,53 | 64 | -1,54 | ||||
| 2025-07-23 | 13F | Valmark Advisers, Inc. | 7.118 | -19,36 | 234 | -12,36 | ||||
| 2025-07-09 | 13F | Affinity Capital Advisors, LLC | 30.906 | -1,07 | 1.016 | 13,01 | ||||
| 2025-04-30 | 13F | Pineridge Advisors LLC | 0 | -100,00 | 0 | |||||
| 2025-07-02 | 13F | Dentgroup LLC | 14.065 | 7,43 | 463 | 16,67 | ||||
| 2025-08-08 | 13F | Compass Wealth Management LLC | 0 | -100,00 | 0 | |||||
| 2025-08-06 | 13F | Hoxton Planning & Management, LLC | 24.201 | 46,39 | 796 | 58,68 | ||||
| 2025-07-22 | 13F | Firethorn Wealth Partners, Llc | 27.291 | 4,76 | 898 | 13,69 | ||||
| 2025-08-11 | 13F | Wealthgarden F.s. Llc | 21.830 | -0,35 | 719 | 8,45 | ||||
| 2025-07-30 | 13F | Cullen/frost Bankers, Inc. | 237 | 2,16 | 8 | 0,00 | ||||
| 2025-08-04 | 13F | Mayflower Financial Advisors, LLC | 62.342 | 33,37 | 2.050 | 44,77 | ||||
| 2025-08-06 | 13F | Prospera Financial Services Inc | 7.679 | 253 | ||||||
| 2025-04-29 | 13F | Lee Danner & Bass Inc | 0 | -100,00 | 0 | |||||
| 2025-07-31 | 13F | Red Wave Investments LLC | 60.155 | -0,38 | 1.978 | 8,09 | ||||
| 2025-08-13 | 13F | Flow Traders U.s. Llc | 82.883 | 3 | ||||||
| 2025-07-17 | 13F | KWB Wealth | 462.200 | -22,02 | 14.009 | -12,81 | ||||
| 2025-08-07 | 13F | Nwam Llc | 17.050 | 14,54 | 566 | 25,28 | ||||
| 2025-08-08 | 13F | Cornerstone Advisors Asset Management, Inc | 35.433 | 0,00 | 1.165 | 8,57 | ||||
| 2025-08-14 | 13F | Royal Bank Of Canada | 49.252 | -67,26 | 1.620 | -64,47 | ||||
| 2025-07-14 | 13F | Capstone Wealth Management, LLC | 12.811 | 1,53 | 421 | 10,21 | ||||
| 2025-07-31 | 13F | Cambridge Investment Research Advisors, Inc. | 28.323 | 105,11 | 1 | |||||
| 2025-07-21 | 13F | Empirical Financial Services, LLC d.b.a. Empirical Wealth Management | 24.425 | -1,60 | 803 | 6,78 | ||||
| 2025-07-22 | 13F | Kickstand Ventures, Llc. | 96.305 | 5,66 | 3.167 | 14,66 | ||||
| 2025-08-14 | 13F | Becker Capital Management Inc | 8.255 | 272 | ||||||
| 2025-07-22 | 13F | Duncan Williams Asset Management, LLC | 96.305 | 3.167 | ||||||
| 2025-08-07 | 13F | Weil Company, Inc. | 0 | -100,00 | 0 | |||||
| 2025-07-25 | 13F | Cwm, Llc | 14.649 | 4,98 | 0 | |||||
| 2025-07-30 | 13F | Cookson Peirce & Co Inc | 7.793 | 256 | ||||||
| 2025-08-11 | 13F | Theory Financial Llc | 8.377 | 2,48 | 276 | 11,34 | ||||
| 2025-08-13 | 13F | Vance Wealth, Inc. | 88.682 | 9,14 | 2.917 | 18,44 | ||||
| 2025-07-14 | 13F | Abound Wealth Management | 35 | 0,00 | 1 | 0,00 | ||||
| 2025-07-15 | 13F | Well Done, LLC | 10.341 | 0,00 | 340 | 21,43 | ||||
| 2025-07-07 | 13F | Accelerate Investment Advisors LLC | 8.567 | 282 | ||||||
| 2025-07-09 | 13F | Baron Wealth Management LLC | 8.052 | 265 | ||||||
| 2025-07-15 | 13F | Financial Management Professionals, Inc. | 262 | 0,00 | 9 | 14,29 | ||||
| 2025-08-14 | 13F | Gerber Kawasaki Wealth & Investment Management | 0 | -100,00 | 0 | |||||
| 2025-07-31 | 13F | Wealthfront Advisers Llc | 15.545 | 110,04 | 511 | 128,13 | ||||
| 2025-08-01 | 13F | First Command Advisory Services, Inc. | 259 | 0,00 | 9 | 14,29 | ||||
| 2025-08-05 | 13F | Bank Of Montreal /can/ | 549 | 0,00 | 18 | 12,50 | ||||
| 2025-08-05 | 13F | Simplex Trading, Llc | 99 | 0 | ||||||
| 2025-08-12 | 13F | Choate Investment Advisors | 8.552 | 281 | ||||||
| 2025-07-28 | 13F | Cypress Wealth Services, LLC | 103.317 | 5,34 | 3.398 | 14,33 | ||||
| 2025-08-04 | 13F | Spire Wealth Management | 7.060 | 0,73 | 232 | 9,43 | ||||
| 2025-08-14 | 13F | Keebeck Wealth Management, LLC | 162.903 | 0,17 | 5.358 | 8,68 | ||||
| 2025-08-14 | 13F | Clayton Partners LLC | 81.474 | -9,70 | 2.680 | -2,01 | ||||
| 2025-07-21 | 13F | Ameritas Advisory Services, LLC | 1.788 | 59 | ||||||
| 2025-08-11 | 13F | Bell Investment Advisors, Inc | 63.634 | 25,07 | 2.093 | 35,67 | ||||
| 2025-08-14 | 13F/A | Rockefeller Capital Management L.P. | 165.699 | 31,16 | 5.450 | 42,31 | ||||
| 2025-05-02 | 13F | MB Generational Wealth, LLC | 14.338 | 71,18 | 435 | 91,19 | ||||
| 2025-08-08 | 13F | Smithfield Trust Co | 3.546 | 0,00 | 0 | |||||
| 2025-08-05 | 13F | Fullcircle Wealth Llc | 12.050 | 401 | ||||||
| 2025-08-13 | 13F | Kilter Group LLC | 1 | 0 | ||||||
| 2025-04-22 | 13F | Duncker Streett & Co Inc | 0 | -100,00 | 0 | |||||
| 2025-07-03 | 13F | Collective Family Office Llc | 12.078 | 0,00 | 397 | 8,47 | ||||
| 2025-08-11 | 13F | Angeles Investment Advisors, LLC | 77.680 | 0,00 | 2.555 | 8,50 | ||||
| 2025-08-14 | 13F | Ameriprise Financial Inc | 245.405 | 33,08 | 8.068 | 44,34 | ||||
| 2025-07-25 | 13F | Stonehage Fleming Financial Services Holdings Ltd | 86.144 | 0,00 | 2.833 | 8,50 | ||||
| 2025-08-12 | 13F | Change Path, LLC | 13.619 | 4,75 | 448 | 13,45 | ||||
| 2025-07-07 | 13F | Kings Path Partners LLC | 23 | 1 | ||||||
| 2025-08-11 | 13F | TRUE Private Wealth Advisors | 0 | -100,00 | 0 | |||||
| 2025-05-09 | 13F | Emerald Investment Partners, Llc | 0 | -100,00 | 0 | |||||
| 2025-07-17 | 13F | Beacon Capital Management, LLC | 239 | 0,00 | 8 | 0,00 | ||||
| 2025-08-14 | 13F | Bnp Paribas Arbitrage, Sa | 0 | -100,00 | 0 | |||||
| 2025-07-18 | 13F | SOA Wealth Advisors, LLC. | 4.883 | 161 | ||||||
| 2025-08-14 | 13F | McIlrath & Eck, LLC | 637 | 2,25 | 21 | 11,11 | ||||
| 2025-07-08 | 13F | Braun-Bostich & Associates Inc. | 23.852 | 0,56 | 784 | 9,19 | ||||
| 2025-08-06 | 13F | Nicholas Hoffman & Company, LLC. | 20.913 | 0,00 | 688 | 8,53 | ||||
| 2025-08-14 | 13F | Wiley Bros.-aintree Capital, Llc | 98.503 | 22,30 | 3.240 | 31,61 | ||||
| 2025-08-26 | NP | EVGLX - The E-Valuator Growth (70%-85%) RMS Fund Service Class Shares | 79.741 | 2.623 | ||||||
| 2025-07-21 | 13F | Ameriflex Group, Inc. | 26.385 | -7,14 | 860 | -0,23 | ||||
| 2025-05-15 | 13F | Lgl Partners, Llc | 0 | -100,00 | 0 | |||||
| 2025-07-25 | 13F | Hemington Wealth Management | 46.045 | 0,12 | 2 | 0,00 | ||||
| 2025-08-05 | 13F | Dunhill Financial, LLC | 25 | 0,00 | 1 | |||||
| 2025-07-31 | 13F | TSA Wealth Managment LLC | 84.464 | 23,00 | 2.778 | 33,49 | ||||
| 2025-08-05 | 13F | 5T Wealth, LLC | 8.948 | 6,28 | 294 | 15,29 | ||||
| 2025-08-12 | 13F | Pathstone Holdings, LLC | 33.565 | 63,18 | 1.104 | 73,16 | ||||
| 2025-08-19 | 13F | Advisory Services Network, LLC | 30.143 | -0,23 | 993 | 8,42 | ||||
| 2025-09-04 | 13F/A | Advisor Group Holdings, Inc. | 349.012 | 191,62 | 11.476 | 216,40 | ||||
| 2025-07-24 | 13F | Trust Co Of Toledo Na /oh/ | 223 | 7 | ||||||
| 2025-07-24 | 13F | Us Bancorp \de\ | 18.744 | 27,29 | 616 | 38,12 | ||||
| 2025-05-08 | 13F | Glassman Wealth Services | 0 | -100,00 | 0 | |||||
| 2025-07-28 | 13F | Rosenberg Matthew Hamilton | 9.160 | -0,69 | 301 | 7,89 | ||||
| 2025-05-12 | 13F | Kohmann Bosshard Financial Services, LLC | 0 | -100,00 | 0 | |||||
| 2025-08-13 | 13F | GeoWealth Management, LLC | 0 | -100,00 | 0 | |||||
| 2025-08-15 | 13F | Captrust Financial Advisors | 36.850 | -0,56 | 1.212 | 7,84 | ||||
| 2025-07-08 | 13F | Peirce Capital Management, LLC | 18.124 | 16,21 | 596 | 26,27 | ||||
| 2025-07-29 | 13F | ShoreHaven Wealth Partners, LLC | 134.637 | 0,30 | 4.428 | 8,85 | ||||
| 2025-08-06 | 13F | Stokes Family Office, LLC | 40.628 | -3,68 | 1.336 | 4,54 | ||||
| 2025-08-14 | 13F | Sunbelt Securities, Inc. | 1.315 | 36 | ||||||
| 2025-07-17 | 13F | Lauterbach Financial Advisors, LLC | 15.823 | 2,24 | 520 | 10,87 | ||||
| 2025-08-12 | 13F | J.w. Cole Advisors, Inc. | 18.751 | 617 | ||||||
| 2025-08-13 | 13F | VestGen Advisors, LLC | 20.441 | 2,16 | 672 | 10,89 | ||||
| 2025-07-11 | 13F | My Legacy Advisors, LLC | 24.065 | -1,86 | 801 | 7,67 | ||||
| 2025-07-22 | 13F | Unique Wealth, Llc | 21.638 | 73,63 | 712 | 88,59 | ||||
| 2025-05-05 | 13F | Hazlett, Burt & Watson, Inc. | 0 | -100,00 | 0 | |||||
| 2025-08-12 | 13F | O'shaughnessy Asset Management, Llc | 14.746 | -1,03 | 485 | 7,32 | ||||
| 2025-09-12 | 13F/A | Valeo Financial Advisors, LLC | 10.322 | -10,41 | 339 | -2,87 | ||||
| 2025-06-27 | NP | SUNAMERICA SERIES TRUST - SA BlackRock Multi-Factor 70/30 Portfolio Class 1 | 47.067 | 2,00 | 1.468 | 13,01 | ||||
| 2025-07-29 | 13F | Systelligence, LLC | 207.542 | 6.826 | ||||||
| 2025-05-15 | 13F | Chilton Investment Co Llc | 0 | -100,00 | 0 | -100,00 | ||||
| 2025-08-13 | 13F | Northern Trust Corp | 19.687 | 1,00 | 648 | 9,66 | ||||
| 2025-07-28 | 13F | WealthPlan Investment Management, LLC | 64.335 | 2.116 | ||||||
| 2025-07-14 | 13F | Foster Group, Inc. | 402.642 | -0,50 | 13.243 | 7,97 | ||||
| 2025-07-16 | 13F | Squire Investment Management Company, LLC | 36.526 | -32,50 | 1.201 | -26,77 | ||||
| 2025-08-14 | 13F | CoreFirst Bank & Trust | 184.435 | 1,23 | 6.066 | 9,85 | ||||
| 2025-04-10 | 13F | Watershed Private Wealth Llc | 0 | -100,00 | 0 | |||||
| 2025-08-13 | 13F | Balance Wealth, LLC | 72.393 | 1,09 | 2.381 | 9,72 | ||||
| 2025-08-11 | 13F | Invenio Wealth Partners Llc | 16.801 | 553 | ||||||
| 2025-08-14 | 13F | Stifel Financial Corp | 263.649 | 148,23 | 8.671 | 169,37 | ||||
| 2025-05-14 | 13F | Huntington National Bank | 6 | -68,75 | ||||||
| 2025-07-29 | 13F | Horst & Graben Wealth Management LLC | 42.557 | -13,39 | 1.400 | -6,04 | ||||
| 2025-08-06 | 13F | SOUTH STATE Corp | 924 | 0,00 | 30 | 7,14 | ||||
| 2025-07-11 | 13F | Prosperity Planning, Inc. | 146.455 | -3,36 | 4.817 | 4,86 | ||||
| 2025-07-14 | 13F | Park Avenue Securities Llc | 304.441 | 10 | ||||||
| 2025-08-06 | 13F | AE Wealth Management LLC | 1.728 | -21,35 | 57 | -15,15 | ||||
| 2025-08-07 | 13F | Tacita Capital Inc | 84.810 | 1,22 | 2.789 | 9,85 | ||||
| 2025-08-12 | 13F | MAI Capital Management | 109 | 34,57 | 4 | 50,00 | ||||
| 2025-08-14 | 13F | Comerica Bank | 15.498 | 0,00 | 510 | 8,53 | ||||
| 2025-07-25 | 13F | ONE Advisory Partners, LLC | 72.192 | 0,00 | 2.470 | 12,89 | ||||
| 2025-07-10 | 13F | Trust Point Inc. | 338.038 | 26,99 | 11.118 | 37,80 | ||||
| 2025-07-24 | 13F | Cyndeo Wealth Partners, LLC | 7.999 | 3,28 | 263 | 12,39 | ||||
| 2025-07-28 | 13F | Sagespring Wealth Partners, Llc | 125.195 | 23,98 | 4.118 | 34,54 | ||||
| 2025-08-06 | 13F | Quadrant Private Wealth Management, LLC | 7.174 | 236 | ||||||
| 2025-07-16 | 13F | Kathmere Capital Management, LLC | 808.775 | 0,34 | 26.601 | 8,88 | ||||
| 2025-07-22 | 13F | Sutton Place Investors Llc | 7.423 | 5,02 | 244 | 14,02 | ||||
| 2025-08-12 | 13F | Proequities, Inc. | 0 | 0 | ||||||
| 2025-08-14 | 13F | TCG Advisory Services, LLC | 692.273 | 64,53 | 22.769 | 78,54 | ||||
| 2025-07-17 | 13F | City Holding Co | 179 | 0,00 | 6 | 0,00 | ||||
| 2025-07-25 | 13F | Concurrent Investment Advisors, LLC | 283.153 | -7,08 | 9.313 | 0,82 | ||||
| 2025-08-11 | 13F | Stonebrook Private Inc. | 24.966 | 0,40 | 821 | 9,03 | ||||
| 2025-08-07 | 13F | Kestra Private Wealth Services, Llc | 18.538 | 141,32 | 610 | 162,50 | ||||
| 2025-08-14 | 13F | Smartleaf Asset Management LLC | 23.269 | 55,89 | 766 | 67,76 | ||||
| 2025-08-11 | 13F | HighTower Advisors, LLC | 113.674 | 31,19 | 3.739 | 42,35 | ||||
| 2025-08-13 | 13F | Townsquare Capital Llc | 0 | -100,00 | 0 | |||||
| 2025-07-24 | 13F | Robertson Stephens Wealth Management, LLC | 54.100 | 9,52 | 1.779 | 18,84 | ||||
| 2025-07-09 | 13F | High Probability Advisors, LLC | 364.723 | -10,20 | 11.996 | -2,57 | ||||
| 2025-08-12 | 13F | New Republic Capital, LLC | 3.667 | 0,00 | 121 | 8,11 | ||||
| 2025-05-12 | 13F | National Bank Of Canada /fi/ | 0 | -100,00 | 0 | -100,00 | ||||
| 2025-07-14 | 13F | Kfg Wealth Management, Llc | 0 | -100,00 | 0 | |||||
| 2025-07-18 | 13F | Warren Street Wealth Advisors, LLC | 21.174 | -0,34 | 696 | 8,24 | ||||
| 2025-08-12 | 13F | Lionshead Wealth Management, LLC | 0 | -100,00 | 0 | |||||
| 2025-07-24 | 13F | JNBA Financial Advisors | 244.293 | -10,18 | 8.035 | -2,54 | ||||
| 2025-07-30 | 13F | Drive Wealth Management, Llc | 17.350 | -3,02 | 571 | 5,17 | ||||
| 2025-08-06 | 13F | Csenge Advisory Group | 25.763 | -0,15 | 848 | 10,43 | ||||
| 2025-07-24 | 13F | Ronald Blue Trust, Inc. | 0 | -100,00 | 0 | |||||
| 2025-07-31 | 13F | Brighton Jones Llc | 24.322 | 19,71 | 800 | 29,92 | ||||
| 2025-05-06 | 13F | Venturi Wealth Management, LLC | 0 | -100,00 | 0 | |||||
| 2025-07-25 | 13F | PrairieView Partners, LLC | 2.471 | 0,00 | 0 | |||||
| 2025-08-15 | 13F | Morgan Stanley | 778.423 | 37,22 | 25.602 | 48,91 | ||||
| 2025-07-11 | 13F | Ridgeline Wealth, LLC | 10.160 | -43,56 | 334 | -38,72 | ||||
| 2025-07-17 | 13F | Saxon Interests, Inc. | 93.246 | 0,00 | 2.826 | 0,00 | ||||
| 2025-07-28 | 13F | Harbour Investments, Inc. | 103 | 3 | ||||||
| 2025-08-07 | 13F | Meridian Financial Partners LLC | 61.207 | 2 | ||||||
| 2025-08-01 | 13F | Transcend Wealth Collective, Llc | 24.656 | 10,54 | 811 | 19,82 | ||||
| 2025-05-02 | 13F | Leo Wealth, LLC | 0 | -100,00 | 0 | |||||
| 2025-08-11 | 13F | Aptus Capital Advisors, LLC | 193.994 | 1,44 | 6.380 | 10,08 | ||||
| 2025-08-14 | 13F | Qube Research & Technologies Ltd | 0 | -100,00 | 0 | |||||
| 2025-08-26 | NP | EVVLX - The E-Valuator Very Conservative (0%-15%) RMS Fund Service Class Shares | 1.131 | 37 | ||||||
| 2025-04-28 | 13F | First Horizon Advisors, Inc. | 0 | -100,00 | 0 | -100,00 | ||||
| 2025-08-14 | 13F | Citadel Advisors Llc | 185.789 | 2.452,05 | 6.111 | 2.677,27 | ||||
| 2025-08-13 | 13F | Northwestern Mutual Wealth Management Co | 15.319.386 | -0,72 | 503.855 | 7,73 | ||||
| 2025-08-08 | 13F | Wealth Alliance | 98.409 | 59,69 | 3.237 | 73,33 | ||||
| 2025-08-11 | 13F | Farrow Financial Inc. | 282.640 | -0,18 | 9.296 | 8,33 | ||||
| 2025-07-30 | 13F | Jackson Thornton Asset Management, Llc | 20.632 | 0,00 | 680 | 10,75 | ||||
| 2025-08-12 | 13F | CIBC Private Wealth Group, LLC | 2.092 | 209.100,00 | 69 | |||||
| 2025-08-13 | 13F | Jackson Creek Investment Advisors LLC | 38.130 | -6,89 | 1 | 0,00 | ||||
| 2025-07-17 | 13F | Kelly Financial Services LLC | 23.825 | 7,11 | 784 | 16,17 | ||||
| 2025-07-25 | 13F | Keener Financial Planning LLC | 491 | 0 | ||||||
| 2025-08-04 | 13F | Pensionmark Financial Group, Llc | 67.459 | 106,90 | 2.219 | 124,49 | ||||
| 2025-08-01 | 13F | JDH Wealth Management, LLC | 48.834 | 3,14 | 1.606 | 11,92 | ||||
| 2025-07-21 | 13F | Patriot Financial Group Insurance Agency, LLC | 13.868 | 19,25 | 456 | 29,55 | ||||
| 2025-08-14 | 13F | Raymond James Financial Inc | 229.515 | 6,15 | 7.549 | 15,18 | ||||
| 2025-08-11 | 13F | Rothschild Investment Llc | 780 | 0,00 | 26 | 8,70 | ||||
| 2025-08-14 | 13F | Colony Group, LLC | 1.016.508 | -6,88 | 33.433 | 1,05 | ||||
| 2025-07-11 | 13F | Farther Finance Advisors, LLC | 23.376 | -25,96 | 769 | -19,67 | ||||
| 2025-07-23 | 13F | Lansing Street Advisors | 7.247 | -0,89 | 238 | 7,69 | ||||
| 2025-04-21 | 13F | Compass Capital Corp /ma/ /adv | 0 | -100,00 | 0 | |||||
| 2025-08-08 | 13F | JBF Capital, Inc. | 60.000 | 1.973 | ||||||
| 2025-07-30 | 13F | Strategic Blueprint, LLC | 63.565 | 2,15 | 2.091 | 10,82 | ||||
| 2025-08-06 | 13F | Savant Capital, LLC | 14.536 | 2,50 | 478 | 11,42 | ||||
| 2025-07-10 | 13F | Ryan Investment Management, Inc. | 128 | 4 | ||||||
| 2025-07-29 | 13F | Commons Capital, Llc | 74.786 | 2.460 | ||||||
| 2025-08-04 | 13F | Savvy Advisors, Inc. | 672.133 | 29,15 | 22.106 | 40,14 | ||||
| 2025-08-14 | 13F | IHT Wealth Management, LLC | 154.961 | 5.097 | ||||||
| 2025-07-10 | 13F | Kozak & Associates, Inc. | 45 | 2,27 | 1 | 0,00 | ||||
| 2025-07-25 | 13F | Index Fund Advisors, Inc. | 23.653 | 2,17 | 778 | 10,84 | ||||
| 2025-08-15 | 13F | CI Private Wealth, LLC | 23.497 | 1,08 | 773 | 9,66 | ||||
| 2025-08-14 | 13F | Integrated Wealth Concepts LLC | 414.010 | -2,88 | 13.617 | 5,39 | ||||
| 2025-07-24 | 13F | Financial Connections Group, Inc. | 84 | 0 | ||||||
| 2025-08-08 | 13F | Cetera Investment Advisers | 138.344 | 0,84 | 4.550 | 9,43 | ||||
| 2025-08-12 | 13F | LPL Financial LLC | 591.834 | 9,61 | 19.465 | 18,94 | ||||
| 2025-08-14 | 13F | Warren Averett Asset Management, LLC | 21.467 | -12,04 | 706 | -4,47 | ||||
| 2025-05-02 | 13F | Concord Wealth Partners | 0 | -100,00 | 0 | |||||
| 2025-07-24 | 13F | IFP Advisors, Inc | 171.388 | -10,03 | 5.637 | -2,37 | ||||
| 2025-08-14 | 13F | Quantinno Capital Management LP | 21.245 | 699 | ||||||
| 2025-08-04 | 13F | Capital Performance Advisors Llp | 14.228 | -0,41 | 468 | 7,85 | ||||
| 2025-07-21 | 13F | Crews Bank & Trust | 750 | 0,00 | 25 | 9,09 | ||||
| 2025-08-11 | 13F | Principal Securities, Inc. | 3.140 | 57,00 | 103 | 90,74 | ||||
| 2025-07-23 | 13F | Wise Wealth Partners | 21.233 | 0,04 | 698 | 8,55 | ||||
| 2025-08-07 | 13F | BOK Financial Private Wealth, Inc. | 26 | 1 | ||||||
| 2025-08-14 | 13F | EP Wealth Advisors, Inc. | 606.588 | 9.998,02 | 19.951 | 10.861,54 | ||||
| 2025-07-10 | 13F | Wealth Enhancement Advisory Services, Llc | 663.855 | -3,43 | 22.027 | 5,71 | ||||
| 2025-07-25 | 13F | We Are One Seven, LLC | 10.061 | 44,24 | 331 | 56,40 | ||||
| 2025-07-30 | 13F | LGT Financial Advisors LLC | 798 | 5,70 | 26 | 18,18 | ||||
| 2025-08-15 | 13F | TLT Family Holdco ULC | 408.500 | 13.436 | ||||||
| 2025-08-15 | 13F | Fft Wealth Management Llc | 0 | -100,00 | 0 | |||||
| 2025-04-15 | 13F | Noble Wealth Management PBC | 832 | -5,78 | 25 | 8,70 | ||||
| 2025-07-23 | 13F | Heck Capital Advisors, LLC | 352.895 | 2.961,73 | 11.607 | 3.225,50 | ||||
| 2025-07-22 | 13F | Simplicity Wealth,LLC | 19.498 | 1,68 | 641 | 10,33 | ||||
| 2025-08-13 | 13F | Cresset Asset Management, LLC | 23.017 | 0,00 | 757 | 8,61 | ||||
| 2025-07-17 | 13F | Johnson Bixby & Associates, LLC | 26.940 | 0,17 | 886 | 8,71 | ||||
| 2025-04-17 | 13F | Janney Montgomery Scott LLC | 0 | -100,00 | 0 | |||||
| 2025-05-15 | 13F | Hrt Financial Lp | 0 | -100,00 | 0 | |||||
| 2025-08-08 | 13F | Gts Securities Llc | 6.513 | 214 | ||||||
| 2025-04-14 | 13F | Bruce G. Allen Investments, LLC | 0 | -100,00 | 0 | |||||
| 2025-08-11 | 13F | Citigroup Inc | 3.978 | 0,00 | 131 | 8,33 | ||||
| 2025-07-25 | 13F | RHS Financial, LLC | 177.249 | 1,90 | 5.830 | 10,57 | ||||
| 2025-08-08 | 13F | Pnc Financial Services Group, Inc. | 1.453 | -10,36 | 48 | -4,08 | ||||
| 2025-08-19 | 13F | National Asset Management, Inc. | 0 | -100,00 | 0 | |||||
| 2025-08-08 | 13F | TD Capital Management LLC | 1.057 | 35 | ||||||
| 2025-05-16 | 13F | Coppell Advisory Solutions LLC | 0 | -100,00 | 0 | |||||
| 2025-07-25 | 13F | Ruedi Wealth Management, Inc. | 0 | -100,00 | 0 | |||||
| 2025-08-11 | 13F | Greykasell Wealth Strategies, Inc. | 70 | -57,58 | 2 | -60,00 | ||||
| 2025-08-08 | 13F | Avantax Advisory Services, Inc. | 27.669 | -0,28 | 910 | 8,20 | ||||
| 2025-08-11 | 13F | CFS Investment Advisory Services, LLC | 15.151 | 8,01 | 0 | |||||
| 2025-08-18 | 13F | Hollencrest Capital Management | 1.391 | 46 | ||||||
| 2025-07-25 | 13F | Commonwealth Financial Services, LLC | 0 | -100,00 | 0 | |||||
| 2025-07-16 | 13F | Vision Capital Management, Inc. | 24.364 | 5,14 | 801 | 14,10 | ||||
| 2025-08-07 | 13F | Resources Investment Advisors, LLC. | 357.544 | -20,37 | 11.760 | -13,59 | ||||
| 2025-08-14 | 13F | Aprio Wealth Management, LLC | 17.046 | -1,04 | 561 | 7,28 | ||||
| 2025-08-26 | NP | EVCLX - The E-Valuator Conservative (15%-30%) RMS Fund Service Class Shares | 5.365 | 176 | ||||||
| 2025-07-11 | 13F | Kaufman Rossin Wealth, LLC | 12.813 | 0,00 | 421 | 8,51 | ||||
| 2025-08-07 | 13F | 1620 Investment Advisors, Inc. | 649 | 0,00 | 21 | 10,53 | ||||
| 2025-07-16 | 13F | Signaturefd, Llc | 734 | -10,92 | 24 | 0,00 | ||||
| 2025-08-12 | 13F | AlphaCore Capital LLC | 5.115 | 0,00 | 168 | 8,39 | ||||
| 2025-04-29 | 13F | Chilton Capital Management Llc | 0 | -100,00 | 0 | |||||
| 2025-08-06 | 13F | Stone House Investment Management, LLC | 550 | 18 | ||||||
| 2025-08-14 | 13F | Moneta Group Investment Advisors Llc | 15.346 | 0,00 | 505 | 8,39 | ||||
| 2025-07-24 | 13F | Stonebridge Financial Group, LLC | 0 | -100,00 | 0 | |||||
| 2025-08-05 | 13F | Claro Advisors LLC | 8.206 | 270 | ||||||
| 2025-08-04 | 13F | Assetmark, Inc | 1.601 | 11,49 | 53 | 20,93 | ||||
| 2025-08-12 | 13F | Global Retirement Partners, LLC | 35.617 | 112,50 | 1.171 | 157,93 | ||||
| 2025-07-23 | 13F | Armbruster Capital Management, Inc. | 700.825 | 1,83 | 23.050 | 10,50 | ||||
| 2025-08-11 | 13F | Dorsey & Whitney Trust CO LLC | 8.500 | 0,00 | 280 | 8,56 | ||||
| 2025-07-22 | 13F | Capital Advisors Inc/ok | 23.975 | 0,00 | 789 | 8,54 | ||||
| 2025-08-07 | 13F | W Advisors, Llc | 39.480 | -0,45 | 1.298 | 7,99 | ||||
| 2025-08-12 | 13F | Wood Tarver Financial Group, LLC | 125 | 0,00 | 0 | -100,00 | ||||
| 2025-08-11 | 13F | Private Advisor Group, LLC | 98.410 | 416,45 | 3.237 | 460,83 | ||||
| 2025-07-18 | 13F | Clarity Financial LLC | 0 | -100,00 | 0 | |||||
| 2025-07-23 | 13F | Foresight Capital Management Advisors, Inc. | 0 | -100,00 | 0 | |||||
| 2025-08-05 | 13F | Verity Asset Management, Inc. | 19.388 | 638 | ||||||
| 2025-04-17 | 13F | Qrg Capital Management, Inc. | 0 | -100,00 | 0 | |||||
| 2025-07-15 | 13F | Garrett Investment Advisors LLC | 9.805 | -4,87 | 322 | 3,21 | ||||
| 2025-08-13 | 13F | Twin Peaks Wealth Advisors, LLC | 2.461 | 85 | ||||||
| 2025-05-02 | 13F | Transcendent Capital Group LLC | 0 | -100,00 | 0 | |||||
| 2025-08-08 | 13F | Creative Planning | 33.470 | -0,07 | 1.101 | 8,37 | ||||
| 2025-08-14 | 13F | Ariadne Wealth Management, LP | 10.910 | -0,91 | 381 | 9,48 | ||||
| 2025-08-14 | 13F | Mercer Global Advisors Inc /adv | 4.136.681 | -5,44 | 136.055 | 2,61 | ||||
| 2025-08-15 | 13F | Equitable Holdings, Inc. | 62.086 | 151,31 | 2.042 | 172,99 | ||||
| 2025-08-13 | 13F | Millstone Evans Group, LLC | 287 | 0,00 | 9 | 12,50 | ||||
| 2025-07-14 | 13F | AdvisorNet Financial, Inc | 2.571 | 1,78 | 85 | 10,53 | ||||
| 2025-07-30 | 13F | Avidian Wealth Solutions, LLC | 19.348 | 0,00 | 636 | 8,53 | ||||
| 2025-08-12 | 13F | Jpmorgan Chase & Co | 4.678.576 | 18,67 | 153.878 | 28,77 | ||||
| 2025-07-31 | 13F | LJI Wealth Management, LLC | 13.014 | 0,00 | 428 | 8,63 | ||||
| 2025-08-13 | 13F | Jones Financial Companies Lllp | 59 | 2 | ||||||
| 2025-07-18 | 13F | Truist Financial Corp | 100.112 | -1,09 | 3.293 | 7,34 | ||||
| 2025-08-08 | 13F | Capital Investment Advisory Services, LLC | 254 | -80,40 | 8 | -79,49 | ||||
| 2025-08-14 | 13F | Bank Of America Corp /de/ | 915.728 | 12,46 | 30.118 | 22,03 | ||||
| 2025-08-15 | 13F | Keel Point, LLC | 101.900 | 0,00 | 3.351 | 8,52 | ||||
| 2025-07-09 | 13F | Beacon Financial Group | 42.197 | 2,76 | 1.388 | 11,50 | ||||
| 2025-08-11 | 13F | Strategic Wealth Partners, Ltd. | 1.845 | 61 |