Grundlæggende statistik
| Institutionelle aktier (lange) | 7.207.194 - 56,38% (ex 13D/G) - change of -0,67MM shares -8,55% MRQ |
| Institutionel værdi (lang) | $ 659.028 USD ($1000) |
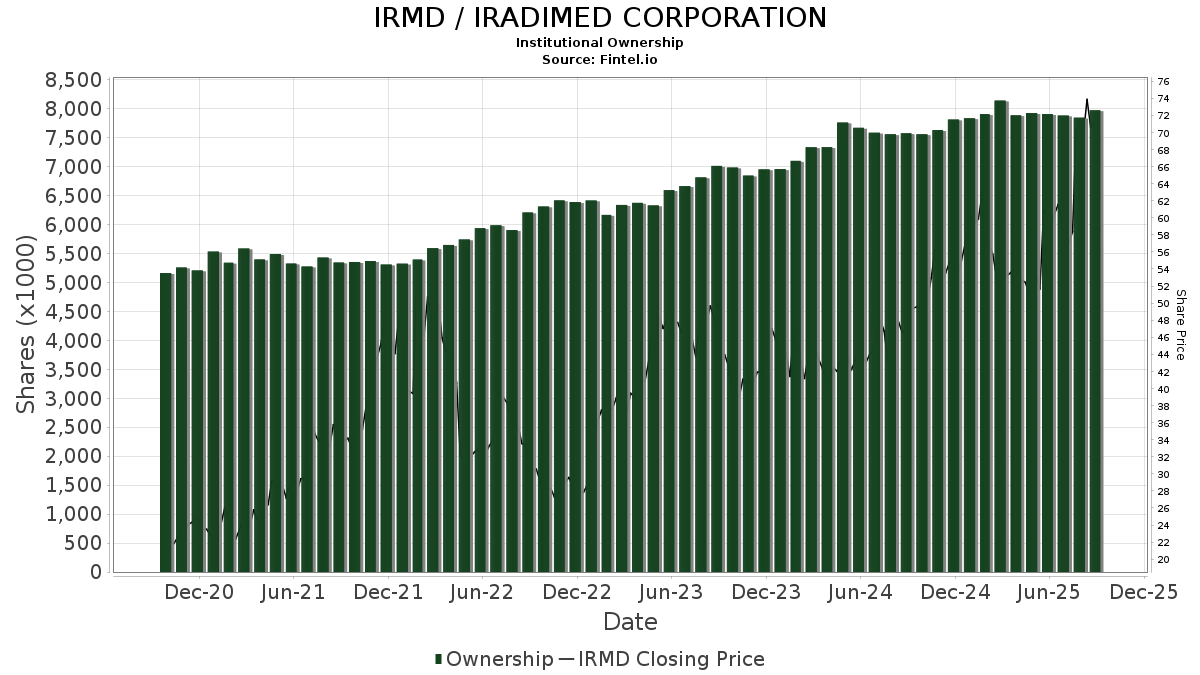
Institutionelt ejerskab og aktionærer
IRADIMED CORPORATION (US:IRMD) har 214 institutionelle ejere og aktionærer, der har indsendt 13D/G- eller 13F-formularer til Securities Exchange Commission (SEC). Disse institutioner har i alt 7,207,194 aktier. Største aktionærer omfatter BlackRock, Inc., Vanguard Group Inc, Renaissance Technologies Llc, Nine Ten Capital Management LLC, Copeland Capital Management, LLC, Kayne Anderson Rudnick Investment Management Llc, Geode Capital Management, Llc, Dimensional Fund Advisors Lp, Goldman Sachs Group Inc, and State Street Corp .
IRADIMED CORPORATION (NasdaqGM:IRMD) institutionel ejerskabsstruktur viser aktuelle positioner i virksomheden efter institutioner og fonde, samt seneste ændringer i positionsstørrelse. Større aktionærer kan omfatte individuelle investorer, investeringsforeninger, hedgefonde eller institutioner. Skema 13D angiver, at investoren besidder (eller besidder) mere end 5 % af virksomheden og har til hensigt (eller har til hensigt at) aktivt at forfølge en ændring i forretningsstrategi. Skema 13G indikerer en passiv investering på over 5%.
The share price as of April 24, 2026 is 88,68 / share. Previously, on April 28, 2025, the share price was 53,02 / share. This represents an increase of 67,26% over that period.
Fondens stemningsscore
Fund Sentiment Score (fka Ownership Accumulation Score) finder de aktier, der bliver mest købt af fonde. Det er resultatet af en sofistikeret, multi-faktor kvantitativ model, der identificerer virksomheder med de højeste niveauer af institutionel akkumulering. Scoringsmodellen bruger en kombination af den samlede stigning i oplyste ejere, ændringerne i porteføljeallokeringer i disse ejere og andre målinger. Tallet går fra 0 til 100, hvor højere tal indikerer et højere niveau af akkumulering for sine jævnaldrende, og 50 er gennemsnittet.
Opdateringsfrekvens: Dagligt
Se Ownership Explorer, som giver en liste over højest rangerende virksomheder.
AI+ Ask Fintel’s AI assistant about IRADIMED CORPORATION.
Select a question to share a public post with an AI-crafted answer.
Thinking of good questions…
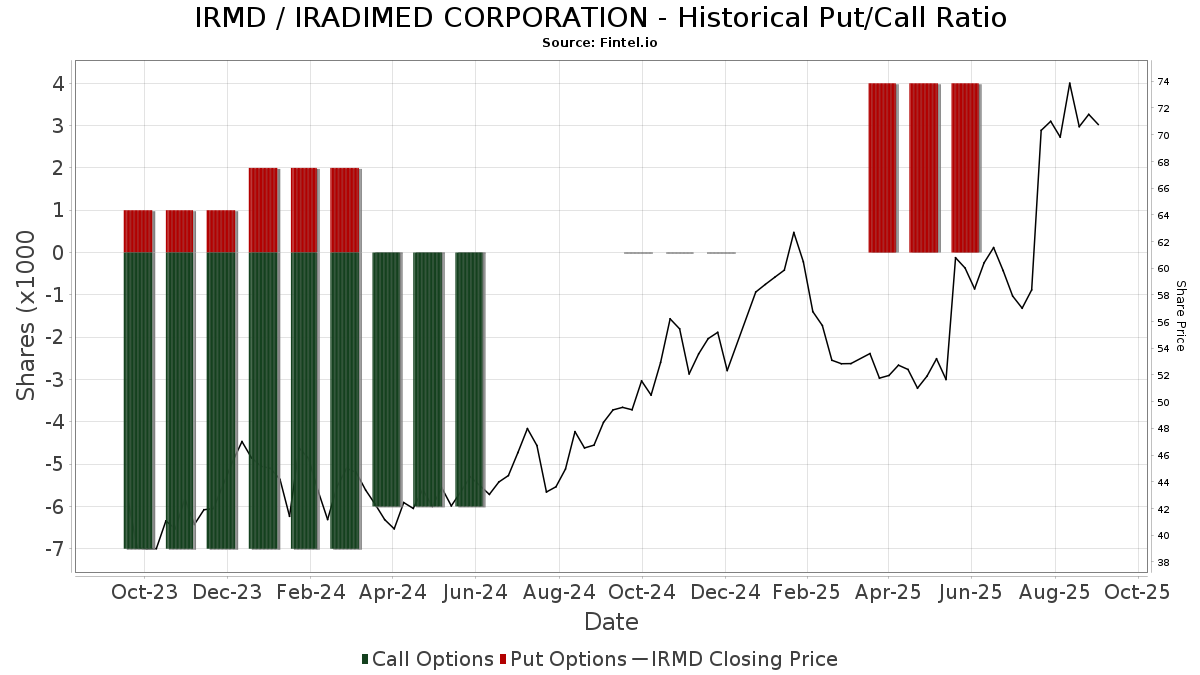
Institutionel Put/Call-forhold
Ud over at indberette standardaktie- og gældsudstedelser skal institutter med mere end 100 mill. aktiver under forvaltning også oplyse deres put- og call-optionsbeholdninger. Da salgsoptioner generelt indikerer negativ stemning, og købsoptioner indikerer positiv stemning, kan vi få en fornemmelse af den overordnede institutionelle stemning ved at plotte forholdet mellem put og kald. Diagrammet til højre viser det historiske put/call-forhold for dette instrument.
Brug af Put/Call Ratio som en indikator for investorernes stemning overvinder en af de vigtigste mangler ved at bruge totalt institutionelt ejerskab, som er, at en betydelig mængde af aktiver under forvaltning investeres passivt for at spore indekser. Passivt forvaltede fonde køber typisk ikke optioner, så indikatoren for put/call-forholdet følger mere nøje følelsen af aktivt forvaltede fonde.
13D/G-arkivering
Vi præsenterer 13D/G ansøgninger separat fra 13F ansøgninger på grund af den forskellige behandling af SEC. 13D/G-ansøgninger kan indgives af grupper af investorer (med én ledende), hvorimod 13F-ansøgninger ikke kan. Dette resulterer i situationer, hvor en investor kan indsende en 13D/G, der rapporterer én værdi for de samlede aktier (der repræsenterer alle de aktier, der ejes af investorgruppen), men derefter indsender en 13F, der rapporterer en anden værdi for de samlede aktier (der udelukkende repræsenterer deres egne) ejendomsret). Det betyder, at aktieejerskab af 13D/G-arkiver og 13F-arkiveringer ofte ikke er direkte sammenlignelige, så vi præsenterer dem separat.
Bemærk: Fra den 16. maj 2021 viser vi ikke længere ejere, der ikke har indsendt en 13D/G inden for det seneste år. Tidligere viste vi den fulde historie af 13D/G-arkiver. Generelt skal enheder, der er forpligtet til at indgive 13D/G-ansøgninger, indgive mindst årligt, før de indsender en afsluttende ansøgning. Dog forlader fonde nogle gange positioner uden at indsende en afsluttende ansøgning (dvs. de afvikler), så visning af den fulde historie resulterede nogle gange i forvirring om det nuværende ejerskab. For at undgå forvirring viser vi nu kun 'aktuelle' ejere - det vil sige - ejere, der har anmeldt inden for det seneste år.
Upgrade to unlock premium data.
| Fil dato | Form | Investor | Forrige Aktier |
Seneste Aktier |
Δ Aktier (Procent) |
Ejendomsret (Procent) |
Δ Ejerskab (Procent) |
|
|---|---|---|---|---|---|---|---|---|
| 2026-02-10 | Nine Ten Capital Management LLC | 905,926 | 428,477 | -52.70 | 3.40 | -52.11 | ||
| 2025-04-29 | BlackRock, Inc. | 939,737 | 496,603 | -47.16 | 3.90 | -47.30 |
13F og NPORT arkivering
Detaljer om 13F-arkivering er gratis. Detaljer om NP-ansøgninger kræver et premium-medlemskab. Grønne rækker angiver nye positioner. Røde rækker angiver lukkede positioner. Klik på linket ikon for at se den fulde transaktionshistorik.
Opgrader
for at låse premium-data op og eksportere til Excel ![]() .
.
| Fil dato | Kilde | Investor | Type | Gennemsnitlig pris (Øst) |
Aktier | Δ Aktier (%) |
Rapporteret Værdi ($1000) |
Δ Værdi (%) |
Port Alloc (%) |
|
|---|---|---|---|---|---|---|---|---|---|---|
| 2026-02-13 | 13F | Citigroup Inc | 6.756 | 108,52 | 657 | 185,65 | ||||
| 2026-02-06 | 13F | HighTower Advisors, LLC | 20.363 | -49,55 | 1.981 | -31,06 | ||||
| 2026-02-09 | 13F | Huntington National Bank | 2.000 | -7,83 | 195 | 25,97 | ||||
| 2026-02-17 | 13F | Ameriprise Financial Inc | 4.865 | 1,27 | 473 | 38,71 | ||||
| 2026-02-17 | 13F | Tudor Investment Corp Et Al | 31.177 | 233,09 | 3.033 | 355,26 | ||||
| 2026-02-13 | 13F | Verition Fund Management LLC | 6.116 | -36,48 | 595 | -13,28 | ||||
| 2026-02-12 | 13F | BlackRock, Inc. | 1.001.999 | -1,37 | 97.474 | 34,84 | ||||
| 2026-02-06 | 13F | GPS Wealth Strategies Group, LLC | 0 | -100,00 | 0 | |||||
| 2026-02-17 | 13F | Jones Financial Companies Lllp | 813 | -3,56 | 79 | 33,90 | ||||
| 2026-01-15 | 13F | Nisa Investment Advisors, Llc | 77 | 5,48 | 7 | 40,00 | ||||
| 2026-02-17 | 13F | Optiver Holding B.V. | 38 | -20,83 | 4 | 0,00 | ||||
| 2026-02-06 | 13F | Legato Capital Management LLC | 8.677 | -32,21 | 844 | -7,25 | ||||
| 2026-02-12 | 13F | Renaissance Technologies Llc | 456.412 | -6,62 | 44.400 | 27,66 | ||||
| 2026-02-17 | 13F/A | Uniplan Investment Counsel, Inc. | 65.695 | -15,03 | 6.391 | 16,16 | ||||
| 2026-02-12 | 13F | Dimensional Fund Advisors Lp | 217.129 | 1,20 | 21.123 | 38,36 | ||||
| 2026-02-17 | 13F | Point72 Asset Management, L.P. | 10.982 | -2,03 | 1.068 | 34,00 | ||||
| 2026-02-10 | 13F | Acadian Asset Management Llc | 149.451 | 2,87 | 15 | 40,00 | ||||
| 2026-02-09 | 13F | Sawgrass Asset Management Llc | 2.714 | 264 | ||||||
| 2026-02-17 | 13F | Credit Agricole S A | 21.698 | 197,23 | 2.111 | 306,55 | ||||
| 2026-02-17 | 13F | Aquatic Capital Management LLC | 4.233 | 101,09 | 412 | 175,84 | ||||
| 2026-02-17 | 13F | Voleon Capital Management Lp | 6.573 | 29,95 | 639 | 77,99 | ||||
| 2026-02-17 | 13F | Aqr Capital Management Llc | 15.889 | 18,89 | 1.546 | 62,46 | ||||
| 2026-02-09 | 13F | Quest Partners LLC | 526 | -61,07 | 51 | -46,87 | ||||
| 2026-02-17 | 13F | Northern Trust Corp | 132.045 | -3,97 | 12.845 | 31,29 | ||||
| 2026-02-13 | 13F | Sei Investments Co | 63.396 | 163,84 | 6.167 | 260,85 | ||||
| 2026-02-12 | 13F | Aviva Plc | 5.340 | 519 | ||||||
| 2026-02-09 | 13F | Harbour Investments, Inc. | 0 | -100,00 | 0 | |||||
| 2026-04-07 | 13F | Farther Finance Advisors, LLC | 460 | 3,37 | 44 | 2,33 | ||||
| 2026-02-17 | 13F | Raymond James Financial Inc | 33.748 | -18,76 | 3.288 | 11,23 | ||||
| 2025-11-13 | 13F | Magnetar Financial LLC | 0 | -100,00 | 0 | |||||
| 2026-02-02 | 13F | Principal Financial Group Inc | 8.487 | 43,19 | 826 | 95,96 | ||||
| 2026-02-13 | 13F | Johnson Investment Counsel Inc | 0 | -100,00 | 0 | |||||
| 2026-02-13 | 13F | Smartleaf Asset Management LLC | 14 | -90,34 | 1 | -90,00 | ||||
| 2026-01-29 | 13F | Nbc Securities, Inc. | 0 | -100,00 | 0 | |||||
| 2026-01-28 | 13F | Klp Kapitalforvaltning As | 1.800 | -14,29 | 175 | 17,45 | ||||
| 2026-02-17 | 13F | Two Sigma Investments, Lp | 64.914 | 21,00 | 6.315 | 65,42 | ||||
| 2026-04-24 | 13F | Strs Ohio | 6.500 | -5,80 | 626 | -6,86 | ||||
| 2026-02-17 | 13F | Advisor Group Holdings, Inc. | 6.347 | 90,66 | 617 | 157,08 | ||||
| 2026-02-13 | 13F | Rhumbline Advisers | 13.592 | 4,87 | 1.322 | 43,38 | ||||
| 2026-02-17 | 13F | Quantinno Capital Management LP | 3.095 | 301 | ||||||
| 2026-02-12 | 13F | Nuveen, LLC | 23.362 | 0,00 | 2.273 | 36,70 | ||||
| 2026-02-12 | 13F | EAM Investors, LLC | 55.106 | 5.361 | ||||||
| 2026-04-07 | 13F | Signaturefd, Llc | 21 | 61,54 | 2 | 100,00 | ||||
| 2026-04-15 | 13F | Albert D Mason Inc | 17.171 | 0,88 | 1.653 | -0,18 | ||||
| 2026-02-17 | 13F | Alliancebernstein L.p. | 9.262 | 0,00 | 901 | 36,72 | ||||
| 2026-02-13 | 13F | Barclays Plc | 25.849 | 7,76 | 2.515 | 47,36 | ||||
| 2026-04-20 | 13F | Sowell Financial Services LLC | 3.973 | 1,15 | 382 | 0,00 | ||||
| 2026-02-24 | 13F | MidFirst Bank | 13 | 1 | ||||||
| 2026-02-10 | 13F | Bnp Paribas Arbitrage, Sa | 6.483 | 27,39 | 631 | 74,03 | ||||
| 2026-02-17 | 13F | Nine Ten Capital Management LLC | 428.477 | -44,45 | 41.682 | -24,07 | ||||
| 2026-02-06 | 13F | EverSource Wealth Advisors, LLC | 132 | 97,01 | 13 | 200,00 | ||||
| 2026-02-09 | 13F | CBIZ Investment Advisory Services, LLC | 307 | -0,32 | 30 | 38,10 | ||||
| 2026-02-06 | 13F | Larson Financial Group LLC | 384 | 6,37 | 37 | 48,00 | ||||
| 2026-02-12 | 13F | Voya Investment Management Llc | 10.284 | 1,38 | 1.000 | 38,70 | ||||
| 2026-02-13 | 13F | Martingale Asset Management L P | 12.870 | -1,14 | 1.252 | 35,10 | ||||
| 2026-02-13 | 13F | Ranger Investment Management, L.P. | 111.470 | -6,81 | 10.844 | 27,38 | ||||
| 2026-02-11 | 13F | Los Angeles Capital Management Llc | 14 | 1 | ||||||
| 2026-02-06 | 13F | Gsa Capital Partners Llp | 11.134 | -19,23 | 1 | |||||
| 2026-01-28 | 13F | Arizona State Retirement System | 2.312 | 225 | ||||||
| 2026-02-17 | 13F | Advisory Services Network, LLC | 0 | -100,00 | 0 | |||||
| 2026-02-13 | 13F | Jacobs Levy Equity Management, Inc | 8.684 | -4,00 | 845 | 31,26 | ||||
| 2026-02-17 | 13F | Jump Financial, LLC | 18.317 | 157,99 | 1.782 | 252,67 | ||||
| 2025-11-14 | 13F | Binnacle Investments Inc | 266 | 27,27 | 19 | 50,00 | ||||
| 2026-02-13 | 13F | Morgan Stanley | 134.731 | 5,92 | 13.107 | 44,80 | ||||
| 2026-02-10 | 13F | Goldman Sachs Group Inc | 205.227 | 37,00 | 19.964 | 87,30 | ||||
| 2026-02-14 | 13F | Rockefeller Capital Management L.P. | 125 | 12 | ||||||
| 2026-02-17 | 13F | Cetera Investment Advisers | 5.451 | 0,94 | 530 | 38,02 | ||||
| 2025-11-14 | 13F | Cubist Systematic Strategies, LLC | 8.298 | 591 | ||||||
| 2026-02-13 | 13F | Wells Fargo & Company/mn | 9.696 | 70,49 | 943 | 133,42 | ||||
| 2026-02-17 | 13F | MIRAE ASSET GLOBAL ETFS HOLDINGS Ltd. | 3.761 | 0,97 | 366 | 37,74 | ||||
| 2026-04-23 | 13F | SJS Investment Consulting Inc. | 2 | 0,00 | 0 | |||||
| 2026-02-12 | 13F | Hrt Financial Lp | 26.570 | 34,28 | 3 | 100,00 | ||||
| 2026-02-17 | 13F | Two Sigma Advisers, Lp | 42.400 | 20,11 | 4.125 | 64,24 | ||||
| 2026-01-29 | 13F | Copeland Capital Management, LLC | 412.550 | -4,83 | 40.133 | 30,10 | ||||
| 2026-01-20 | 13F | Harbor Capital Advisors, Inc. | 63 | -1,56 | 0 | |||||
| 2026-02-11 | 13F | Deutsche Bank Ag\ | 5.879 | 10,88 | 572 | 51,46 | ||||
| 2026-02-03 | 13F | Ballentine Partners, LLC | 2.172 | 211 | ||||||
| 2026-02-06 | 13F | Global Retirement Partners, LLC | 877 | 85 | ||||||
| 2026-02-12 | 13F | New York State Common Retirement Fund | 15.888 | 0,00 | 1.546 | 36,73 | ||||
| 2026-02-13 | 13F | Arrowstreet Capital, Limited Partnership | 6.309 | 614 | ||||||
| 2026-02-11 | 13F | Jpmorgan Chase & Co | 12.444 | -47,55 | 1.211 | -28,32 | ||||
| 2026-01-29 | 13F | UBS Group AG | 16.968 | -33,28 | 1.651 | -8,79 | ||||
| 2026-02-10 | 13F | Intech Investment Management Llc | 3.120 | -17,15 | 304 | 13,48 | ||||
| 2026-04-23 | 13F | CWM Advisors, LLC | 1.108 | 107 | ||||||
| 2026-02-17 | 13F | Altshuler Shaham Ltd | 0 | -100,00 | 0 | |||||
| 2026-02-17 | 13F | Royal Bank Of Canada | 32.778 | 31,36 | 3.188 | 79,61 | ||||
| 2026-02-13 | 13F | SRS Capital Advisors, Inc. | 351 | -25,16 | 34 | 3,03 | ||||
| 2026-02-17 | 13F | Quadrature Capital Ltd | 0 | -100,00 | 0 | |||||
| 2026-02-12 | 13F | Federated Hermes, Inc. | 168 | 88,76 | 16 | 166,67 | ||||
| 2026-02-17 | 13F | XTX Topco Ltd | 3.698 | 360 | ||||||
| 2026-04-16 | 13F | SG Americas Securities, LLC | 73.561 | 4,50 | 7 | 16,67 | ||||
| 2026-02-03 | 13F | SBI Securities Co., Ltd. | 32 | 0,00 | 3 | 50,00 | ||||
| 2026-02-13 | 13F | Grandeur Peak Global Advisors, LLC | 0 | -100,00 | 0 | |||||
| 2026-02-17 | 13F | Canada Pension Plan Investment Board | 1.500 | 146 | ||||||
| 2026-02-17 | 13F | Citadel Advisors Llc | 55.758 | 65,32 | 5.424 | 126,00 | ||||
| 2026-02-18 | 13F | Cim, Llc | 8.314 | -9,67 | 809 | 23,55 | ||||
| 2026-01-29 | 13F | DecisionPoint Financial, LLC | 9 | 0,00 | 1 | |||||
| 2026-02-06 | 13F | Pnc Financial Services Group, Inc. | 258 | -2,27 | 25 | 38,89 | ||||
| 2026-02-17 | 13F | Fmr Llc | 66.732 | 226,19 | 6.492 | 346,12 | ||||
| 2026-04-15 | 13F | DAVENPORT & Co LLC | 2.785 | 16,04 | 268 | 15,02 | ||||
| 2026-02-13 | 13F | Ubs Asset Management Americas Inc | 14.875 | 21,13 | 1.447 | 65,75 | ||||
| 2026-02-17 | 13F | Balyasny Asset Management Llc | 6.498 | 632 | ||||||
| 2026-02-02 | 13F | Cornerstone Planning Group LLC | 153 | 10,87 | 15 | 40,00 | ||||
| 2026-02-13 | 13F | Virtus ETF Advisers LLC | 1.650 | 0,00 | 161 | 36,75 | ||||
| 2026-04-16 | 13F | Ellsworth Advisors, LLC | 11.151 | -5,60 | 1.073 | -11,40 | ||||
| 2026-02-10 | 13F | Globeflex Capital L P | 15.546 | 0,00 | 1.512 | 36,71 | ||||
| 2025-11-14 | 13F | Brevan Howard Capital Management LP | 0 | -100,00 | 0 | |||||
| 2026-02-17 | 13F | Janus Henderson Group Plc | 3.100 | 0,00 | 302 | 36,82 | ||||
| 2026-02-13 | 13F | Kayne Anderson Rudnick Investment Management Llc | 333.229 | 32.417 | ||||||
| 2026-04-22 | 13F | Spire Wealth Management | 1.000 | 0,00 | 96 | -1,03 | ||||
| 2026-02-10 | 13F | Td Asset Management Inc | 3.998 | 389 | ||||||
| 2026-02-17 | 13F | Susquehanna International Group, Llp | 20.995 | 636,67 | 2.042 | 910,89 | ||||
| 2026-02-13 | 13F | Bridge City Capital, LLC | 70.854 | 19,39 | 6.893 | 63,24 | ||||
| 2026-02-17 | 13F | Russell Investments Group, Ltd. | 109.185 | 5,40 | 10.622 | 44,09 | ||||
| 2026-02-17 | 13F | Creative Planning | 5.701 | 28,95 | 555 | 76,43 | ||||
| 2026-02-10 | 13F | Daiwa Securities Group Inc. | 4.239 | 0 | ||||||
| 2026-02-17 | 13F | Citadel Advisors Llc | Put | 0 | -100,00 | 0 | ||||
| 2026-02-13 | 13F | Neuberger Berman Group LLC | 3.986 | -2,90 | 388 | 32,53 | ||||
| 2026-02-17 | 13F | State Of Wisconsin Investment Board | 5.856 | 570 | ||||||
| 2026-02-26 | 13F/A | Aristides Capital LLC | 27.734 | 4,95 | 2.698 | 43,46 | ||||
| 2026-02-17 | 13F | Summit Global Investments | 7.082 | -0,80 | 1 | |||||
| 2026-02-09 | 13F | Legal & General Group Plc | 7.978 | -20,30 | 776 | 8,99 | ||||
| 2026-01-30 | 13F | R Squared Ltd | 2.935 | -32,22 | 286 | -7,47 | ||||
| 2026-02-19 | 13F | Invesco Ltd. | 35.131 | 473,94 | 3.418 | 685,52 | ||||
| 2026-02-17 | 13F | Trexquant Investment LP | 4.320 | 420 | ||||||
| 2026-02-17 | 13F | Tower Research Capital LLC (TRC) | 142 | -63,59 | 14 | -51,85 | ||||
| 2026-01-29 | 13F | Comerica Bank | 2.096 | -6,47 | 204 | 27,67 | ||||
| 2026-01-29 | 13F | Calamos Advisors LLC | 10.788 | -5,83 | 1.049 | 28,71 | ||||
| 2026-02-12 | 13F | Skopos Labs, Inc. | 10.516 | 1.028 | ||||||
| 2026-02-13 | 13F | Victory Capital Management Inc | 26.079 | -1,83 | 2.537 | 34,18 | ||||
| 2026-04-24 | 13F | Root Financial Partners, LLC | 15 | 400,00 | 1 | |||||
| 2026-01-28 | 13F | WPG Advisers, LLC | 89 | 0,00 | 9 | 33,33 | ||||
| 2025-11-12 | 13F | Roubaix Capital, LLC | 0 | -100,00 | 0 | -100,00 | ||||
| 2026-02-05 | 13F | Isthmus Partners, Llc | 50.611 | -13,84 | 4.923 | 17,80 | ||||
| 2026-01-27 | 13F | First Horizon Corp | 124 | 0,00 | 12 | 50,00 | ||||
| 2026-02-17 | 13F | Liontrust Investment Partners LLP | 36.471 | -3,48 | 3.548 | 31,96 | ||||
| 2026-01-26 | 13F | Cwm, Llc | 657 | 19,45 | 0 | |||||
| 2026-02-12 | 13F | Sit Investment Associates Inc | 0 | -100,00 | 0 | |||||
| 2026-02-12 | 13F | Alps Advisors Inc | 6.453 | 0,80 | 628 | 37,80 | ||||
| 2026-02-17 | 13F | Snowden Capital Advisors LLC | 4.262 | -9,34 | 415 | 23,95 | ||||
| 2026-02-17 | 13F | Susquehanna International Group, Llp | Put | 0 | -100,00 | 0 | ||||
| 2026-04-22 | 13F | Silver Coast Investments LLC | 3.710 | -13,54 | 357 | -14,39 | ||||
| 2026-02-17 | 13F | 9823 Capital, L.P. | 2.703 | 263 | ||||||
| 2026-04-14 | 13F | Davidson Capital Management Inc. | 55.022 | 43.224,41 | 5.296 | 44.033,33 | ||||
| 2026-02-10 | 13F | Quantbot Technologies LP | 7.393 | 220,18 | 719 | 338,41 | ||||
| 2026-04-13 | 13F | True Wealth Design, LLC | 9 | 0,00 | 1 | |||||
| 2026-02-09 | 13F | Geode Capital Management, Llc | 261.965 | -1,64 | 25.488 | 34,47 | ||||
| 2026-04-24 | 13F | James Investment Research Inc | 2.454 | 0,00 | 236 | -0,84 | ||||
| 2026-02-13 | 13F | Prudential Financial Inc | 10.110 | 149,63 | 984 | 241,32 | ||||
| 2026-02-10 | 13F | Bank of New York Mellon Corp | 85.531 | -17,15 | 8.320 | 13,26 | ||||
| 2026-02-17 | 13F | Punch & Associates Investment Management, Inc. | 17.000 | 0,00 | 1.654 | 36,72 | ||||
| 2026-02-12 | 13F | Brown Brothers Harriman & Co | 54 | 0,00 | 5 | 66,67 | ||||
| 2025-11-07 | 13F | Sierra Ocean, Llc | 0 | -100,00 | 0 | |||||
| 2026-02-12 | 13F | Swiss National Bank | 16.300 | 3,16 | 1.586 | 41,01 | ||||
| 2026-04-24 | 13F | Key FInancial Inc | 225 | 0,00 | 22 | 0,00 | ||||
| 2026-02-18 | 13F | GWM Advisors LLC | 17.256 | 1.679 | ||||||
| 2026-03-06 | 13F | Hsbc Holdings Plc | 21.559 | 19,17 | 2.103 | 65,72 | ||||
| 2026-02-17 | 13F | T. Rowe Price Investment Management, Inc. | 55.639 | 11,05 | 5 | 66,67 | ||||
| 2026-02-12 | 13F | Colonial Trust Advisors | 25 | 2 | ||||||
| 2026-02-17 | 13F | PharVision Advisers, LLC | 0 | -100,00 | 0 | |||||
| 2026-02-11 | 13F | Simplex Trading, Llc | 32 | -87,45 | 3 | |||||
| 2026-04-14 | 13F | USA Financial Portformulas Corp | 769 | -8,45 | 74 | -8,64 | ||||
| 2026-02-05 | 13F | Amalgamated Bank | 256 | -7,91 | 0 | |||||
| 2026-04-20 | 13F | State of Alaska, Department of Revenue | 1.900 | 0,00 | 0 | |||||
| 2026-02-13 | 13F | Kestra Advisory Services, LLC | 215 | 21 | ||||||
| 2026-02-11 | 13F | Parallel Advisors, LLC | 73 | 10,61 | 7 | 75,00 | ||||
| 2026-02-12 | 13F | Principal Securities, Inc. | 0 | -100,00 | 0 | -100,00 | ||||
| 2026-02-17 | 13F | Granahan Investment Management Inc/ma | 0 | -100,00 | 0 | |||||
| 2026-02-12 | 13F | Steward Partners Investment Advisory, Llc | 0 | -100,00 | 0 | |||||
| 2026-04-17 | 13F | RFG Advisory, LLC | 0 | -100,00 | 0 | |||||
| 2026-02-10 | 13F | Envestnet Asset Management Inc | 63.424 | -5,37 | 6.170 | 29,36 | ||||
| 2026-02-13 | 13F | Rice Hall James & Associates, Llc | 36.993 | -15,14 | 3.599 | 15,99 | ||||
| 2026-01-30 | 13F | Shaker Investments Llc/oh | 62.245 | -1,51 | 6.055 | 34,65 | ||||
| 2026-02-10 | 13F | Axq Capital, Lp | 2.334 | 227 | ||||||
| 2026-04-20 | 13F | Yorktown Management & Research Co Inc | 2.250 | 0,00 | 217 | -0,92 | ||||
| 2026-02-12 | 13F | Riverwater Partners LLC | 3.064 | 0,00 | 298 | 36,70 | ||||
| 2026-02-12 | 13F | MetLife Investment Management, LLC | 4.733 | 0,00 | 460 | 36,90 | ||||
| 2026-04-06 | 13F | Versant Capital Management, Inc | 104 | 0,00 | 10 | 0,00 | ||||
| 2026-02-05 | 13F | Bessemer Group Inc | 4.274 | -1,16 | 0 | |||||
| 2026-02-06 | 13F | Tortoise Investment Management, LLC | 0 | -100,00 | 0 | |||||
| 2026-02-12 | 13F | Polen Capital Management Llc | 0 | -100,00 | 0 | |||||
| 2026-02-17 | 13F | Price T Rowe Associates Inc /md/ | 4.782 | 10,59 | 0 | |||||
| 2026-02-12 | 13F | Jane Street Group, Llc | 25.219 | -12,99 | 2.453 | 18,96 | ||||
| 2026-02-11 | 13F | Franklin Resources Inc | 15.828 | 39,48 | 1.540 | 90,71 | ||||
| 2026-02-11 | 13F | Ameritas Investment Partners, Inc. | 721 | 70 | ||||||
| 2026-02-09 | 13F | Hartland & Co., LLC | 49 | 0,00 | 5 | 33,33 | ||||
| 2026-02-05 | 13F | Cambridge Investment Research Advisors, Inc. | 2.430 | 0 | ||||||
| 2026-02-13 | 13F | State Street Corp | 192.952 | 3,05 | 18.770 | 40,88 | ||||
| 2026-04-24 | 13F | Conestoga Capital Advisors, LLC | 21.215 | 0,00 | 2.042 | -1,02 | ||||
| 2026-01-30 | 13F | Us Bancorp \de\ | 506 | -5,60 | 49 | 28,95 | ||||
| 2026-02-17 | 13F | Millennium Management Llc | 3.202 | -96,74 | 311 | -95,55 | ||||
| 2026-02-06 | 13F | Bare Financial Services, Inc | 5 | 0 | ||||||
| 2026-04-22 | 13F | Sterling Capital Management LLC | 53 | -5,36 | 5 | 0,00 | ||||
| 2026-01-27 | 13F | Zurcher Kantonalbank (Zurich Cantonalbank) | 5.824 | 4,80 | 567 | 43,29 | ||||
| 2026-02-11 | 13F | Cerity Partners LLC | 2.679 | 261 | ||||||
| 2025-11-10 | 13F | Options Solutions, Llc | 0 | -100,00 | 0 | -100,00 | ||||
| 2026-01-29 | 13F | Cornerstone Investment Partners, LLC | 2.303 | 224 | ||||||
| 2026-02-17 | 13F | Susquehanna Portfolio Strategies, LLC | 3.354 | 326 | ||||||
| 2026-04-13 | 13F | IFP Advisors, Inc | 156 | -23,15 | 15 | -21,05 | ||||
| 2026-02-17 | 13F | Qube Research & Technologies Ltd | 60.958 | 7,27 | 5.930 | 46,65 | ||||
| 2026-02-13 | 13F | Charles Schwab Investment Management Inc | 68.220 | -0,39 | 6.636 | 36,18 | ||||
| 2026-04-13 | 13F | Massmutual Trust Co Fsb/adv | 12 | -14,29 | 1 | 0,00 | ||||
| 2026-02-05 | 13F | Allworth Financial LP | 47 | 30,56 | 5 | 100,00 | ||||
| 2026-01-23 | 13F | Oak Ridge Investments Llc | 37.962 | -2,64 | 3.693 | 33,09 | ||||
| 2026-02-17 | 13F | California State Teachers Retirement System | 7.938 | -8,53 | 772 | 25,12 | ||||
| 2026-02-09 | 13F | Ballast Asset Management, LP | 36.237 | -3,25 | 3.525 | 32,27 | ||||
| 2026-02-13 | 13F | Pinnacle Wealth Planning Services, Inc. | 841 | 82 | ||||||
| 2026-02-17 | 13F | Bank Of America Corp /de/ | 30.311 | 48,42 | 2.949 | 102,89 | ||||
| 2026-02-05 | 13F | 1620 Investment Advisors, Inc. | 402 | 0,00 | 39 | 39,29 | ||||
| 2026-02-13 | 13F | Manufacturers Life Insurance Company, The | 0 | -100,00 | 0 | |||||
| 2026-02-13 | 13F | American Century Companies Inc | 21.985 | 2,79 | 2.139 | 40,47 | ||||
| 2026-04-23 | 13F | Marquette Asset Management, LLC | 30 | 0,00 | 3 | 0,00 | ||||
| 2026-04-07 | 13F | Retirement Wealth Solutions LLC | 145 | -7,64 | 14 | -13,33 | ||||
| 2026-02-13 | 13F | Quarry LP | 1 | -99,82 | 0 | -100,00 | ||||
| 2026-02-17 | 13F | Boothbay Fund Management, Llc | 0 | -100,00 | 0 | |||||
| 2026-02-17 | 13F | D. E. Shaw & Co., Inc. | 0 | -100,00 | 0 | |||||
| 2026-02-17 | 13F | Algert Global Llc | 85.660 | 68,63 | 8 | 166,67 | ||||
| 2026-02-06 | 13F | Covestor Ltd | 18 | -21,74 | 0 | |||||
| 2026-02-17 | 13F | Engineers Gate Manager LP | 3.503 | 341 | ||||||
| 2025-11-14 | 13F | Point72 Europe (London) LLP | 13 | 1 | ||||||
| 2026-02-05 | 13F | Baader Bank INC | 6.122 | 595 | ||||||
| 2026-02-13 | 13F | Stifel Financial Corp | 28.198 | -1,97 | 2.743 | 34,00 | ||||
| 2026-02-17 | 13F | Camarda Financial Advisors, LLC | 28.874 | 2.809 | ||||||
| 2026-02-17 | 13F | Kemnay Advisory Services Inc. | 1.909 | 186 | ||||||
| 2026-02-06 | 13F | FourThought Financial Partners, LLC | 4.607 | 448 | ||||||
| 2026-02-13 | 13F | MAI Capital Management | 7 | 1 | ||||||
| 2026-02-17 | 13F | Lazard Asset Management Llc | 42.390 | 5,52 | 4.124 | 44,26 | ||||
| 2026-02-13 | 13F | Parkside Financial Bank & Trust | 190 | 0,00 | 18 | 38,46 | ||||
| 2026-04-13 | 13F | Wolff Wiese Magana Llc | 15 | 1 | ||||||
| 2026-01-29 | 13F | Vanguard Group Inc | 560.048 | -1,14 | 54.481 | 35,15 | ||||
| 2025-11-12 | 13F | Park Square Financial Group, LLC | 0 | -100,00 | 0 | |||||
| 2025-11-12 | 13F/A | Norges Bank | 0 | -100,00 | 0 | -100,00 | ||||
| 2026-02-12 | 13F | State Board Of Administration Of Florida Retirement System | 2.240 | 218 | ||||||
| 2026-02-10 | 13F | Connor, Clark & Lunn Investment Management Ltd. | 0 | -100,00 | 0 | |||||
| 2026-04-06 | 13F | GAMMA Investing LLC | 40 | 21,21 | 4 | 0,00 | ||||
| 2026-02-10 | 13F | State of Wyoming | 933 | -7,44 | 91 | 26,76 | ||||
| 2026-02-13 | 13F | Police & Firemen's Retirement System of New Jersey | 2.056 | 0,00 | 200 | 36,99 | ||||
| 2026-01-28 | 13F | Teacher Retirement System Of Texas | 25.946 | -14,41 | 2.524 | 17,01 | ||||
| 2026-02-02 | 13F | Nkcfo Llc | 790 | -41,48 | 0 | |||||
| 2026-02-09 | 13F | Keating Financial Advisory Services, Inc. | 1 | 0 | ||||||
| 2026-02-10 | 13F | Rothschild Investment Llc | 3 | 0 | ||||||
| 2026-04-13 | 13F | Hm Payson & Co | 2.711 | 0,67 | 261 | -0,38 | ||||
| 2026-01-23 | 13F | Assetmark, Inc | 38 | 0,00 | 4 | 50,00 |
Other Listings
| DE:46K | 75,50 € |