Grundlæggende statistik
| Institutionelle aktier (lange) | 139.901.511 - 69,32% (ex 13D/G) - change of -32,05MM shares -18,64% MRQ |
| Institutionel værdi (lang) | $ 3.770.193 USD ($1000) |
Institutionelt ejerskab og aktionærer
Home BancShares, Inc. (US:HOMB) har 360 institutionelle ejere og aktionærer, der har indsendt 13D/G- eller 13F-formularer til Securities Exchange Commission (SEC). Disse institutioner har i alt 139,901,511 aktier. Største aktionærer omfatter BlackRock, Inc., Vanguard Group Inc, State Street Corp, Dimensional Fund Advisors Lp, Capital Research Global Investors, Geode Capital Management, Llc, American Century Companies Inc, First Trust Advisors Lp, Copeland Capital Management, LLC, and T. Rowe Price Investment Management, Inc. .
Home BancShares, Inc. (NYSE:HOMB) institutionel ejerskabsstruktur viser aktuelle positioner i virksomheden efter institutioner og fonde, samt seneste ændringer i positionsstørrelse. Større aktionærer kan omfatte individuelle investorer, investeringsforeninger, hedgefonde eller institutioner. Skema 13D angiver, at investoren besidder (eller besidder) mere end 5 % af virksomheden og har til hensigt (eller har til hensigt at) aktivt at forfølge en ændring i forretningsstrategi. Skema 13G indikerer en passiv investering på over 5%.
The share price as of May 1, 2026 is 26,74 / share. Previously, on May 5, 2025, the share price was 28,36 / share. This represents a decline of 5,71% over that period.

Fondens stemningsscore
Fund Sentiment Score (fka Ownership Accumulation Score) finder de aktier, der bliver mest købt af fonde. Det er resultatet af en sofistikeret, multi-faktor kvantitativ model, der identificerer virksomheder med de højeste niveauer af institutionel akkumulering. Scoringsmodellen bruger en kombination af den samlede stigning i oplyste ejere, ændringerne i porteføljeallokeringer i disse ejere og andre målinger. Tallet går fra 0 til 100, hvor højere tal indikerer et højere niveau af akkumulering for sine jævnaldrende, og 50 er gennemsnittet.
Opdateringsfrekvens: Dagligt
Se Ownership Explorer, som giver en liste over højest rangerende virksomheder.
AI+ Ask Fintel’s AI assistant about Home BancShares, Inc..
Select a question to share a public post with an AI-crafted answer.
Thinking of good questions…
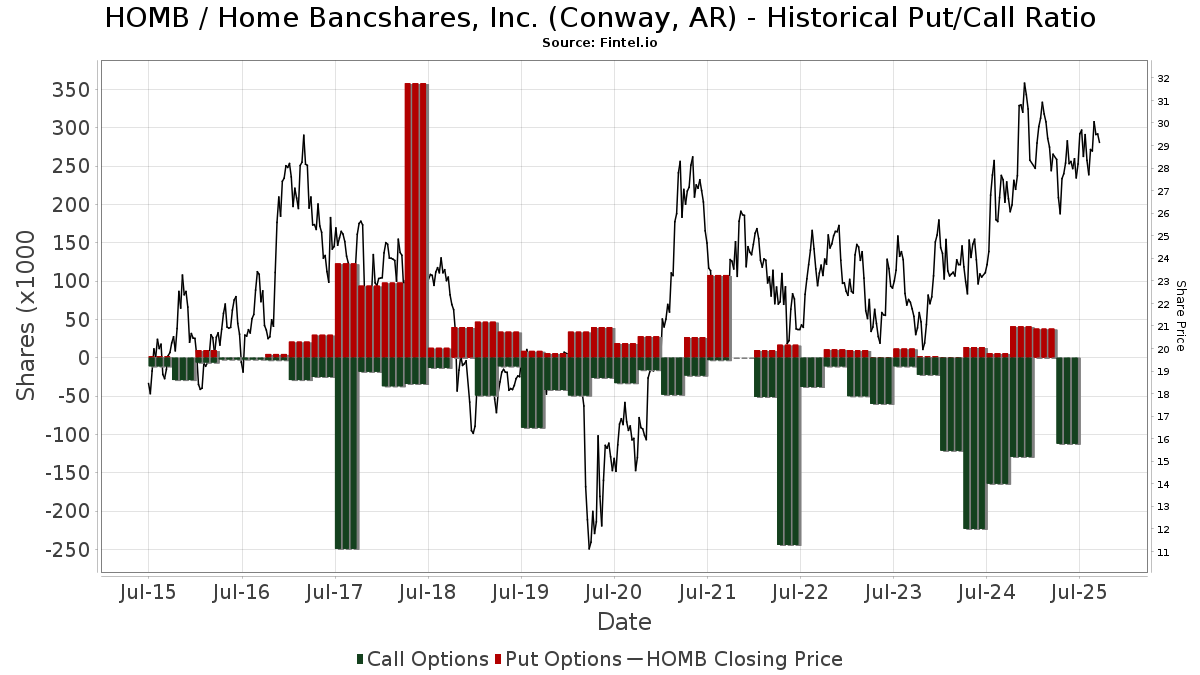
Institutionel Put/Call-forhold
Ud over at indberette standardaktie- og gældsudstedelser skal institutter med mere end 100 mill. aktiver under forvaltning også oplyse deres put- og call-optionsbeholdninger. Da salgsoptioner generelt indikerer negativ stemning, og købsoptioner indikerer positiv stemning, kan vi få en fornemmelse af den overordnede institutionelle stemning ved at plotte forholdet mellem put og kald. Diagrammet til højre viser det historiske put/call-forhold for dette instrument.
Brug af Put/Call Ratio som en indikator for investorernes stemning overvinder en af de vigtigste mangler ved at bruge totalt institutionelt ejerskab, som er, at en betydelig mængde af aktiver under forvaltning investeres passivt for at spore indekser. Passivt forvaltede fonde køber typisk ikke optioner, så indikatoren for put/call-forholdet følger mere nøje følelsen af aktivt forvaltede fonde.
13D/G-arkivering
Vi præsenterer 13D/G ansøgninger separat fra 13F ansøgninger på grund af den forskellige behandling af SEC. 13D/G-ansøgninger kan indgives af grupper af investorer (med én ledende), hvorimod 13F-ansøgninger ikke kan. Dette resulterer i situationer, hvor en investor kan indsende en 13D/G, der rapporterer én værdi for de samlede aktier (der repræsenterer alle de aktier, der ejes af investorgruppen), men derefter indsender en 13F, der rapporterer en anden værdi for de samlede aktier (der udelukkende repræsenterer deres egne) ejendomsret). Det betyder, at aktieejerskab af 13D/G-arkiver og 13F-arkiveringer ofte ikke er direkte sammenlignelige, så vi præsenterer dem separat.
Bemærk: Fra den 16. maj 2021 viser vi ikke længere ejere, der ikke har indsendt en 13D/G inden for det seneste år. Tidligere viste vi den fulde historie af 13D/G-arkiver. Generelt skal enheder, der er forpligtet til at indgive 13D/G-ansøgninger, indgive mindst årligt, før de indsender en afsluttende ansøgning. Dog forlader fonde nogle gange positioner uden at indsende en afsluttende ansøgning (dvs. de afvikler), så visning af den fulde historie resulterede nogle gange i forvirring om det nuværende ejerskab. For at undgå forvirring viser vi nu kun 'aktuelle' ejere - det vil sige - ejere, der har anmeldt inden for det seneste år.
Upgrade to unlock premium data.
| Fil dato | Form | Investor | Forrige Aktier |
Seneste Aktier |
Δ Aktier (Procent) |
Ejendomsret (Procent) |
Δ Ejerskab (Procent) |
|
|---|---|---|---|---|---|---|---|---|
| 2026-04-29 | VANGUARD PORTFOLIO MANAGEMENT LLC | 11,029,235 | 5.60 | |||||
| 2026-03-27 | VANGUARD GROUP INC | 20,551,505 | 0 | -100.00 | 0.00 | -100.00 |
13F og NPORT arkivering
Detaljer om 13F-arkivering er gratis. Detaljer om NP-ansøgninger kræver et premium-medlemskab. Grønne rækker angiver nye positioner. Røde rækker angiver lukkede positioner. Klik på linket ikon for at se den fulde transaktionshistorik.
Opgrader
for at låse premium-data op og eksportere til Excel ![]() .
.
| Fil dato | Kilde | Investor | Type | Gennemsnitlig pris (Øst) |
Aktier | Δ Aktier (%) |
Rapporteret Værdi ($1000) |
Δ Værdi (%) |
Port Alloc (%) |
|
|---|---|---|---|---|---|---|---|---|---|---|
| 2026-02-13 | 13F | Caitong International Asset Management Co., Ltd | 0 | -100,00 | 0 | |||||
| 2026-02-17 | 13F | Numerai GP LLC | 88.787 | 2.467 | ||||||
| 2026-01-26 | 13F | KBC Group NV | 5.632 | 0,00 | 0 | |||||
| 2026-04-23 | 13F | Private Wealth Management Group, LLC | 252 | -18,45 | 7 | -25,00 | ||||
| 2026-04-28 | 13F | Stephens Inc /ar/ | 257.469 | 3,42 | 6.934 | 0,26 | ||||
| 2026-02-17 | 13F | Fmr Llc | 1.846.972 | 0,78 | 51.309 | -1,07 | ||||
| 2026-01-29 | 13F | State Of Michigan Retirement System | 43.230 | -0,92 | 1.201 | -2,76 | ||||
| 2026-02-17 | 13F | Occudo Quantitative Strategies Lp | 0 | -100,00 | 0 | |||||
| 2026-02-17 | 13F | Engineers Gate Manager LP | 59.119 | -65,19 | 1.642 | -65,83 | ||||
| 2026-02-10 | 13F | Bank of New York Mellon Corp | 1.606.481 | -7,70 | 44.628 | -9,39 | ||||
| 2026-02-17 | 13F | Lazard Asset Management Llc | 209.658 | -14,50 | 5.824 | -16,07 | ||||
| 2026-02-13 | 13F | JustInvest LLC | 11.248 | -7,03 | 312 | -8,77 | ||||
| 2026-04-23 | 13F | Farmers & Merchants Investments Inc | 160 | 0,00 | 4 | 0,00 | ||||
| 2026-04-06 | 13F | GAMMA Investing LLC | 2.517 | -14,30 | 68 | -17,28 | ||||
| 2026-02-13 | 13F | Gts Securities Llc | 0 | -100,00 | 0 | |||||
| 2026-03-04 | 13F | AG Campbell Advisory, LLC | 167.475 | 4.652 | ||||||
| 2026-04-06 | 13F | Versant Capital Management, Inc | 733 | 23,61 | 20 | 18,75 | ||||
| 2026-04-15 | 13F | Financial Management Professionals, Inc. | 83.791 | 0,00 | 2.256 | -3,05 | ||||
| 2026-02-17 | 13F | Armistice Capital, Llc | 10.559 | 293 | ||||||
| 2026-02-11 | 13F | Rise Advisors, LLC | 0 | -100,00 | 0 | |||||
| 2026-02-13 | 13F | Parkside Financial Bank & Trust | 3.238 | 32,76 | 90 | 28,99 | ||||
| 2026-02-17 | 13F | Toronto Dominion Bank | 3 | 0 | ||||||
| 2026-02-17 | 13F | DV Trading LLC | 700 | 19 | ||||||
| 2026-04-23 | 13F | Marquette Asset Management, LLC | 0 | -100,00 | 0 | |||||
| 2025-11-14 | 13F | Binnacle Investments Inc | 1.488 | 11,96 | 42 | 13,51 | ||||
| 2026-02-13 | 13F | American Century Companies Inc | 4.576.833 | -3,70 | 127.144 | -5,47 | ||||
| 2026-02-03 | 13F | Crossmark Global Holdings, Inc. | 11.579 | -1,17 | 322 | -3,02 | ||||
| 2026-02-06 | 13F | Gsa Capital Partners Llp | 0 | -100,00 | 0 | |||||
| 2025-11-14 | 13F | Susquehanna International Group, Llp | Call | 0 | -100,00 | 0 | -100,00 | |||
| 2026-02-13 | 13F | Maltese Capital Management Llc | 51.400 | -20,92 | 1.428 | -22,40 | ||||
| 2026-02-13 | 13F | Great West Life Assurance Co /can/ | 105.837 | -5,70 | 3 | -33,33 | ||||
| 2026-02-13 | 13F | Quarry LP | 167 | -69,53 | 5 | -73,33 | ||||
| 2025-11-07 | 13F | Sierra Ocean, Llc | 0 | -100,00 | 0 | |||||
| 2025-11-12 | 13F | Transce3nd, LLC | 0 | -100,00 | 0 | |||||
| 2026-02-17 | 13F | Two Sigma Securities, Llc | 10.029 | 279 | ||||||
| 2026-04-30 | 13F | Torren Management, LLC | 78 | -95,57 | 2 | -95,83 | ||||
| 2026-02-13 | 13F | BNP Paribas Asset Management Holding S.A. | 2.012 | 31,93 | 0 | |||||
| 2026-04-22 | 13F | Fort Washington Investment Advisors Inc /oh/ | 1.064.495 | 52,28 | 28.667 | 47,62 | ||||
| 2026-05-01 | 13F | Hantz Financial Services, Inc. | 15.234 | 364,88 | 0 | |||||
| 2026-02-12 | 13F | State Board Of Administration Of Florida Retirement System | 140.941 | 1,96 | 3.915 | 0,10 | ||||
| 2025-11-07 | 13F | Ballast, Inc. | 0 | -100,00 | 0 | -100,00 | ||||
| 2026-04-30 | 13F | Horrell Capital Management, Inc. | 89.448 | -8,18 | 2.409 | -11,01 | ||||
| 2026-02-02 | 13F | Principal Financial Group Inc | 396.182 | -4,18 | 11.006 | -5,95 | ||||
| 2026-02-17 | 13F | Hancock Whitney Corp | 15.953 | 0,00 | 443 | -1,77 | ||||
| 2026-04-24 | 13F | Strs Ohio | 13.400 | -11,84 | 361 | -14,69 | ||||
| 2026-02-17 | 13F | Mercer Global Advisors Inc /adv | 7.339 | 204 | ||||||
| 2026-02-17 | 13F | Qube Research & Technologies Ltd | 402.066 | -37,94 | 11.169 | -39,08 | ||||
| 2026-02-12 | 13F | Aviva Plc | 21.297 | 592 | ||||||
| 2026-02-17 | 13F | Shelton Capital Management | 7.415 | 0,00 | 206 | -1,91 | ||||
| 2026-02-19 | 13F | CI Private Wealth, LLC | 27.986 | -46,36 | 777 | -47,36 | ||||
| 2026-04-21 | 13F | Mendel Capital Management LLC | 15.748 | 0,00 | 424 | -4,72 | ||||
| 2026-02-09 | 13F | Hartland & Co., LLC | 2.195 | 214,02 | 61 | 215,79 | ||||
| 2026-02-13 | 13F | Kennedy Capital Management, Inc. | 1.106.228 | 16,36 | 30.731 | 14,22 | ||||
| 2026-02-11 | 13F | Cerity Partners LLC | 16.672 | 50,44 | 463 | 47,92 | ||||
| 2026-02-13 | 13F | First Trust Advisors Lp | 3.060.888 | 37,26 | 85.031 | 34,73 | ||||
| 2026-04-30 | 13F | Sequoia Financial Advisors, LLC | 0 | -100,00 | 0 | |||||
| 2026-01-29 | 13F | Copeland Capital Management, LLC | 2.622.015 | -5,19 | 72.840 | -6,93 | ||||
| 2026-02-17 | 13F | Mirabella Financial Services Llp | 0 | -100,00 | 0 | |||||
| 2026-02-18 | 13F | GWM Advisors LLC | 1.240 | 0,65 | 34 | 0,00 | ||||
| 2026-01-30 | 13F | Mitsubishi UFJ Trust & Banking Corp | 58.849 | -34,54 | 1.635 | -35,77 | ||||
| 2026-04-20 | 13F | Jfs Wealth Advisors, Llc | 119 | 9,17 | 3 | 0,00 | ||||
| 2026-02-17 | 13F | Twinbeech Capital Lp | 68.383 | 175,92 | 1.900 | 170,90 | ||||
| 2026-01-26 | 13F | Reyes Financial Architecture, Inc. | 2.221 | 62 | ||||||
| 2026-02-13 | 13F | Dynamic Technology Lab Private Ltd | 0 | -100,00 | 0 | |||||
| 2026-01-16 | 13F | Legacy Capital Wealth Partners, LLC | 23.093 | 0,65 | 642 | -1,23 | ||||
| 2026-02-13 | 13F | Rafferty Asset Management, LLC | 160.516 | -11,29 | 4.459 | -12,91 | ||||
| 2026-02-11 | 13F | Fox Run Management, L.l.c. | 0 | -100,00 | 0 | |||||
| 2026-02-11 | 13F | Capital Research Global Investors | 5.588.267 | 4,46 | 155.242 | 2,54 | ||||
| 2026-01-27 | 13F | Regions Financial Corp | 59.944 | -6,42 | 1.665 | -8,11 | ||||
| 2026-02-17 | 13F | Millennium Management Llc | 210.275 | 62,47 | 5.841 | 59,50 | ||||
| 2025-11-14 | 13F | Texas Permanent School Fund | 0 | -100,00 | 0 | |||||
| 2026-02-17 | 13F | Ancora Advisors, LLC | 1.576 | 0,00 | 44 | -2,27 | ||||
| 2026-02-13 | 13F | Umb Bank N A/mo | 3.293 | -3,94 | 91 | -6,19 | ||||
| 2026-02-13 | 13F | FJ Capital Management LLC | 0 | -100,00 | 0 | |||||
| 2026-02-12 | 13F | Loomis Sayles & Co L P | 1.342.435 | 11,69 | 37.293 | 9,63 | ||||
| 2026-04-21 | 13F | Vise Technologies, Inc. | 11.002 | 0,00 | 306 | 0,00 | ||||
| 2026-05-01 | 13F | International Assets Investment Management, Llc | 48.036 | 0,00 | 1.307 | -2,10 | ||||
| 2026-02-11 | 13F | BI Asset Management Fondsmaeglerselskab A/S | 0 | -100,00 | 0 | |||||
| 2026-02-12 | 13F | EntryPoint Capital, LLC | 16.472 | 0,00 | 458 | -1,93 | ||||
| 2026-04-30 | 13F | Nuveen, LLC | 2.511.892 | -9,53 | 67.645 | -12,30 | ||||
| 2026-02-04 | 13F | Swiss Life Asset Management Ltd | 8.860 | 0,00 | 246 | -1,60 | ||||
| 2026-02-17 | 13F | Alliancebernstein L.p. | 370.811 | -4,84 | 10.301 | -6,58 | ||||
| 2026-04-29 | 13F | CVA Family Office, LLC | 179 | 5 | ||||||
| 2026-02-09 | 13F | Fisher Asset Management, LLC | 1.956.928 | -6,03 | 54.363 | -7,76 | ||||
| 2026-02-13 | 13F | Entropy Technologies, LP | 43.859 | 1.218 | ||||||
| 2026-04-09 | 13F | Everhart Financial Group, Inc. | 25.610 | -3,02 | 690 | -6,00 | ||||
| 2026-02-10 | 13F | Connor, Clark & Lunn Investment Management Ltd. | 71.492 | 1.986 | ||||||
| 2026-02-10 | 13F | Eurizon Capital SGR S.p.A. | 2.094 | 58 | ||||||
| 2026-04-24 | 13F | ProShare Advisors LLC | 901.671 | 2.058,04 | 24.282 | 1.993,28 | ||||
| 2026-04-07 | 13F | CoreCap Advisors, LLC | 84.215 | -3,43 | 2.268 | -6,40 | ||||
| 2025-11-05 | 13F | Ranger Investment Management, L.P. | 0 | -100,00 | 0 | |||||
| 2026-02-12 | 13F | CIBC Private Wealth Group, LLC | 1.083 | 164,79 | 30 | 172,73 | ||||
| 2026-02-12 | 13F | Rossby Financial, LCC | 92 | 3 | ||||||
| 2026-02-12 | 13F | Dimensional Fund Advisors Lp | 6.160.888 | 3,41 | 171.152 | 1,52 | ||||
| 2026-02-13 | 13F | Mariner, LLC | 32.074 | 4,21 | 891 | 2,30 | ||||
| 2026-02-13 | 13F | Smartleaf Asset Management LLC | 4.327 | -31,12 | 121 | -32,02 | ||||
| 2025-11-14 | 13F | Point72 Asia (Singapore) Pte. Ltd. | 3.132 | -17,97 | 89 | -18,52 | ||||
| 2025-11-14 | 13F | Bridgefront Capital, LLC | 0 | -100,00 | 0 | -100,00 | ||||
| 2026-02-11 | 13F | Financiere des Professionnels - Fonds d,investissement inc. | 0 | -100,00 | 0 | |||||
| 2026-02-17 | 13F | Quantinno Capital Management LP | 20.985 | 85,56 | 583 | 81,88 | ||||
| 2026-02-05 | 13F | Allworth Financial LP | 6.959 | -0,01 | 193 | -1,53 | ||||
| 2026-02-12 | 13F | Federated Hermes, Inc. | 14.698 | -10,23 | 408 | -11,88 | ||||
| 2026-02-13 | 13F | Basswood Capital Management, L.l.c. | 166.538 | 0,00 | 4.626 | -1,85 | ||||
| 2025-11-12 | 13F | Group One Trading, L.p. | Call | 0 | -100,00 | 0 | -100,00 | |||
| 2026-04-17 | 13F | Brown, Lisle/cummings, Inc. | 69 | 2 | ||||||
| 2026-02-05 | 13F | Barr E S & Co | 2.413.987 | 3,02 | 67.061 | 1,12 | ||||
| 2026-02-03 | 13F | SBI Securities Co., Ltd. | 0 | -100,00 | 0 | |||||
| 2025-11-13 | 13F | Twin Tree Management, LP | 0 | -100,00 | 0 | |||||
| 2026-02-11 | 13F | MidWestOne Financial Group, Inc. | 36.390 | 0,00 | 1.011 | -1,85 | ||||
| 2026-02-13 | 13F | MAI Capital Management | 58.709 | 0,54 | 1.631 | -1,33 | ||||
| 2026-02-12 | 13F | Great Lakes Advisors, Llc | 216.728 | 0,00 | 6.021 | -1,84 | ||||
| 2026-02-17 | 13F | Trexquant Investment LP | 0 | -100,00 | 0 | |||||
| 2026-04-23 | 13F | SJS Investment Consulting Inc. | 30 | 36,36 | 1 | |||||
| 2026-01-29 | 13F | DecisionPoint Financial, LLC | 586.705 | -11,51 | 16.299 | -12,74 | ||||
| 2026-02-17 | 13F | Farringdon Capital, Ltd. | 0 | -100,00 | 0 | |||||
| 2026-04-15 | 13F | DAVENPORT & Co LLC | 132.950 | 0,02 | 3.580 | -3,03 | ||||
| 2026-04-29 | 13F | American Capital Advisory, LLC | 0 | -100,00 | 0 | |||||
| 2026-04-23 | 13F | CWM Advisors, LLC | 19.023 | 13,10 | 512 | 9,64 | ||||
| 2026-02-13 | 13F | Walleye Capital LLC | 0 | -100,00 | 0 | |||||
| 2026-04-08 | 13F | DiNuzzo Private Wealth, Inc. | 37 | 0,00 | 1 | -100,00 | ||||
| 2026-02-13 | 13F | Arrowstreet Capital, Limited Partnership | 732.924 | 44,51 | 20.361 | 41,85 | ||||
| 2026-02-13 | 13F | Aptus Capital Advisors, LLC | 380.117 | 0,44 | 10.560 | -1,41 | ||||
| 2026-04-24 | 13F | Yousif Capital Management, Llc | 53.527 | -5,44 | 1.441 | -10,66 | ||||
| 2025-11-14 | 13F | ExodusPoint Capital Management, LP | 0 | -100,00 | 0 | |||||
| 2026-02-12 | 13F | Ci Investments Inc. | 0 | -100,00 | 0 | |||||
| 2026-02-17 | 13F | Graham Capital Management, L.P. | 8.272 | -86,08 | 230 | -86,39 | ||||
| 2026-02-12 | 13F | New York State Common Retirement Fund | 61.827 | 0,00 | 1.718 | -1,83 | ||||
| 2026-02-13 | 13F | SRS Capital Advisors, Inc. | 1.548 | -64,87 | 43 | -66,13 | ||||
| 2026-02-02 | 13F | Danske Bank A/s | 3.400 | 70,00 | 94 | 67,86 | ||||
| 2026-02-06 | 13F | Global Retirement Partners, LLC | 20.280 | 24.937,04 | 563 | 28.050,00 | ||||
| 2026-02-13 | 13F | Citigroup Inc | 153.760 | 12,36 | 4.271 | 10,30 | ||||
| 2026-02-17 | 13F | Jones Financial Companies Lllp | 7.910 | -0,58 | 220 | -3,95 | ||||
| 2025-11-13 | 13F | Jump Financial, LLC | 0 | -100,00 | 0 | |||||
| 2025-11-21 | 13F/A | CIBC Bancorp USA Inc. | 20.093 | 569 | ||||||
| 2026-02-10 | 13F | Globeflex Capital L P | 4.786 | 0,00 | 133 | -2,22 | ||||
| 2026-01-29 | 13F | UBS Group AG | 1.593.647 | 1,99 | 44.272 | 0,12 | ||||
| 2026-02-12 | 13F | BlackRock, Inc. | 23.440.818 | -0,72 | 651.186 | -2,54 | ||||
| 2026-02-09 | 13F | Jefferies Financial Group Inc. | 95.668 | 2.658 | ||||||
| 2026-04-20 | 13F | BTC Capital Management, Inc. | 22.383 | 7,56 | 608 | 5,19 | ||||
| 2026-04-30 | 13F | Hsbc Holdings Plc | 142.969 | 78,66 | 3.853 | 73,17 | ||||
| 2026-04-28 | 13F | Harbor Capital Advisors, Inc. | 30.763 | 45,96 | 1 | |||||
| 2026-02-13 | 13F | Barclays Plc | 1.011.942 | -1,64 | 28.112 | -3,45 | ||||
| 2026-02-17 | 13F | Magnetar Financial LLC | 0 | -100,00 | 0 | |||||
| 2026-02-11 | 13F | Simplex Trading, Llc | Put | 0 | -100,00 | 0 | ||||
| 2026-02-05 | 13F | Amalgamated Bank | 77.147 | -4,28 | 2 | 0,00 | ||||
| 2026-02-13 | 13F | Neuberger Berman Group LLC | 27.911 | -5,54 | 775 | -7,30 | ||||
| 2026-02-17 | 13F | D. E. Shaw & Co., Inc. | 153.910 | -15,05 | 4.276 | -16,62 | ||||
| 2026-02-11 | 13F | NFC Investments, LLC | 10.000 | 0,00 | 0 | |||||
| 2026-01-29 | 13F | Teachers Retirement System Of The State Of Kentucky | 61.955 | 0,00 | 2 | 0,00 | ||||
| 2026-02-03 | 13F | Mitsubishi UFJ Kokusai Asset Management Co., Ltd. | 461 | 0,00 | 13 | -7,69 | ||||
| 2026-02-17 | 13F | Brevan Howard Capital Management LP | 0 | -100,00 | 0 | |||||
| 2026-05-01 | 13F | HFM Investment Advisors, LLC | 16 | 14,29 | 0 | |||||
| 2026-02-17 | 13F | Man Group plc | 28.457 | 791 | ||||||
| 2026-04-14 | 13F | Bay Harbor Wealth Management, LLC | 22 | 57,14 | 1 | |||||
| 2026-02-17 | 13F | Two Sigma Advisers, Lp | 0 | -100,00 | 0 | |||||
| 2026-02-17 | 13F | Snowden Capital Advisors LLC | 19.706 | -11,57 | 547 | -13,17 | ||||
| 2026-02-10 | 13F | Argent Trust Co | 9.500 | 0,00 | 264 | -1,87 | ||||
| 2026-02-13 | 13F | Public Employees Retirement Association Of Colorado | 18.289 | 0,00 | 1 | |||||
| 2026-02-17 | 13F | Susquehanna International Group, Llp | 153.734 | 102,79 | 4.271 | 99,07 | ||||
| 2026-04-29 | 13F | Oregon Public Employees Retirement Fund | 37.566 | 3,47 | 1.012 | 0,30 | ||||
| 2026-05-01 | 13F | Commonwealth Of Pennsylvania Public School Empls Retrmt Sys | 45.836 | 0,21 | 1.234 | -2,83 | ||||
| 2026-01-26 | 13F | Cwm, Llc | 35.589 | 25,30 | 1 | |||||
| 2026-04-24 | 13F | CHICAGO TRUST Co NA | 23.573 | 0,86 | 635 | -2,31 | ||||
| 2026-04-13 | 13F | True Wealth Design, LLC | 0 | -100,00 | 0 | |||||
| 2026-04-13 | 13F | Arkansas Financial Group, Inc. | 9.127 | 0,00 | 257 | 1,19 | ||||
| 2026-04-02 | 13F | Ares Financial Consulting, LLC | 294 | 8 | ||||||
| 2026-02-18 | 13F | Mackenzie Financial Corp | 11.787 | -68,18 | 329 | -68,61 | ||||
| 2026-02-05 | 13F | Northwestern Mutual Investment Management Company, Llc | 40.895 | 0,11 | 1.136 | -1,73 | ||||
| 2026-02-19 | 13F | Invesco Ltd. | 458.757 | 5,90 | 12.744 | 3,95 | ||||
| 2026-02-24 | 13F | Villanova Investment Management Co LLC | 114.093 | 0,41 | 3.170 | -1,43 | ||||
| 2026-04-24 | 13F | Gilliland Jeter Wealth Management LLC | 18.212 | 0,00 | 490 | -2,97 | ||||
| 2026-02-12 | 13F | Ensign Peak Advisors, Inc | 9.160 | -57,12 | 254 | -57,95 | ||||
| 2026-02-17 | 13F | Tower Research Capital LLC (TRC) | 6.918 | 3,84 | 192 | 2,13 | ||||
| 2026-04-20 | 13F | Apella Capital, LLC | 10.261 | 276 | ||||||
| 2025-11-07 | 13F | Ontario Teachers Pension Plan Board | 0 | -100,00 | 0 | -100,00 | ||||
| 2026-05-01 | 13F | Sachetta, LLC | 31 | 0,00 | 1 | |||||
| 2026-04-17 | 13F | Vermillion Wealth Management, Inc. | 17 | 0 | ||||||
| 2026-04-30 | 13F | Stronghold Wealth Management L.L.C. | 0 | -100,00 | 0 | |||||
| 2026-02-06 | 13F | Mach-1 Financial Group, Inc. | 17.940 | 498 | ||||||
| 2026-02-13 | 13F | Aigen Investment Management, Lp | 0 | -100,00 | 0 | |||||
| 2026-04-20 | 13F | State of Alaska, Department of Revenue | 18.212 | 0,00 | 0 | |||||
| 2026-02-11 | 13F | Picton Mahoney Asset Management | 42 | 0,00 | 1 | |||||
| 2026-02-09 | 13F | Geode Capital Management, Llc | 4.602.368 | 0,09 | 127.873 | -1,75 | ||||
| 2025-11-12 | 13F | Edgestream Partners, L.P. | 0 | -100,00 | 0 | |||||
| 2026-02-06 | 13F | Bare Financial Services, Inc | 0 | -100,00 | 0 | |||||
| 2026-02-11 | 13F | Ameritas Investment Partners, Inc. | 48.799 | 1.356 | ||||||
| 2026-02-10 | 13F | Goldman Sachs Group Inc | 1.475.609 | 10,54 | 40.992 | 8,51 | ||||
| 2026-02-18 | 13F | State of Tennessee, Treasury Department | 77.717 | 3,44 | 2.246 | 5,64 | ||||
| 2026-04-30 | 13F | Whipplewood Advisors, LLC | 149 | 4 | ||||||
| 2026-02-17 | 13F | Cim Investment Mangement Inc | 8.491 | 0,00 | 236 | -2,08 | ||||
| 2026-02-11 | 13F | LPL Financial LLC | 214.356 | 4,62 | 5.955 | 2,69 | ||||
| 2026-04-15 | 13F | Trust Point Inc. | 0 | -100,00 | 0 | |||||
| 2026-04-07 | 13F | Farther Finance Advisors, LLC | 500 | 8,70 | 14 | 8,33 | ||||
| 2025-11-07 | 13F | Hodges Capital Management Inc. | 0 | -100,00 | 0 | |||||
| 2026-02-17 | 13F | Raymond James Financial Inc | 209.266 | 3,57 | 5.813 | 1,68 | ||||
| 2026-02-17 | 13F | Nearwater Capital Markets, Ltd | 0 | -100,00 | 0 | |||||
| 2026-02-10 | 13F | Norges Bank | 2.400.030 | 66.673 | ||||||
| 2026-01-28 | 13F | Universal- Beteiligungs- und Servicegesellschaft mbH | 24.407 | 2,80 | 678 | 1,04 | ||||
| 2026-02-13 | 13F | Kilter Group LLC | 46 | 1 | ||||||
| 2026-04-21 | 13F | Gutierrez Wealth Advisory, LLC | 34.755 | 0,35 | 936 | -2,81 | ||||
| 2026-02-10 | 13F | Rothschild Investment Llc | 3.596 | 58,27 | 100 | 54,69 | ||||
| 2026-02-13 | 13F | Islay Capital Management, Llc | 9.548 | 265 | ||||||
| 2026-02-13 | 13F | Nfj Investment Group, Llc | 874.250 | -2,86 | 24.287 | -4,65 | ||||
| 2026-02-17 | 13F | Captrust Financial Advisors | 30.030 | 4,48 | 834 | 2,58 | ||||
| 2026-04-07 | 13F | Central Pacific Bank - Trust Division | 6.880 | 41,27 | 185 | 37,04 | ||||
| 2026-02-11 | 13F | Jpmorgan Chase & Co | 841.720 | -2,48 | 23.383 | -4,28 | ||||
| 2026-02-13 | 13F | Public Sector Pension Investment Board | 128.430 | 3.568 | ||||||
| 2026-02-13 | 13F | Formula Growth Ltd | 51.912 | 0,00 | 1.442 | -1,84 | ||||
| 2026-01-27 | 13F | Zurcher Kantonalbank (Zurich Cantonalbank) | 68.317 | 37,98 | 1.898 | 35,40 | ||||
| 2026-01-28 | 13F | Geneos Wealth Management Inc. | 2.000 | 0,00 | 56 | -1,79 | ||||
| 2026-04-22 | 13F | Sterling Capital Management LLC | 6.264 | -42,67 | 169 | -44,55 | ||||
| 2026-05-01 | 13F | Avion Wealth | 38 | 0 | ||||||
| 2026-02-13 | 13F | Boston Partners | 1.017.895 | 29,16 | 28.321 | 27,03 | ||||
| 2026-02-12 | 13F | Xponance, Inc. | 22.708 | -13,97 | 631 | -15,55 | ||||
| 2026-04-13 | 13F | Massmutual Trust Co Fsb/adv | 26 | -40,91 | 1 | -100,00 | ||||
| 2026-02-12 | 13F | Cloud Capital Management, LLC | 0 | -100,00 | 0 | |||||
| 2026-02-13 | 13F | Pinnacle Wealth Planning Services, Inc. | 3.797 | 105 | ||||||
| 2026-04-15 | 13F | Journey Strategic Wealth Llc | 7.663 | 6,25 | 206 | 3,00 | ||||
| 2026-02-12 | 13F | Cibc World Markets Corp | 12.470 | -46,31 | 346 | -47,66 | ||||
| 2026-02-17 | 13F | Cetera Investment Advisers | 118.967 | -7,46 | 3.305 | -9,18 | ||||
| 2026-02-09 | 13F | CBIZ Investment Advisory Services, LLC | 1.336 | -0,52 | 37 | 0,00 | ||||
| 2026-02-12 | 13F | Steward Partners Investment Advisory, Llc | 265 | -24,50 | 7 | -22,22 | ||||
| 2026-02-09 | 13F | Delta Asset Management Llc/tn | 6.759 | 0,00 | 188 | -2,09 | ||||
| 2026-04-30 | 13F | Kestra Advisory Services, LLC | 0 | -100,00 | 0 | |||||
| 2026-02-03 | 13F | We Are One Seven, LLC | 70.993 | -6,58 | 1.972 | -8,28 | ||||
| 2026-02-13 | 13F | Wells Fargo & Company/mn | 246.697 | 38,34 | 6.853 | 35,81 | ||||
| 2026-02-12 | 13F | Wealthspire Advisors, LLC | 0 | -100,00 | 0 | |||||
| 2026-04-23 | 13F | MQS Management LLC | 29.587 | 215,26 | 797 | 206,15 | ||||
| 2026-04-24 | 13F | UMA Financial Services, Inc. | 17 | -56,41 | 0 | -100,00 | ||||
| 2025-11-10 | 13F | Dakota Wealth Management | 0 | -100,00 | 0 | |||||
| 2026-04-29 | 13F | Hughes Financial Services, LLC | 3 | -85,00 | 0 | |||||
| 2026-02-13 | 13F | Fieldview Capital Management, LLC | 105.601 | -14,53 | 2.934 | -16,10 | ||||
| 2026-02-06 | 13F | Covestor Ltd | 1.327 | 110,63 | 0 | |||||
| 2026-02-10 | 13F | Bruce G. Allen Investments, LLC | 23 | 35,29 | 1 | |||||
| 2026-04-16 | 13F | SG Americas Securities, LLC | 62.950 | -9,94 | 2 | 0,00 | ||||
| 2026-02-12 | 13F | Advisors Asset Management, Inc. | 0 | -100,00 | 0 | |||||
| 2026-02-09 | 13F | King Luther Capital Management Corp | 312.008 | 0,03 | 8.668 | -1,81 | ||||
| 2026-02-09 | 13F | Quest Partners LLC | 95.542 | 10,37 | 2.654 | 8,37 | ||||
| 2026-05-01 | 13F | Securian Asset Management, Inc | 13.484 | 1,23 | 363 | -1,89 | ||||
| 2026-02-13 | 13F | State Street Corp | 8.647.166 | -0,00 | 240.218 | -1,84 | ||||
| 2026-02-10 | 13F | Bnp Paribas Arbitrage, Sa | 92.584 | 5,53 | 2.572 | 3,59 | ||||
| 2026-02-20 | 13F | Sunbelt Securities, Inc. | 38.604 | 0,00 | 1.072 | -1,83 | ||||
| 2026-02-13 | 13F | S&t Bank/pa | 63 | -13,70 | 2 | -50,00 | ||||
| 2026-02-17 | 13F | Credit Agricole S A | 59.900 | 1.664 | ||||||
| 2026-02-17 | 13F | Optiver Holding B.V. | 1.019 | -37,56 | 28 | -39,13 | ||||
| 2026-02-11 | 13F | Los Angeles Capital Management Llc | 22.733 | -63,29 | 607 | -65,35 | ||||
| 2026-02-13 | 13F | Charles Schwab Investment Management Inc | 2.156.786 | -0,62 | 59.916 | -2,45 | ||||
| 2026-02-06 | 13F | Larson Financial Group LLC | 3 | 0,00 | 0 | |||||
| 2026-04-08 | 13F | Grove Bank & Trust | 311 | 0,00 | 8 | 0,00 | ||||
| 2026-02-10 | 13F | New Mexico Educational Retirement Board | 38.700 | 0,00 | 1 | 0,00 | ||||
| 2026-02-02 | 13F | Fenimore Asset Management Inc | 510.618 | -0,62 | 14.185 | -2,46 | ||||
| 2026-02-17 | 13F | Advisor Group Holdings, Inc. | 21.211 | -1,57 | 589 | -6,06 | ||||
| 2026-02-05 | 13F | Elyxium Wealth, LLC | 205 | 6 | ||||||
| 2026-02-13 | 13F | Caxton Associates Llp | 13.822 | 32,88 | 384 | 30,27 | ||||
| 2026-04-17 | 13F | AdvisorNet Financial, Inc | 0 | -100,00 | 0 | |||||
| 2026-01-30 | 13F | State of New Jersey Common Pension Fund D | 80.963 | 8,86 | 2.249 | 6,89 | ||||
| 2026-02-17 | 13F | Odyssean, LLC | 26.364 | 732 | ||||||
| 2026-02-13 | 13F | Verition Fund Management LLC | 249.836 | -24,09 | 6.940 | -25,49 | ||||
| 2026-04-22 | 13F | Pictet Asset Management Holding SA | 31.569 | 6,02 | 850 | 2,78 | ||||
| 2026-04-24 | 13F | Profund Advisors Llc | 10.367 | -10,61 | 279 | -13,35 | ||||
| 2026-01-29 | 13F | Dunhill Financial, LLC | 4 | 0 | ||||||
| 2026-02-13 | 13F | Squarepoint Ops LLC | 227.894 | 6.331 | ||||||
| 2025-11-14 | 13F | Point72 Hong Kong Ltd | 9.441 | 195,03 | 267 | 193,41 | ||||
| 2026-02-17 | 13F | Holocene Advisors, LP | 116.566 | -18,70 | 3.238 | -20,19 | ||||
| 2026-02-10 | 13F | Envestnet Asset Management Inc | 366.820 | -7,72 | 10.190 | -9,41 | ||||
| 2026-02-05 | 13F | Disciplined Investments, LLC | 17.147 | 0,00 | 476 | -1,86 | ||||
| 2026-04-30 | 13F | Nisa Investment Advisors, Llc | 9.448 | 0,00 | 254 | -3,05 | ||||
| 2026-02-12 | 13F | DRW Securities, LLC | 19.495 | 2,76 | 542 | 1,50 | ||||
| 2026-02-05 | 13F | Millennium Capital Advisors, LLC | 52.194 | -1,51 | 1.450 | -3,34 | ||||
| 2026-02-11 | 13F | Parallel Advisors, LLC | 740 | 1.198,25 | 21 | 1.900,00 | ||||
| 2026-04-24 | 13F | Retirement Systems of Alabama | 224.275 | 2,24 | 6.040 | -0,90 | ||||
| 2026-01-30 | 13F | Us Bancorp \de\ | 4.044 | -1,12 | 112 | -2,61 | ||||
| 2026-02-11 | 13F | Inceptionr Llc | 41.199 | 1.145 | ||||||
| 2026-04-28 | 13F | Abel Hall, LLC | 0 | -100,00 | 0 | |||||
| 2026-02-06 | 13F | Vestmark Advisory Solutions, Inc. | 43.265 | 1.202 | ||||||
| 2026-04-20 | 13F | Godsey & Gibb Associates | 620 | 0,00 | 17 | -5,88 | ||||
| 2026-02-17 | 13F | Tudor Investment Corp Et Al | 162.272 | 56,12 | 4.508 | 53,25 | ||||
| 2026-01-29 | 13F | Vanguard Group Inc | 20.423.768 | 3,14 | 567.372 | 1,24 | ||||
| 2026-02-09 | 13F | Keating Financial Advisory Services, Inc. | 95 | 3 | ||||||
| 2026-02-12 | 13F | Principal Securities, Inc. | 0 | -100,00 | 0 | -100,00 | ||||
| 2026-02-12 | 13F | Renaissance Technologies Llc | 60.339 | 1.676 | ||||||
| 2026-02-17 | 13F | Creative Planning | 123.727 | 23,70 | 3.437 | 21,45 | ||||
| 2026-01-23 | 13F | Assetmark, Inc | 344 | -16,71 | 10 | -18,18 | ||||
| 2026-02-14 | 13F | Rockefeller Capital Management L.P. | 8.606 | -0,51 | 239 | -2,05 | ||||
| 2026-04-28 | 13F | Golden State Equity Partners | 101 | 3 | ||||||
| 2026-02-17 | 13F | Point72 Asset Management, L.P. | 420.462 | 691,25 | 11.680 | 677,11 | ||||
| 2026-02-11 | 13F | Simplex Trading, Llc | 750 | -72,25 | 21 | |||||
| 2026-02-17 | 13F | Northern Trust Corp | 2.352.260 | -7,48 | 65.346 | -9,18 | ||||
| 2026-02-11 | 13F | Simplex Trading, Llc | Call | 100 | -50,00 | 3 | ||||
| 2026-02-12 | 13F | Quadrant Capital Group Llc | 9.675 | -6,61 | 269 | -8,53 | ||||
| 2026-02-17 | 13F | Dark Forest Capital Management Lp | 29.510 | -80,35 | 820 | -80,73 | ||||
| 2026-01-21 | 13F | Newbridge Financial Services Group, Inc. | 2.198 | 0,73 | 61 | 0,00 | ||||
| 2026-04-30 | 13F | LRI Investments, LLC | 63 | 0,00 | 2 | 0,00 | ||||
| 2026-02-17 | 13F | Schonfeld Strategic Advisors LLC | 0 | -100,00 | 0 | |||||
| 2026-04-17 | 13F | Bell Investment Advisors, Inc | 19 | 1 | ||||||
| 2025-11-14 | 13F | Point72 (DIFC) Ltd | 24.761 | 55,68 | 701 | 54,87 | ||||
| 2026-02-17 | 13F | VARCOV Co. | 33.974 | 944 | ||||||
| 2026-02-13 | 13F | Epoch Investment Partners, Inc. | 81.690 | -8,96 | 2.269 | -10,63 | ||||
| 2026-01-29 | 13F | Compass Ion Advisors, LLC | 0 | -100,00 | 0 | |||||
| 2026-04-29 | 13F | Skopos Labs, Inc. | 20.272 | 546 | ||||||
| 2026-01-12 | 13F | Rialto Wealth Management, LLC | 24 | 33,33 | 1 | |||||
| 2026-02-10 | 13F | Savant Capital, LLC | 0 | -100,00 | 0 | |||||
| 2026-04-23 | 13F | CBOE Vest Financial, LLC | 243.910 | 19,39 | 6.568 | 15,74 | ||||
| 2026-01-26 | 13F | Merit Financial Group, LLC | 0 | -100,00 | 0 | |||||
| 2026-02-17 | 13F | Aquatic Capital Management LLC | 0 | -100,00 | 0 | |||||
| 2026-04-20 | 13F | Louisiana State Employees Retirement System | 53.000 | 4,74 | 1.427 | 1,57 | ||||
| 2026-04-24 | 13F | Root Financial Partners, LLC | 1.090 | 76,95 | 29 | 70,59 | ||||
| 2026-04-22 | 13F | Ifrah Financial Services, Inc. | 8.051 | -1,25 | 217 | -4,42 | ||||
| 2026-02-17 | 13F | Aqr Capital Management Llc | 1.464.905 | 30,71 | 40.695 | 28,31 | ||||
| 2026-02-17 | 13F | Susquehanna Fundamental Investments, Llc | 15.044 | 418 | ||||||
| 2026-04-06 | 13F | CX Institutional | 33 | -77,55 | 0 | |||||
| 2026-02-09 | 13F | Lathrop Investment Management Corp | 19.941 | 3,42 | 1 | |||||
| 2026-01-22 | 13F | Bartlett & Co. Wealth Management Llc | 1.616 | 0,00 | 45 | -2,22 | ||||
| 2026-02-10 | 13F | Natixis Advisors, L.p. | 95.527 | -25,43 | 3 | -33,33 | ||||
| 2026-05-01 | 13F | Arizona State Retirement System | 50.964 | -2,37 | 1.372 | -5,38 | ||||
| 2026-04-29 | 13F | R Squared Ltd | 0 | -100,00 | 0 | |||||
| 2026-02-12 | 13F | Alps Advisors Inc | 15.432 | 1,11 | 429 | -0,70 | ||||
| 2026-04-27 | 13F | Y-Intercept (Hong Kong) Ltd | 58.070 | -32,04 | 1.564 | -34,13 | ||||
| 2026-02-17 | 13F | Ameriprise Financial Inc | 168.479 | -6,64 | 4.680 | -8,34 | ||||
| 2026-02-02 | 13F | Cornerstone Planning Group LLC | 774 | 0,00 | 22 | 5,00 | ||||
| 2026-02-17 | 13F | MIRAE ASSET GLOBAL ETFS HOLDINGS Ltd. | 87.511 | -0,07 | 2.431 | -1,90 | ||||
| 2026-01-16 | 13F | Trust Co Of Vermont | 1.425 | 0,00 | 40 | -2,50 | ||||
| 2025-11-14 | 13F | Cubist Systematic Strategies, LLC | 630.225 | 38,71 | 17.835 | 37,94 | ||||
| 2026-04-07 | 13F | Signaturefd, Llc | 744 | 15,17 | 20 | 17,65 | ||||
| 2026-01-29 | 13F | Quest 10 Wealth Builders, Inc. | 0 | -100,00 | 0 | |||||
| 2026-04-28 | 13F | Handelsbanken Fonder AB | 48.555 | 0,00 | 1 | 0,00 | ||||
| 2026-02-10 | 13F | Nomura Asset Management Co Ltd | 1.630 | 0,00 | 45 | -2,17 | ||||
| 2026-02-10 | 13F | Td Asset Management Inc | 71.712 | 0,00 | 1.992 | -1,82 | ||||
| 2026-04-29 | 13F | WPG Advisers, LLC | 640 | -3,03 | 17 | -5,56 | ||||
| 2026-02-13 | 13F | Rhumbline Advisers | 567.388 | -7,35 | 15.762 | -9,05 | ||||
| 2025-11-07 | 13F | Atticus Wealth Management, Llc | 0 | -100,00 | 0 | |||||
| 2026-02-12 | 13F | Elo Mutual Pension Insurance Co | 47.436 | 5,23 | 1.318 | 3,29 | ||||
| 2026-01-30 | 13F | NJ State Employees Deferred Compensation Plan | 0 | -100,00 | 0 | -100,00 | ||||
| 2026-04-27 | 13F | Mount Yale Investment Advisors, LLC | 11.967 | 322 | ||||||
| 2026-02-12 | 13F | California Public Employees Retirement System | 348.994 | 1,34 | 9.695 | -0,51 | ||||
| 2026-02-12 | 13F | Bahl & Gaynor Inc | 0 | -100,00 | 0 | |||||
| 2026-02-17 | 13F | Janus Henderson Group Plc | 81.548 | 0,00 | 2.264 | -1,95 | ||||
| 2026-02-09 | 13F | Huntington National Bank | 1 | -93,75 | 0 | |||||
| 2026-02-13 | 13F | Morgan Stanley | 1.269.330 | 47,47 | 35.262 | 44,76 | ||||
| 2026-05-01 | 13F | Fifth Third Bancorp | 83.898 | 3.233,25 | 2.259 | 3.173,91 | ||||
| 2026-02-11 | 13F | O'shaughnessy Asset Management, Llc | 8.984 | -10,62 | 250 | -12,32 | ||||
| 2026-02-11 | 13F | Deutsche Bank Ag\ | 150.357 | 4,73 | 4.177 | 2,81 | ||||
| 2026-02-17 | 13F | Sciencast Management LP | 23.996 | 4,21 | 667 | 2,30 | ||||
| 2026-01-28 | 13F | Ruffer LLP | 108.357 | 3.015 | ||||||
| 2026-02-17 | 13F | Citadel Advisors Llc | 663.599 | 297,53 | 18.435 | 290,22 | ||||
| 2026-02-19 | 13F | TMB Capital Partners, LLC | 66.575 | 1.849 | ||||||
| 2026-02-17 | 13F | Citadel Advisors Llc | Call | 25.000 | 694 | |||||
| 2026-02-17 | 13F | T. Rowe Price Investment Management, Inc. | 2.605.759 | -67,19 | 72 | -67,86 | ||||
| 2026-02-06 | 13F | HighTower Advisors, LLC | 13.901 | -3,16 | 386 | -4,93 | ||||
| 2026-02-09 | 13F | Kingsview Wealth Management, LLC | 0 | -100,00 | 0 | |||||
| 2026-02-13 | 13F | Pathstone Holdings, LLC | 17.125 | -10,92 | 476 | -12,68 | ||||
| 2026-04-13 | 13F | IFP Advisors, Inc | 263 | 0,00 | 7 | 0,00 | ||||
| 2026-02-13 | 13F | Centerpoint Advisors, LLC | 748 | 0,00 | 0 | |||||
| 2026-04-13 | 13F | Wedge Capital Management L L P/nc | 58.954 | -5,09 | 1.588 | -8,00 | ||||
| 2026-04-30 | 13F | Teacher Retirement System Of Texas | 40.835 | -25,38 | 1.100 | -27,70 | ||||
| 2026-02-17 | 13F | Price T Rowe Associates Inc /md/ | 185.687 | 3,01 | 5 | 0,00 | ||||
| 2025-11-12 | 13F | Aster Capital Management (DIFC) Ltd | 0 | -100,00 | 0 | |||||
| 2026-02-12 | 13F | Voya Investment Management Llc | 33.184 | -1,93 | 922 | -3,76 | ||||
| 2026-02-17 | 13F | Balyasny Asset Management Llc | 22.109 | 8,93 | 614 | 6,97 | ||||
| 2026-02-17 | 13F | Weiss Asset Management LP | 44.756 | 204,46 | 1.243 | 198,80 | ||||
| 2026-02-17 | 13F | Royal Bank Of Canada | 121.736 | 3,09 | 3.382 | 1,20 | ||||
| 2026-02-06 | 13F | CFO4Life Group, LLC | 9.511 | 0,00 | 264 | -1,86 | ||||
| 2026-04-30 | 13F | Indivisible Partners | 11.846 | 319 | ||||||
| 2026-04-22 | 13F | Caldwell Trust Co | 5.132 | 0,00 | 138 | -2,82 | ||||
| 2026-04-29 | 13F | Police & Firemen's Retirement System of New Jersey | 48.964 | -6,88 | 1.319 | -9,73 | ||||
| 2026-04-27 | 13F | Td Private Client Wealth Llc | 162 | 10,20 | 4 | 0,00 | ||||
| 2026-04-30 | 13F | First Horizon Corp | 1.217 | 0,00 | 33 | -3,03 | ||||
| 2026-05-01 | 13F | Hohimer Wealth Management, Llc | 8.093 | 218 | ||||||
| 2026-02-10 | 13F | Intech Investment Management Llc | 81.212 | 0,00 | 2.256 | -1,83 | ||||
| 2026-02-09 | 13F | Legal & General Group Plc | 286.389 | -14,26 | 7.971 | -15,82 | ||||
| 2026-02-13 | 13F | Ubs Asset Management Americas Inc | 335.199 | -1,17 | 9.312 | -2,99 | ||||
| 2026-04-20 | 13F | Ronald Blue Trust, Inc. | 491 | 0,00 | 13 | 0,00 | ||||
| 2026-01-26 | 13F | AE Wealth Management LLC | 9.183 | 255 | ||||||
| 2026-02-17 | 13F | Centennial Bank/AR/ | 129.511 | 0,00 | 3.598 | -1,86 | ||||
| 2026-04-30 | 13F | Personal Cfo Solutions, Llc | 10.896 | -2,98 | 293 | -5,79 | ||||
| 2026-02-17 | 13F | Two Sigma Investments, Lp | 0 | -100,00 | 0 | |||||
| 2025-11-06 | 13F | Naviter Wealth, LLC | 0 | -100,00 | 0 | |||||
| 2026-02-17 | 13F | Wellington Management Group Llp | 1.881.320 | -20,19 | 52.263 | -21,66 | ||||
| 2026-02-17 | 13F | State Of Wisconsin Investment Board | 423.270 | 3,45 | 11.758 | 1,55 | ||||
| 2026-05-01 | 13F | Thrivent Financial For Lutherans | 48.023 | -1,97 | 1 | 0,00 | ||||
| 2026-02-13 | 13F | Stifel Financial Corp | 105.988 | -8,12 | 2.944 | -9,80 | ||||
| 2025-11-12 | 13F | 111 Capital | 0 | -100,00 | 0 | -100,00 | ||||
| 2025-11-14 | 13F | Teza Capital Management LLC | 0 | -100,00 | 0 | |||||
| 2026-02-17 | 13F | Wallace Hart LLC | 24.705 | 0,00 | 686 | -1,86 | ||||
| 2026-02-17 | 13F | Public Employees Retirement System Of Ohio | 2.168 | -66,54 | 60 | -67,21 | ||||
| 2026-04-30 | 13F | Money Concepts Capital Corp | 24.632 | 663 | ||||||
| 2026-02-06 | 13F | EverSource Wealth Advisors, LLC | 1.126 | 17,91 | 31 | 14,81 | ||||
| 2026-02-12 | 13F | Jane Street Group, Llc | 150.128 | -48,44 | 4.171 | -49,39 | ||||
| 2026-02-17 | 13F | Advisory Services Network, LLC | 0 | -100,00 | 0 | |||||
| 2026-01-15 | 13F | Allspring Global Investments Holdings, LLC | 0 | -100,00 | 0 | |||||
| 2026-02-04 | 13F | Pacer Advisors, Inc. | 0 | -100,00 | 0 | |||||
| 2026-02-13 | 13F | Inspire Advisors, LLC | 24.025 | -2,81 | 667 | -4,58 | ||||
| 2026-02-17 | 13F | Voloridge Investment Management, Llc | 584.970 | 121,13 | 16.250 | 117,07 | ||||
| 2025-11-14 | 13F | Sofos Investments, Inc. | 0 | -100,00 | 0 | |||||
| 2026-02-13 | 13F | Manufacturers Life Insurance Company, The | 0 | -100,00 | 0 | |||||
| 2026-04-21 | 13F | Olstein Capital Management, L.P. | 35.500 | -4,05 | 1 | -100,00 | ||||
| 2026-02-09 | 13F | Royce & Associates Lp | 1.008.765 | -9,41 | 28.023 | -11,07 | ||||
| 2026-02-12 | 13F | Bank Of Montreal /can/ | 15.540 | -0,47 | 432 | -2,27 | ||||
| 2026-01-29 | 13F | Comerica Bank | 84.788 | -1,97 | 2.355 | -3,76 | ||||
| 2025-11-14 | 13F | Wolverine Trading, Llc | Call | 79.100 | 1,93 | 2.246 | 1,31 | |||
| 2026-02-09 | 13F | Harbour Investments, Inc. | 45 | 0,00 | 1 | 0,00 | ||||
| 2026-02-13 | 13F | Baird Financial Group, Inc. | 21.500 | 0,00 | 597 | -1,81 | ||||
| 2026-02-17 | 13F | Bank Of America Corp /de/ | 774.118 | -8,49 | 21.505 | -10,17 | ||||
| 2026-02-12 | 13F | Brown Brothers Harriman & Co | 233 | -38,20 | 6 | -40,00 | ||||
| 2026-01-30 | 13F | Turning Point Benefit Group, Inc. | 32 | 220,00 | 1 | |||||
| 2026-02-13 | 13F | Prudential Financial Inc | 14.553 | -72,06 | 404 | -72,59 | ||||
| 2026-04-24 | 13F | Key FInancial Inc | 342 | 0,00 | 9 | 0,00 | ||||
| 2026-02-05 | 13F | Atria Investments Llc | 13.061 | 21,87 | 363 | 19,47 | ||||
| 2026-04-27 | 13F | New York State Teachers Retirement System | 157.561 | -3,69 | 4 | 0,00 | ||||
| 2026-02-10 | 13F | Quantbot Technologies LP | 30.495 | 113,80 | 847 | 110,17 | ||||
| 2026-02-13 | 13F | Sei Investments Co | 385.723 | 4,25 | 10.715 | 2,33 | ||||
| 2026-04-29 | 13F | Klp Kapitalforvaltning As | 41.000 | 2,50 | 1.104 | -0,63 | ||||
| 2026-04-08 | 13F | Wealth Enhancement Advisory Services, Llc | 13.129 | -30,56 | 357 | -33,95 | ||||
| 2026-02-11 | 13F | Franklin Resources Inc | 51.240 | -2,66 | 1.423 | -4,43 | ||||
| 2026-04-20 | 13F | Naples Global Advisors, Llc | 40.605 | -1,29 | 1.093 | -4,29 | ||||
| 2026-02-13 | 13F | Victory Capital Management Inc | 58.424 | 17,45 | 1.623 | 15,35 | ||||
| 2026-02-17 | 13F | Russell Investments Group, Ltd. | 364.489 | -19,09 | 10.126 | -20,58 | ||||
| 2026-02-04 | 13F | Greenwood Gearhart Inc | 213.034 | -0,23 | 5.918 | -2,07 | ||||
| 2026-04-15 | 13F | Fortitude Family Office, LLC | 137 | 140,35 | 4 | 200,00 | ||||
| 2026-04-09 | 13F | Kwmg, Llc | 259.926 | 2,99 | 7.000 | -0,17 | ||||
| 2026-02-17 | 13F | California State Teachers Retirement System | 178.918 | -0,12 | 4.970 | -1,95 | ||||
| 2026-02-17 | 13F | Kemnay Advisory Services Inc. | 600 | 17 | ||||||
| 2026-04-07 | 13F | Retirement Wealth Solutions LLC | 270 | -37,35 | 7 | -36,36 | ||||
| 2026-02-05 | 13F | Bessemer Group Inc | 19.756 | 0,41 | 1 | |||||
| 2026-04-17 | 13F | Amarillo National Bank | 84.030 | 0,00 | 2.263 | -3,08 | ||||
| 2026-02-12 | 13F | Swiss National Bank | 369.107 | 1,48 | 10.254 | -0,38 | ||||
| 2026-02-06 | 13F | Pnc Financial Services Group, Inc. | 10.152 | -1,69 | 282 | -3,42 | ||||
| 2026-02-10 | 13F | Mutual Of America Capital Management Llc | 76.070 | -10,13 | 2.113 | -11,77 | ||||
| 2026-02-17 | 13F | Wiley Bros.-aintree Capital, Llc | 8.545 | 0,21 | 237 | -1,66 | ||||
| 2025-11-13 | 13F | Marshall Wace, Llp | 0 | -100,00 | 0 | |||||
| 2026-02-17 | 13F | Algert Global Llc | 280.675 | 140,13 | 8 | 133,33 | ||||
| 2026-02-13 | 13F | Van Eck Associates Corp | 0 | -100,00 | 0 | |||||
| 2026-02-17 | 13F | Zurich Insurance Group Ltd/FI | 0 | -100,00 | 0 | |||||
| 2026-04-23 | 13F | Forum Financial Management, LP | 0 | -100,00 | 0 | |||||
| 2026-02-11 | 13F | Vestcor Inc | 0 | -100,00 | 0 | |||||
| 2026-04-27 | 13F | Hgk Asset Management Inc | 53.977 | 0,30 | 1.454 | -2,81 | ||||
| 2026-02-12 | 13F | Campbell & CO Investment Adviser LLC | 241.194 | 118,05 | 6.700 | 114,06 | ||||
| 2026-02-12 | 13F | MetLife Investment Management, LLC | 190.832 | -5,35 | 5.301 | -7,08 | ||||
| 2026-02-17 | 13F | ISAM Funds (UK) Ltd | 0 | -100,00 | 0 |