Grundlæggende statistik
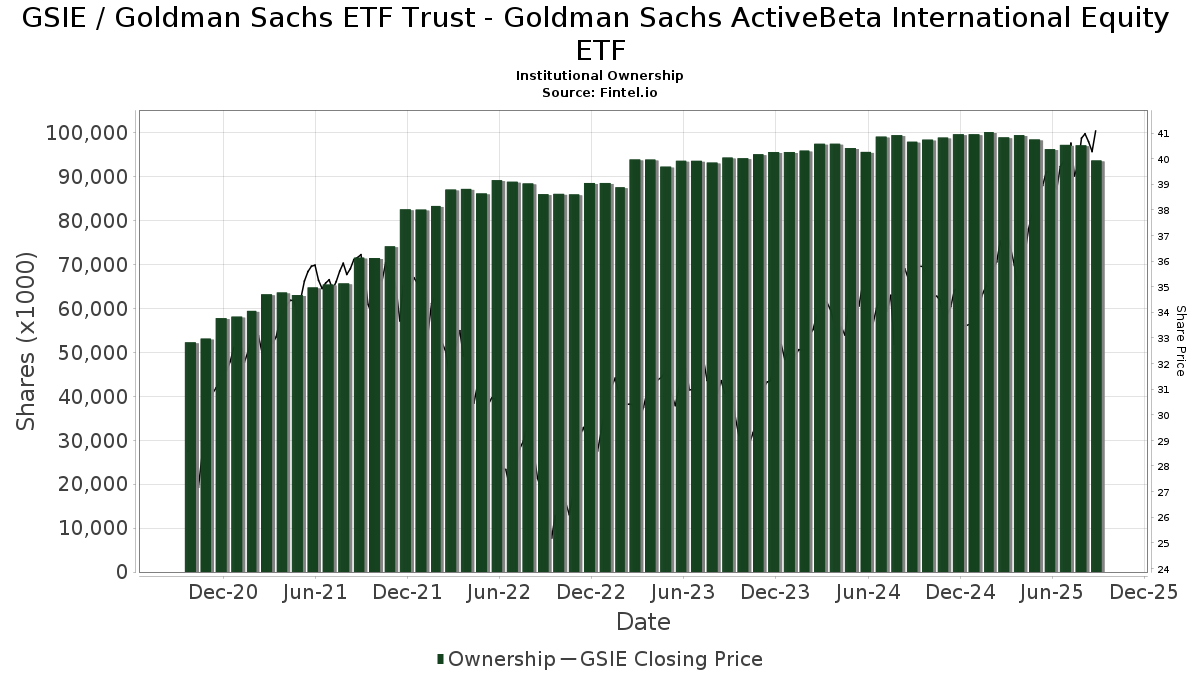
| Institutionelle ejere | 330 total, 330 long only, 0 short only, 0 long/short - change of 6,45% MRQ |
| Gennemsnitlig porteføljeallokering | 0.6895 % - change of 2,13% MRQ |
| Institutionelle aktier (lange) | 102.385.852 (ex 13D/G) - change of 0,93MM shares 0,92% MRQ |
| Institutionel værdi (lang) | $ 4.125.164 USD ($1000) |
Institutionelt ejerskab og aktionærer
Goldman Sachs ETF Trust - Goldman Sachs ActiveBeta International Equity ETF (US:GSIE) har 330 institutionelle ejere og aktionærer, der har indsendt 13D/G- eller 13F-formularer til Securities Exchange Commission (SEC). Disse institutioner har i alt 102,385,852 aktier. Største aktionærer omfatter Wells Fargo & Company/mn, LPL Financial LLC, Vantagepoint Investment Advisers Llc, Bank Of America Corp /de/, SigFig Wealth Management, LLC, Morgan Stanley, Betterment LLC, Envestnet Asset Management Inc, HB Wealth Management, LLC, and Commonwealth Equity Services, Llc .
Goldman Sachs ETF Trust - Goldman Sachs ActiveBeta International Equity ETF (ARCA:GSIE) institutionel ejerskabsstruktur viser aktuelle positioner i virksomheden efter institutioner og fonde, samt seneste ændringer i positionsstørrelse. Større aktionærer kan omfatte individuelle investorer, investeringsforeninger, hedgefonde eller institutioner. Skema 13D angiver, at investoren besidder (eller besidder) mere end 5 % af virksomheden og har til hensigt (eller har til hensigt at) aktivt at forfølge en ændring i forretningsstrategi. Skema 13G indikerer en passiv investering på over 5%.
The share price as of March 4, 2026 is 45,04 / share. Previously, on March 5, 2025, the share price was 36,77 / share. This represents an increase of 22,49% over that period.
Fondens stemningsscore
Fund Sentiment Score (fka Ownership Accumulation Score) finder de aktier, der bliver mest købt af fonde. Det er resultatet af en sofistikeret, multi-faktor kvantitativ model, der identificerer virksomheder med de højeste niveauer af institutionel akkumulering. Scoringsmodellen bruger en kombination af den samlede stigning i oplyste ejere, ændringerne i porteføljeallokeringer i disse ejere og andre målinger. Tallet går fra 0 til 100, hvor højere tal indikerer et højere niveau af akkumulering for sine jævnaldrende, og 50 er gennemsnittet.
Opdateringsfrekvens: Dagligt
Se Ownership Explorer, som giver en liste over højest rangerende virksomheder.
AI+ Ask Fintel’s AI assistant about Goldman Sachs ETF Trust - Goldman Sachs ActiveBeta International Equity ETF.
Select a question to share a public post with an AI-crafted answer.
Thinking of good questions…
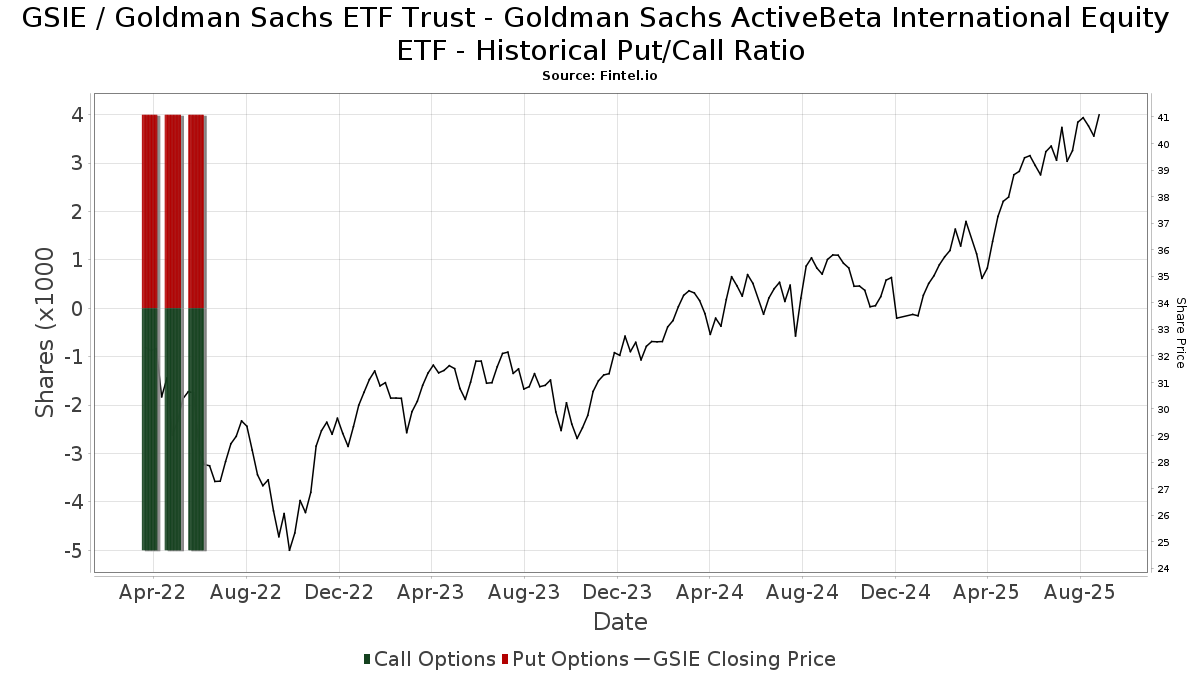
Institutionel Put/Call-forhold
Ud over at indberette standardaktie- og gældsudstedelser skal institutter med mere end 100 mill. aktiver under forvaltning også oplyse deres put- og call-optionsbeholdninger. Da salgsoptioner generelt indikerer negativ stemning, og købsoptioner indikerer positiv stemning, kan vi få en fornemmelse af den overordnede institutionelle stemning ved at plotte forholdet mellem put og kald. Diagrammet til højre viser det historiske put/call-forhold for dette instrument.
Brug af Put/Call Ratio som en indikator for investorernes stemning overvinder en af de vigtigste mangler ved at bruge totalt institutionelt ejerskab, som er, at en betydelig mængde af aktiver under forvaltning investeres passivt for at spore indekser. Passivt forvaltede fonde køber typisk ikke optioner, så indikatoren for put/call-forholdet følger mere nøje følelsen af aktivt forvaltede fonde.
13D/G-arkivering
Vi præsenterer 13D/G ansøgninger separat fra 13F ansøgninger på grund af den forskellige behandling af SEC. 13D/G-ansøgninger kan indgives af grupper af investorer (med én ledende), hvorimod 13F-ansøgninger ikke kan. Dette resulterer i situationer, hvor en investor kan indsende en 13D/G, der rapporterer én værdi for de samlede aktier (der repræsenterer alle de aktier, der ejes af investorgruppen), men derefter indsender en 13F, der rapporterer en anden værdi for de samlede aktier (der udelukkende repræsenterer deres egne) ejendomsret). Det betyder, at aktieejerskab af 13D/G-arkiver og 13F-arkiveringer ofte ikke er direkte sammenlignelige, så vi præsenterer dem separat.
Bemærk: Fra den 16. maj 2021 viser vi ikke længere ejere, der ikke har indsendt en 13D/G inden for det seneste år. Tidligere viste vi den fulde historie af 13D/G-arkiver. Generelt skal enheder, der er forpligtet til at indgive 13D/G-ansøgninger, indgive mindst årligt, før de indsender en afsluttende ansøgning. Dog forlader fonde nogle gange positioner uden at indsende en afsluttende ansøgning (dvs. de afvikler), så visning af den fulde historie resulterede nogle gange i forvirring om det nuværende ejerskab. For at undgå forvirring viser vi nu kun 'aktuelle' ejere - det vil sige - ejere, der har anmeldt inden for det seneste år.
Upgrade to unlock premium data.
| Fil dato | Form | Investor | Forrige Aktier |
Seneste Aktier |
Δ Aktier (Procent) |
Ejendomsret (Procent) |
Δ Ejerskab (Procent) |
|
|---|---|---|---|---|---|---|---|---|
| 2026-01-13 | International City Management Association Retirement Corp | 5,598,074 | 5,429,627 | -3.01 | 4.80 | -4.00 |
13F og NPORT arkivering
Detaljer om 13F-arkivering er gratis. Detaljer om NP-ansøgninger kræver et premium-medlemskab. Grønne rækker angiver nye positioner. Røde rækker angiver lukkede positioner. Klik på linket ikon for at se den fulde transaktionshistorik.
Opgrader
for at låse premium-data op og eksportere til Excel ![]() .
.
| Fil dato | Kilde | Investor | Type | Gennemsnitlig pris (Øst) |
Aktier | Δ Aktier (%) |
Rapporteret Værdi ($1000) |
Δ Værdi (%) |
Port Alloc (%) |
|
|---|---|---|---|---|---|---|---|---|---|---|
| 2026-02-18 | 13F | SkyView Investment Advisors, LLC | 1.008.073 | -0,77 | 43 | 4,88 | ||||
| 2026-02-12 | 13F | Bank Of Montreal /can/ | 4.351 | -12,54 | 187 | -8,82 | ||||
| 2026-01-29 | 13F | Comerica Bank | 65.869 | 5,50 | 2.828 | 10,21 | ||||
| 2026-02-05 | 13F | Stephens Inc /ar/ | 60.866 | -2,50 | 2.614 | 1,83 | ||||
| 2026-01-27 | 13F | Financial Management Professionals, Inc. | 1.331.851 | 0,65 | 57.190 | 5,13 | ||||
| 2026-02-09 | 13F | Annis Gardner Whiting Capital Advisors, LLC | 29.744 | 0,00 | 1.277 | 4,50 | ||||
| 2026-01-29 | 13F | High Probability Advisors, LLC | 970.100 | 1,40 | 41.656 | 5,92 | ||||
| 2026-02-17 | 13F | Regal Investment Advisors LLC | 93.421 | -5,37 | 4.012 | -1,16 | ||||
| 2026-01-13 | 13F | CoreCap Advisors, LLC | 475.103 | 0,34 | 20.401 | 4,80 | ||||
| 2026-02-17 | 13F | Glenmede Trust Co Na | 1.813 | 78 | ||||||
| 2026-02-11 | 13F | Gateway Wealth Partners, LLC | 6.505 | 279 | ||||||
| 2026-02-13 | 13F | Mml Investors Services, Llc | 27.902 | 19,93 | 1.198 | 25,31 | ||||
| 2026-01-30 | 13F | Activest Wealth Management | 138 | 0,00 | 6 | 0,00 | ||||
| 2026-01-05 | 13F | Roxbury Financial LLC | 63 | 0,00 | 3 | 0,00 | ||||
| 2026-01-29 | 13F | Vanguard Group Inc | 6.734 | 1,37 | 289 | 5,86 | ||||
| 2026-01-27 | 13F | Round Rock Advisors, LLC | 8.888 | -0,56 | 382 | 3,81 | ||||
| 2026-02-12 | 13F | Brinker Capital Investments, LLC | 91.989 | -3,08 | 3.950 | 1,23 | ||||
| 2026-01-26 | 13F | Merit Financial Group, LLC | 7.394 | 9,65 | 318 | 14,44 | ||||
| 2026-01-09 | 13F | Dynamic Advisor Solutions LLC | 33.756 | -40,88 | 1.449 | -38,26 | ||||
| 2026-02-02 | 13F | Vawter Financial, Ltd. | 217.928 | 22,82 | 9.358 | 28,28 | ||||
| 2026-02-05 | 13F | SFE Investment Counsel | 9.443 | 19,47 | 405 | 25,00 | ||||
| 2026-01-29 | 13F | Nbc Securities, Inc. | 6.424 | -12,17 | 276 | -8,33 | ||||
| 2026-01-27 | 13F | Legacy Advisors, LLC | 8.869 | -4,48 | 383 | -0,26 | ||||
| 2025-11-12 | 13F | Ameriflex Group, Inc. | 0 | -100,00 | 0 | |||||
| 2026-02-12 | 13F | Planning Project LLC | 215 | 9 | ||||||
| 2025-10-28 | 13F | First National Corp /ma/ /adv | 148.888 | 3,84 | 6.159 | 8,32 | ||||
| 2026-01-23 | 13F | Optima Capital Llc | 5.823 | -0,05 | 250 | 4,60 | ||||
| 2026-02-11 | 13F | CNB Bank | 1.623 | 0,00 | 70 | 4,55 | ||||
| 2026-02-13 | 13F | Cozad Asset Management Inc | 93.612 | 4,25 | 4.020 | 8,89 | ||||
| 2026-02-17 | 13F | Wiley Bros.-aintree Capital, Llc | 67.701 | -25,33 | 2.907 | -21,94 | ||||
| 2026-01-23 | 13F | Integrated Wealthcare, Llc | 32.199 | 1.383 | ||||||
| 2026-01-26 | 13F | JNBA Financial Advisors | 514 | 0,39 | 22 | 4,76 | ||||
| 2026-01-23 | 13F | Stonehaven Wealth & Tax Solutions, Llc | 8.975 | -7,76 | 385 | -3,75 | ||||
| 2026-02-13 | 13F | Gts Securities Llc | 5.731 | -29,04 | 246 | -25,90 | ||||
| 2026-01-16 | 13F | SigFig Wealth Management, LLC | 4.478.415 | 1,75 | 192.303 | 6,64 | ||||
| 2025-10-17 | 13F | Archford Capital Strategies, LLC | 0 | -100,00 | 0 | -100,00 | ||||
| 2026-02-13 | 13F | Beacon Financial Advisory LLC | 24.677 | 106,52 | 1.060 | 115,68 | ||||
| 2026-02-09 | 13F | LifePlan Investment Advisors, Inc. | 74.755 | 2,25 | 3.210 | 6,79 | ||||
| 2026-02-03 | 13F | Cheviot Value Management, LLC | 69 | 0,00 | 3 | 50,00 | ||||
| 2026-02-26 | 13F | 46 Peaks LLC | 11.339 | 487 | ||||||
| 2025-11-06 | 13F | Abich Financial Wealth Management LLC | 0 | -100,00 | 0 | |||||
| 2026-02-03 | 13F | Patton Albertson Miller Group, Llc | 34.937 | 8,37 | 1.500 | 13,21 | ||||
| 2026-01-08 | 13F | Armstrong Advisory Group, Inc | 949 | 0,00 | 41 | 2,56 | ||||
| 2026-02-11 | 13F | Janney Montgomery Scott LLC | 266.575 | 62,05 | 11 | 83,33 | ||||
| 2026-02-17 | 13F | Equitable Holdings, Inc. | 81.344 | -5,88 | 3.493 | -1,72 | ||||
| 2026-01-26 | 13F | Private Trust Co Na | 23.290 | -37,91 | 1.000 | -35,15 | ||||
| 2026-02-13 | 13F | Ieq Capital, Llc | 11.032 | 0,51 | 474 | 4,88 | ||||
| 2026-02-17 | 13F | Russell Investments Group, Ltd. | 1.409 | 0,00 | 61 | 5,26 | ||||
| 2026-01-26 | 13F | Consolidated Portfolio Review Corp | 0 | -100,00 | 0 | |||||
| 2026-02-11 | 13F | Endeavor Private Wealth, Inc. | 11.115 | -15,14 | 477 | -11,34 | ||||
| 2026-02-17 | 13F | SageView Advisory Group, LLC | 89.328 | -3,62 | 3.836 | 0,66 | ||||
| 2026-02-12 | 13F | IFC Advisors LLC | 134.265 | 0,00 | 5.765 | 4,46 | ||||
| 2026-02-09 | 13F | Horizon Family Wealth, Inc. | 340.132 | -0,18 | 14.605 | 4,26 | ||||
| 2026-02-17 | 13F | Royal Bank Of Canada | 969.218 | -2,92 | 41.617 | 1,40 | ||||
| 2026-02-04 | 13F | Bridgewealth Advisory Group, LLC | 196.214 | 8.425 | ||||||
| 2026-02-17 | 13F | Mercer Global Advisors Inc /adv | 187.836 | 29,34 | 8.066 | 35,09 | ||||
| 2026-02-13 | 13F | Selby Wealth Management, LLC | 77.635 | 3.334 | ||||||
| 2026-02-04 | 13F | Brio Consultants, LLC | 1.022.545 | 4,32 | 43.908 | 8,96 | ||||
| 2026-02-06 | 13F | Empirical Asset Management, LLC | 6.059 | -0,21 | 260 | 4,42 | ||||
| 2026-01-29 | 13F | UBS Group AG | 972.476 | -1,75 | 41.758 | 2,62 | ||||
| 2026-02-04 | 13F | First Foundation Advisors | 1.009.773 | -1,27 | 43.360 | 3,13 | ||||
| 2025-12-02 | 13F | Gilbert Capital Group, Inc. | 0 | -100,00 | 0 | |||||
| 2026-02-13 | 13F | Morgan Stanley | 3.313.212 | 0,60 | 142.269 | 5,08 | ||||
| 2026-01-29 | 13F | Inscription Capital, LLC | 33.739 | 0,00 | 1.449 | 4,40 | ||||
| 2026-02-04 | 13F | Pensionmark Financial Group, Llc | 46.601 | 323,07 | 836 | 84,73 | ||||
| 2026-02-17 | 13F | Cape Investment Advisory, Inc. | 323 | 14 | ||||||
| 2026-01-29 | 13F | True Link Financial Advisors, LLC | 8.716 | 374 | ||||||
| 2026-02-04 | 13F | Mascoma Wealth Management LLC | 505 | 0,00 | 22 | 5,00 | ||||
| 2026-01-08 | 13F | Wealth Enhancement Advisory Services, Llc | 326.450 | 5,01 | 14.285 | 11,24 | ||||
| 2026-02-17 | 13F | Quadrature Capital Ltd | 34.935 | 1.500 | ||||||
| 2026-02-11 | 13F | Empowered Funds, LLC | 17.913 | 32,38 | 769 | 38,31 | ||||
| 2026-02-03 | 13F | We Are One Seven, LLC | 14.682 | 630 | ||||||
| 2026-01-27 | 13F | Duncker Streett & Co Inc | 436 | 0,00 | 19 | 5,88 | ||||
| 2026-02-04 | 13F | Naples Global Advisors, Llc | 10.779 | 0,00 | 463 | 4,29 | ||||
| 2025-11-14 | 13F | Capital Analysts, Inc. | 0 | -100,00 | 0 | |||||
| 2026-02-02 | 13F | Truist Financial Corp | 21.275 | 2,44 | 914 | 7,03 | ||||
| 2025-11-20 | 13F | Asset Dedication, LLC | 0 | -100,00 | 0 | |||||
| 2026-01-26 | 13F | Cwm, Llc | 334.048 | 2,49 | 14 | 7,69 | ||||
| 2026-01-09 | 13F | Appleton Partners Inc/ma | 441.848 | 0,25 | 19 | 0,00 | ||||
| 2026-02-13 | 13F | Colony Group, LLC | 8.767 | 27,59 | 376 | 33,33 | ||||
| 2026-02-17 | 13F | Raymond James Financial Inc | 948.988 | 4,19 | 40.750 | 8,82 | ||||
| 2026-01-20 | 13F | American National Bank | 703.394 | 6,58 | 30.204 | 11,32 | ||||
| 2026-02-09 | 13F | Hantz Financial Services, Inc. | 519 | 0 | ||||||
| 2026-02-10 | 13F | Syntegra Private Wealth Group, LLC | 49.862 | 0,00 | 2.141 | 4,49 | ||||
| 2026-02-17 | 13F | Captrust Financial Advisors | 1.286.568 | 0,18 | 55.245 | 4,64 | ||||
| 2026-02-06 | 13F | Gables Capital Management Inc. | 29 | 0,00 | 1 | 0,00 | ||||
| 2026-02-17 | 13F | Gladstone Institutional Advisory LLC | 266.514 | -0,61 | 11.444 | 3,82 | ||||
| 2026-01-14 | 13F | ORG Partners LLC | 245 | 0,00 | 11 | 0,00 | ||||
| 2026-02-06 | 13F | Pnc Financial Services Group, Inc. | 1.322 | -24,72 | 57 | -22,22 | ||||
| 2026-01-26 | 13F | Hixon Zuercher, LLC | 565.608 | -0,41 | 24.287 | 4,03 | ||||
| 2026-02-13 | 13F | National Bank Of Canada /fi/ | 0 | -100,00 | 0 | |||||
| 2026-02-06 | 13F | Evoke Wealth, Llc | 15.938 | 0,00 | 684 | 4,43 | ||||
| 2026-02-11 | 13F | Franklin Resources Inc | 3.785 | 0,00 | 163 | 4,52 | ||||
| 2026-01-20 | 13F | Thurston, Springer, Miller, Herd & Titak, Inc. | 54 | 2 | ||||||
| 2026-02-18 | 13F/A | Pinnacle Financial Partners, Inc. | 6.666 | 286 | ||||||
| 2026-01-23 | 13F | Asset Advisors Investment Management, LLC | 429.780 | 37,10 | 18.455 | 43,20 | ||||
| 2026-01-28 | 13F | Edge Financial Advisors LLC | 21.338 | 0,15 | 916 | 4,57 | ||||
| 2026-02-12 | 13F | Hm Payson & Co | 2.143 | 0,00 | 92 | 4,55 | ||||
| 2026-01-29 | 13F | Segment Wealth Management, LLC | 8.820 | 379 | ||||||
| 2026-02-12 | 13F | Wealthspire Advisors, LLC | 0 | -100,00 | 0 | |||||
| 2026-02-02 | 13F | Robertson Stephens Wealth Management, LLC | 387.081 | 0,49 | 16.621 | 4,96 | ||||
| 2026-02-11 | 13F | LPL Financial LLC | 5.780.977 | -3,17 | 248.235 | 1,14 | ||||
| 2026-02-09 | 13F | Clearwater Capital Advisors, LLC | 64.744 | -2,30 | 2.780 | 2,06 | ||||
| 2026-02-13 | 13F | Golden State Wealth Management, LLC | 1.235 | 0,49 | 53 | 6,00 | ||||
| 2026-01-23 | 13F | Farther Finance Advisors, LLC | 10.756 | 63,34 | 462 | 70,74 | ||||
| 2026-02-12 | 13F | Commonwealth Equity Services, Llc | 1.941.802 | 1,31 | 83.381 | 106.797,44 | ||||
| 2025-11-03 | 13F | Townsquare Capital Llc | 5.896 | -1,27 | 242 | 2,54 | ||||
| 2026-01-21 | 13F/A | Winthrop Advisory Group LLC | 128.509 | 2,57 | 5.518 | 7,15 | ||||
| 2026-02-09 | 13F | Hartland & Co., LLC | 5.373 | 0,04 | 231 | 4,55 | ||||
| 2026-01-23 | 13F | Family CFO Inc | 1.491 | 64 | ||||||
| 2026-02-10 | 13F | Waterloo Capital, L.P. | 12.671 | -2,18 | 544 | 2,26 | ||||
| 2026-01-07 | 13F | Harbor Investment Advisory, Llc | 1.417 | 0,00 | 61 | 3,45 | ||||
| 2026-01-16 | 13F | Marino, Stram & Associates Llc | 8.026 | 0,04 | 345 | 4,56 | ||||
| 2026-02-11 | 13F | Cerity Partners LLC | 1.366.320 | 0,14 | 58.670 | 4,60 | ||||
| 2026-02-13 | 13F | Integrated Wealth Concepts LLC | 151.836 | -44,13 | 6.520 | -41,65 | ||||
| 2025-11-13 | 13F | Glenmede Investment Management, LP | 907 | 37 | ||||||
| 2026-02-11 | 13F | Prudent Man Advisors, LLC | 7.563 | 325 | ||||||
| 2026-02-17 | 13F | IHT Wealth Management, LLC | 5.208 | 0,00 | 224 | 4,21 | ||||
| 2026-02-17 | 13F | Advisory Services Network, LLC | 26.401 | 0,00 | 1.134 | 4,42 | ||||
| 2026-02-11 | 13F | Modus Advisors, LLC | 158 | 7 | ||||||
| 2026-01-30 | 13F | Wagner Wealth Management, Llc | 6.758 | 0,48 | 290 | 5,07 | ||||
| 2026-01-30 | 13F | United Community Bank | 2.645 | 0,00 | 114 | 4,63 | ||||
| 2026-02-12 | 13F | Steward Partners Investment Advisory, Llc | 14.122 | -3,79 | 606 | 0,50 | ||||
| 2026-02-13 | 13F | Capital Financial Group Inc\co\ /adv | 293.492 | 12.603 | ||||||
| 2026-01-13 | 13F | Parsons Capital Management Inc/ri | 5.582 | -50,61 | 240 | -48,49 | ||||
| 2026-01-21 | 13F | Ledyard National Bank | 498.040 | 0,07 | 21.386 | 4,52 | ||||
| 2026-02-06 | 13F | EverSource Wealth Advisors, LLC | 228.348 | 0,43 | 9.805 | 4,90 | ||||
| 2026-02-11 | 13F | Vise Technologies, Inc. | 33.970 | 1.459 | ||||||
| 2026-02-17 | 13F | LaSalle St. Investment Advisors, LLC | 9.533 | 3,12 | 0 | |||||
| 2026-01-26 | 13F | Key Capital Management, INC | 336 | 14 | ||||||
| 2026-01-27 | 13F | Brighton Jones Llc | 0 | -100,00 | 0 | |||||
| 2026-02-17 | 13F | Advisor Group Holdings, Inc. | 213.756 | -6,80 | 9.185 | -2,18 | ||||
| 2026-01-20 | 13F | Monticello Wealth Management, Llc | 265.657 | -3,25 | 11.407 | 1,05 | ||||
| 2026-02-03 | 13F | RWM Asset Management, LLC | 19.798 | 0,00 | 882 | 8,49 | ||||
| 2026-01-02 | 13F | Insight Wealth Strategies, LLC | 649.776 | 1,91 | 27.901 | 6,45 | ||||
| 2026-01-07 | 13F | Hilltop National Bank | 0 | -100,00 | 0 | |||||
| 2026-02-17 | 13F | Bank Of America Corp /de/ | 4.684.547 | 8,89 | 201.154 | 13,74 | ||||
| 2026-02-23 | 13F | Kera Capital Partners, Inc. | 341.670 | -15,30 | 15.235 | -8,13 | ||||
| 2026-02-17 | 13F | Qube Research & Technologies Ltd | 1.520 | 3.134,04 | 65 | 6.400,00 | ||||
| 2026-02-17 | 13F | Lantern Wealth Advisors, LLC | 4.971 | 0,28 | 213 | 4,93 | ||||
| 2026-01-14 | 13F | EdgeRock Capital LLC | 6.946 | 0,00 | 298 | 4,56 | ||||
| 2026-01-13 | 13F | Stephens Consulting, LLC | 140 | 0,00 | 6 | 20,00 | ||||
| 2026-02-12 | 13F | Insigneo Advisory Services, Llc | 8.047 | -0,61 | 346 | 3,92 | ||||
| 2026-02-17 | 13F | Fmr Llc | 53.369 | 22,93 | 2.292 | 28,42 | ||||
| 2026-01-09 | 13F | Community Trust & Investment Co | 60.340 | -10,71 | 2.591 | -6,73 | ||||
| 2026-02-19 | 13F | CI Private Wealth, LLC | 960.951 | -1,35 | 41.263 | 4,00 | ||||
| 2026-01-12 | 13F | Richard P Slaughter Associates Inc | 29.220 | -0,03 | 1.255 | 4,41 | ||||
| 2026-02-13 | 13F | 10Elms LLP | 392 | 0,00 | 17 | 0,00 | ||||
| 2026-03-04 | 13F | SHP Wealth Management | 1 | 0 | ||||||
| 2026-01-05 | 13F | Miller Global Investments, LLC | 992 | 43 | ||||||
| 2026-01-14 | 13F | Lee-Kelleher Wealth Management | 30.466 | 0,00 | 1.308 | 4,47 | ||||
| 2026-02-11 | 13F | Waddell & Associates, Llc | 14.192 | 0,00 | 609 | 4,46 | ||||
| 2026-02-17 | 13F | Cetera Investment Advisers | 610.791 | -1,17 | 26.227 | 3,23 | ||||
| 2026-02-17 | 13F | Two Sigma Securities, Llc | 5.247 | 225 | ||||||
| 2026-01-28 | 13F | HB Wealth Management, LLC | 2.590.791 | -3,38 | 111.249 | 0,92 | ||||
| 2026-01-23 | 13F | Assetmark, Inc | 11.408 | 53,79 | 490 | 60,86 | ||||
| 2026-02-17 | 13F | GeoWealth Management, LLC | 121.334 | 9,17 | 5.210 | 14,03 | ||||
| 2026-02-13 | 13F | Resources Investment Advisors, LLC. | 993.660 | -0,81 | 42.668 | 3,60 | ||||
| 2026-02-10 | 13F | Bank of New York Mellon Corp | 717.165 | -1,99 | 30.795 | 2,37 | ||||
| 2026-01-22 | 13F | Cascade Investment Group, Inc. | 7.916 | 0,00 | 340 | 4,31 | ||||
| 2026-02-06 | 13F | Larson Financial Group LLC | 0 | -100,00 | 0 | |||||
| 2026-02-03 | 13F | Manning & Napier Advisors Llc | 269.020 | 11,03 | 11.608 | 16,55 | ||||
| 2026-02-13 | 13F | SYM FINANCIAL Corp | 5.862 | 16,08 | 252 | 21,26 | ||||
| 2026-02-06 | 13F | Vestmark Advisory Solutions, Inc. | 37.070 | 36,76 | 1.592 | 42,82 | ||||
| 2026-02-17 | 13F | United Capital Financial Advisers, Llc | 211.157 | 9.067 | ||||||
| 2026-02-10 | 13F | Goldman Sachs Group Inc | 1.737.052 | -10,61 | 74.589 | -6,63 | ||||
| 2026-02-17 | 13F | Creative Planning | 34.903 | -16,39 | 1.499 | -12,70 | ||||
| 2026-02-06 | 13F | Creative Financial Designs Inc /adv | 436 | 0,00 | 19 | 5,88 | ||||
| 2026-01-20 | 13F | Coastal Investment Advisors, Inc. | 225 | 0,45 | 10 | 0,00 | ||||
| 2026-02-05 | 13F | Blue Water Asset Management | 173.445 | 7.448 | ||||||
| 2026-02-10 | 13F | Root Financial Partners, LLC | 4.576 | 0,00 | 197 | 4,26 | ||||
| 2026-02-10 | 13F | Lido Advisors, LLC | 9.162 | 0,00 | 377 | 0,00 | ||||
| 2026-02-02 | 13F | Avidian Wealth Solutions, LLC | 53.765 | 0,12 | 2.309 | 4,58 | ||||
| 2026-02-13 | 13F | Transamerica Financial Advisors, Inc. | 6.112 | 262 | ||||||
| 2026-02-17 | 13F | Wealth Watch Advisors, INC | 1.193 | 0,00 | 51 | 4,08 | ||||
| 2026-01-26 | 13F | Reyes Financial Architecture, Inc. | 123 | 0,00 | 5 | 0,00 | ||||
| 2026-01-28 | 13F | Turtle Creek Wealth Advisors, LLC | 18.415 | 0,00 | 791 | 4,36 | ||||
| 2026-02-10 | 13F | Private Wealth Asset Management, LLC | 17.631 | 0,20 | 757 | 4,70 | ||||
| 2026-02-09 | 13F | Rhl Group, Llc | 294 | 13 | ||||||
| 2026-02-17 | 13F | Keebeck Wealth Management, LLC | 240.094 | -8,04 | 10.310 | -3,95 | ||||
| 2026-01-22 | 13F/A | Cresset Asset Management, LLC | 0 | -100,00 | 0 | |||||
| 2026-02-17 | 13F | Stokes Family Office, LLC | 15.038 | -24,71 | 646 | -21,44 | ||||
| 2026-01-21 | 13F | Sowell Financial Services LLC | 19.860 | -5,20 | 853 | -1,05 | ||||
| 2026-02-13 | 13F | Aptus Capital Advisors, LLC | 1.187 | -0,84 | 51 | 2,04 | ||||
| 2026-01-09 | 13F | First Heartland Consultants, Inc. | 5.950 | -0,73 | 255 | 3,66 | ||||
| 2026-01-23 | 13F | Fifth Third Securities, Inc. | 15.459 | 1,66 | 664 | 6,08 | ||||
| 2026-01-28 | 13F | Salomon & Ludwin, LLC | 2.939 | -6,31 | 129 | -1,54 | ||||
| 2026-02-13 | 13F | Wells Fargo & Company/mn | 22.119.644 | 3,50 | 949.818 | 8,10 | ||||
| 2026-01-13 | 13F | John W. Brooker & Co., CPAs | 31.310 | -8,13 | 1.344 | -4,07 | ||||
| 2026-02-11 | 13F | Buckingham Strategic Partners | 30.489 | -2,22 | 1.309 | 2,11 | ||||
| 2026-02-13 | 13F | Kestra Advisory Services, LLC | 0 | -100,00 | 0 | |||||
| 2026-01-29 | 13F | Camelot Portfolios, LLC | 10.980 | -21,74 | 471 | -18,23 | ||||
| 2026-01-27 | 13F | Vantagepoint Investment Advisers Llc | 5.429.627 | -3,01 | 233.148 | 1,31 | ||||
| 2026-01-28 | 13F | EPG Wealth Management LLC | 2.579 | 111 | ||||||
| 2026-02-10 | 13F | Envestnet Asset Management Inc | 2.736.987 | -12,00 | 117.526 | -8,08 | ||||
| 2026-01-26 | 13F | Patriot Financial Group Insurance Agency, LLC | 6.189 | -15,98 | 266 | -12,25 | ||||
| 2026-02-04 | 13F | Atlantic Union Bankshares Corp | 226 | 0,00 | 10 | 0,00 | ||||
| 2026-01-28 | 13F | Atwood & Palmer Inc | 269.621 | -1,26 | 11.578 | 3,14 | ||||
| 2026-02-13 | 13F | Ausdal Financial Partners, Inc. | 10.769 | -9,83 | 462 | -5,71 | ||||
| 2026-02-12 | 13F | Tripletail Wealth Management, LLC | 0 | -100,00 | 0 | |||||
| 2026-02-13 | 13F | Umb Bank N A/mo | 2.803 | 0,00 | 120 | 4,35 | ||||
| 2026-01-22 | 13F | Maseco Llp | 342 | 15 | ||||||
| 2026-02-18 | 13F | GWM Advisors LLC | 94.667 | -9,56 | 4.065 | -5,55 | ||||
| 2026-02-17 | 13F | Prostatis Group LLC | 48.993 | 4,99 | 2.104 | 9,65 | ||||
| 2026-01-12 | 13F | World Equity Group, Inc. | 5.490 | 236 | ||||||
| 2026-02-06 | 13F | Envestnet Portfolio Solutions, Inc. | 480.415 | 9,95 | 20.629 | 14,85 | ||||
| 2026-02-13 | 13F | Glen Eagle Advisors, LLC | 337 | 0,00 | 14 | 7,69 | ||||
| 2025-11-12 | 13F | Park Square Financial Group, LLC | 0 | -100,00 | 0 | |||||
| 2025-11-06 | 13F | LexAurum Advisors, LLC | 543.277 | 10,94 | 22.334 | 15,00 | ||||
| 2026-02-04 | 13F | Drive Wealth Management, Llc | 88.135 | 11,50 | 3.785 | 16,47 | ||||
| 2026-01-30 | 13F | Us Bancorp \de\ | 6.003 | -11,37 | 258 | -7,55 | ||||
| 2026-02-17 | 13F | Hilltop Holdings Inc. | 19.787 | -2,89 | 850 | 1,43 | ||||
| 2026-01-08 | 13F | Wedmont Private Capital | 5.167 | 225 | ||||||
| 2026-02-02 | 13F | Ashton Thomas Securities, Llc | 921 | 0,00 | 40 | 5,41 | ||||
| 2025-10-21 | 13F | Signaturefd, Llc | 0 | -100,00 | 0 | |||||
| 2026-01-12 | 13F | Rialto Wealth Management, LLC | 498 | -12,48 | 21 | -8,70 | ||||
| 2026-01-22 | 13F | Newman Dignan & Sheerar, Inc. | 176.632 | 2,58 | 7.585 | 7,15 | ||||
| 2026-02-11 | 13F | Jpmorgan Chase & Co | 63.867 | -19,12 | 2.742 | -15,53 | ||||
| 2026-01-15 | 13F | Allspring Global Investments Holdings, LLC | 11.190 | 43,30 | 489 | 51,55 | ||||
| 2026-01-26 | 13F | Kelman-Lazarov, Inc. | 468.352 | -49,87 | 20.111 | -47,64 | ||||
| 2026-01-21 | 13F | Register Financial Advisors LLC | 265 | 0,38 | 11 | 10,00 | ||||
| 2026-02-12 | 13F | Brown Brothers Harriman & Co | 1.076 | 13,50 | 46 | 21,05 | ||||
| 2026-01-14 | 13F | Hennion & Walsh Asset Management, Inc. | 1.284.447 | 3,81 | 55.154 | 8,43 | ||||
| 2026-02-09 | 13F | Integrity Alliance, Llc. | 7.620 | 327 | ||||||
| 2026-01-26 | 13F | Harbor Asset Planning, Inc. | 82.334 | 1,67 | 3.535 | 6,19 | ||||
| 2026-01-26 | 13F | AE Wealth Management LLC | 1.015 | 32,85 | 44 | 38,71 | ||||
| 2026-01-28 | 13F | Cora Capital Advisors Llc | 15.712 | 0,00 | 675 | 4,50 | ||||
| 2026-02-12 | 13F | Colonial Trust Co / SC | 175 | 0,00 | 8 | 0,00 | ||||
| 2026-01-16 | 13F | Worth Financial Advisory Group, LLC | 13.709 | 0,00 | 589 | 4,44 | ||||
| 2026-02-10 | 13F | Verus Capital Partners, Llc | 9.243 | -2,48 | 397 | 1,80 | ||||
| 2026-02-05 | 13F | Allworth Financial LP | 3.232 | 4,39 | 139 | 8,66 | ||||
| 2026-02-09 | 13F | Morris Financial Concepts, Inc. | 6.787 | 0,00 | 291 | 4,30 | ||||
| 2026-01-14 | 13F | Pallas Capital Advisors LLC | 23.228 | -0,27 | 997 | 4,18 | ||||
| 2025-10-09 | 13F | Bartlett & Co. Wealth Management Llc | 0 | -100,00 | 0 | -100,00 | ||||
| 2026-01-28 | 13F | Boston Trust Walden Corp | 0 | -100,00 | 0 | |||||
| 2026-02-03 | 13F | International Assets Investment Management, Llc | 94 | 4 | ||||||
| 2026-02-04 | 13F | Strategic Family Wealth Counselors, L.L.C. | 8.117 | 0,00 | 353 | 6,01 | ||||
| 2026-02-11 | 13F | O'shaughnessy Asset Management, Llc | 15.240 | 12,60 | 654 | 17,63 | ||||
| 2026-01-26 | 13F | PFG Investments, LLC | 19.362 | -5,26 | 831 | -1,07 | ||||
| 2026-02-12 | 13F | CIBC Private Wealth Group, LLC | 2.467 | 0,00 | 106 | 3,96 | ||||
| 2026-02-13 | 13F | Alerus Financial Na | 54 | 2 | ||||||
| 2026-02-06 | 13F | CFO4Life Group, LLC | 136.991 | -4,52 | 5.882 | -0,27 | ||||
| 2026-02-17 | 13F | Old Mission Capital Llc | 0 | -100,00 | 0 | |||||
| 2026-02-10 | 13F | IAG Wealth Partners, LLC | 600.503 | -1,60 | 25.786 | 2,77 | ||||
| 2025-10-22 | 13F | Gries Financial Llc | 12.536 | 61,09 | 515 | 67,21 | ||||
| 2026-02-12 | 13F | IFC & Insurance Marketing, Inc. | 716 | 0 | ||||||
| 2026-01-21 | 13F | Baker Ellis Asset Management LLC | 422.232 | 1,41 | 18.131 | 5,92 | ||||
| 2026-02-04 | 13F | Ameritas Advisory Services, LLC | 0 | -100,00 | 0 | |||||
| 2026-02-06 | 13F | Paul R. Ried Financial Group, LLC | 478.183 | 0,75 | 20.533 | 5,24 | ||||
| 2026-02-13 | 13F | Shepherd Kaplan Krochuk, Llc | 11.203 | -33,69 | 481 | -30,69 | ||||
| 2026-01-21 | 13F | Cambridge Advisors Inc. | 7.600 | 0,00 | 326 | 4,49 | ||||
| 2026-02-09 | 13F | Texas Capital Bank Wealth Management Services Inc | 36.486 | 0,00 | 1.567 | 4,47 | ||||
| 2026-01-23 | 13F | Lunt Capital Management, Inc. | 25.198 | 0,00 | 1.082 | 4,54 | ||||
| 2026-01-29 | 13F | Sanctuary Advisors, LLC | 712.975 | 2,48 | 30.615 | 7,04 | ||||
| 2026-02-14 | 13F | Rockefeller Capital Management L.P. | 287.380 | 8,68 | 12.340 | 13,52 | ||||
| 2026-01-21 | 13F | Capital Advisors, Ltd. LLC | 61.318 | 0,12 | 3 | 0,00 | ||||
| 2025-10-20 | 13F | Sax Wealth Advisors, Llc | 0 | -100,00 | 0 | |||||
| 2026-01-09 | 13F | Dopkins Wealth Management, Llc | 23.388 | 0,00 | 1.004 | 4,47 | ||||
| 2026-02-03 | 13F | NewEdge Wealth, LLC | 8.596 | -0,23 | 369 | 4,24 | ||||
| 2026-02-03 | 13F | Retirement Planning Group | 83.837 | -3,36 | 3.600 | 0,93 | ||||
| 2026-02-13 | 13F | MAI Capital Management | 2.200 | 0,00 | 94 | 4,44 | ||||
| 2025-10-28 | 13F | BRYN MAWR TRUST Co | 4.055 | 0,00 | 167 | 3,75 | ||||
| 2025-11-12 | 13F | Mengis Capital Management, Inc. | 295.260 | 2,05 | 12.138 | 5,79 | ||||
| 2026-02-17 | 13F/A | Sentinus, LLC | 151.311 | 6.497 | ||||||
| 2025-09-26 | NP | AAAA - Amplius Aggressive Asset Allocation ETF | 10.186 | 397 | ||||||
| 2026-02-05 | 13F | Cambridge Investment Research Advisors, Inc. | 144.626 | -2,05 | 6 | 0,00 | ||||
| 2026-01-20 | 13F | Independence Bank of Kentucky | 1.000 | 0,00 | 43 | 2,44 | ||||
| 2026-02-09 | 13F | Key FInancial Inc | 39 | 0,00 | 2 | 0,00 | ||||
| 2025-11-17 | 13F | FSA Wealth Management LLC | 131 | 0,77 | 5 | 0,00 | ||||
| 2026-02-03 | 13F | Crossmark Global Holdings, Inc. | 0 | -100,00 | 0 | |||||
| 2026-01-08 | 13F | Tompkins Financial Corp | 978 | -8,17 | 42 | -4,65 | ||||
| 2026-01-28 | 13F | Trail Ridge Investment Advisors, LLC | 505.853 | 5,98 | 21.721 | 10,70 | ||||
| 2026-01-29 | 13F | Concurrent Investment Advisors, LLC | 15.519 | 22,24 | 666 | 27,83 | ||||
| 2026-01-08 | 13F | Elmwood Wealth Management, Inc. | 78.162 | -0,90 | 3.356 | 3,52 | ||||
| 2026-02-17 | 13F | Aqr Capital Management Llc | 543.358 | 0,99 | 23.332 | 5,48 | ||||
| 2026-02-17 | 13F | Quantinno Capital Management LP | 137.672 | -12,57 | 5.912 | -8,68 | ||||
| 2026-02-17 | 13F | Northern Trust Corp | 6.459 | 0,00 | 277 | 4,53 | ||||
| 2026-02-05 | 13F | HFM Investment Advisors, LLC | 283 | -3,08 | 12 | 9,09 | ||||
| 2026-01-27 | 13F | TD Waterhouse Canada Inc. | 461 | -85,61 | 20 | -85,61 | ||||
| 2026-02-13 | 13F | Smartleaf Asset Management LLC | 51.130 | -0,55 | 2.206 | 4,75 | ||||
| 2025-10-22 | 13F | Geneos Wealth Management Inc. | 0 | -100,00 | 0 | |||||
| 2025-10-24 | 13F | Hemington Wealth Management | 381 | 0,00 | 0 | |||||
| 2026-01-21 | 13F | Leo Wealth, LLC | 4.664 | 200 | ||||||
| 2026-02-17 | 13F | Perennial Investment Advisors, LLC | 26.335 | -7,23 | 1.131 | -3,09 | ||||
| 2026-02-06 | 13F | IFP Advisors, Inc | 137.019 | 1,99 | 5.884 | 6,54 | ||||
| 2026-01-13 | 13F | Kathmere Capital Management, LLC | 53.370 | -1,25 | 2.292 | 3,15 | ||||
| 2026-01-30 | 13F | Wealthfront Advisers Llc | 14.815 | -1,71 | 636 | 2,75 | ||||
| 2026-02-09 | 13F | Prospera Financial Services Inc | 6.839 | 23,63 | 294 | 29,07 | ||||
| 2026-01-14 | 13F | Wealthcare Advisory Partners LLC | 214.627 | -0,10 | 9.216 | 4,36 | ||||
| 2026-02-12 | 13F | Mount Yale Investment Advisors, LLC | 37.274 | 37,51 | 1.601 | 43,63 | ||||
| 2026-01-26 | 13F | Great Point Wealth Advisors, LLC | 292.893 | -0,84 | 12.577 | 3,57 | ||||
| 2026-02-09 | 13F | Straightline Group Llc | 682.684 | -0,00 | 30.250 | 6,97 | ||||
| 2026-02-09 | 13F | Leavell Investment Management, Inc. | 30.535 | -0,47 | 1.311 | 3,97 | ||||
| 2026-02-23 | 13F | Beaird Harris Wealth Management, LLC | 2.414 | 0,00 | 104 | 4,04 | ||||
| 2026-02-13 | 13F | Brown Advisory Inc | 6.355 | 0,00 | 273 | 4,21 | ||||
| 2025-11-14 | 13F | Ameriprise Financial Inc | 0 | -100,00 | 0 | -100,00 | ||||
| 2026-02-11 | 13F | Fca Corp /tx | 237.908 | -1,40 | 10.216 | 2,99 | ||||
| 2026-02-11 | 13F | Prestige Wealth Management Group LLC | 291 | 13 | ||||||
| 2026-02-17 | 13F | Blair William & Co/il | 3.168 | 0,00 | 136 | 4,62 | ||||
| 2026-02-09 | 13F | Global Assets Advisory, LLC | 5.247 | 0,00 | 225 | 4,65 | ||||
| 2026-01-14 | 13F | ORG Wealth Partners, LLC | 3.617 | 0,00 | 155 | 4,73 | ||||
| 2026-01-20 | 13F | SOA Wealth Advisors, LLC. | 593 | 0,51 | 25 | 4,17 | ||||
| 2025-10-21 | 13F | SILVER OAK SECURITIES, Inc | 0 | -100,00 | 0 | |||||
| 2026-02-05 | 13F | AlphaCore Capital LLC | 578.310 | 24.833 | ||||||
| 2026-02-11 | 13F | Parallel Advisors, LLC | 143 | -76,48 | 6 | -75,00 | ||||
| 2026-01-12 | 13F | Salem Investment Counselors Inc | 0 | -100,00 | 0 | |||||
| 2026-02-12 | 13F | Great Valley Advisor Group, Inc. | 0 | -100,00 | 0 | |||||
| 2026-01-16 | 13F | Perigon Wealth Management, LLC | 18.151 | 12,40 | 779 | 17,50 | ||||
| 2026-01-14 | 13F | Goelzer Investment Management, Inc. | 8.953 | 0,00 | 384 | 4,35 | ||||
| 2026-02-02 | 13F | PKS Advisory Services, LLC | 79.457 | -1,92 | 3.412 | 2,43 | ||||
| 2026-02-17 | 13F | Susquehanna International Group, Llp | 0 | -100,00 | 0 | |||||
| 2026-02-17 | 13F | Private Advisor Group, LLC | 81.929 | -1,64 | 3.518 | 2,75 | ||||
| 2026-01-29 | 13F | Silver Oak Wealth Advisors Services, Llc | 714.410 | -0,96 | 30.677 | 3,45 | ||||
| 2026-01-29 | 13F | UMA Financial Services, Inc. | 902 | 0,00 | 39 | 2,70 | ||||
| 2026-01-23 | 13F | Smallwood Wealth Investment Management, LLC | 2 | 0,00 | 0 | |||||
| 2026-02-09 | 13F | Strategic Financial Services, Inc, | 903.394 | -2,64 | 41.095 | 7,74 | ||||
| 2026-02-17 | 13F | Jones Financial Companies Lllp | 125.829 | 33,01 | 5.403 | 40,01 | ||||
| 2026-01-26 | 13F | Annex Advisory Services, LLC | 1.365.028 | 694,24 | 58.614 | 729,64 | ||||
| 2026-02-09 | 13F | Harbour Investments, Inc. | 4.992 | 0,44 | 214 | 4,90 | ||||
| 2026-02-03 | 13F | Channel Wealth Llc | 147.213 | -11,76 | 6.321 | -7,83 | ||||
| 2026-02-02 | 13F | Montag A & Associates Inc | 3.705 | 159 | ||||||
| 2026-02-02 | 13F | Oak Harbor Wealth Partners, Llc | 26.773 | -0,42 | 1.150 | 3,98 | ||||
| 2026-02-12 | 13F | BlackRock, Inc. | 585 | 25 | ||||||
| 2026-02-12 | 13F | Principal Securities, Inc. | 0 | -100,00 | 0 | |||||
| 2026-01-13 | 13F | Stonehearth Capital Management, LLC | 79.493 | -0,63 | 3.413 | 3,80 | ||||
| 2025-11-14 | 13F/A | NorthRock Partners, LLC | 0 | -100,00 | 0 | |||||
| 2026-03-03 | 13F | NWF Advisory Services Inc. | 33.319 | 1,99 | 1.431 | 6,56 | ||||
| 2026-02-13 | 13F | Stifel Financial Corp | 35.138 | 46,66 | 1.509 | 53,25 | ||||
| 2025-11-12 | 13F | Palo Alto Wealth Advisors, Llc | 239.540 | 15,23 | 10.058 | 22,00 | ||||
| 2026-01-28 | 13F | Lebenthal Global Advisors, LLC | 482.960 | 20.738 | ||||||
| 2026-02-19 | 13F | BFI Wealth Solutions, LLC | 8.000 | 344 | ||||||
| 2026-01-29 | 13F | Ashton Thomas Private Wealth, LLC | 34.910 | 9,77 | 1.499 | 14,69 | ||||
| 2026-02-17 | 13F | Evergreen Wealth Solutions, LLC | 0 | -100,00 | 0 | |||||
| 2026-02-18 | 13F | EP Wealth Advisors, Inc. | 46.389 | 1.992 | ||||||
| 2026-02-17 | 13F | Tower Research Capital LLC (TRC) | 0 | -100,00 | 0 | |||||
| 2026-02-13 | 13F | Mariner, LLC | 27.548 | -51,35 | 1.183 | -49,20 | ||||
| 2026-01-27 | 13F | Emerald Advisors, LLC | 39.336 | -7,99 | 1.689 | -3,87 | ||||
| 2026-01-28 | 13F | White Pine Investment CO | 373.145 | -0,45 | 16 | 6,67 | ||||
| 2026-02-06 | 13F | Signature Estate & Investment Advisors Llc | 28.836 | 2,02 | 1.238 | 6,63 | ||||
| 2026-02-11 | 13F | Alteri Wealth LLC | 8.473 | 0,06 | 364 | 4,31 | ||||
| 2026-01-26 | 13F | Heritage Wealth Management, Inc. | 6.580 | 0,00 | 283 | 4,44 | ||||
| 2026-02-17 | 13F | Ducere Wealth Management LLC | 67.016 | 2.878 | ||||||
| 2026-01-12 | 13F | Heartwood Wealth Advisors LLC | 0 | -100,00 | 0 | |||||
| 2026-01-15 | 13F | GFG Capital, LLC | 708.781 | -0,51 | 30.435 | 3,92 | ||||
| 2026-02-12 | 13F | Betterment LLC | 3.095.283 | -4,86 | 133 | -0,75 | ||||
| 2026-02-06 | 13F | Cullen/frost Bankers, Inc. | 983 | 0,00 | 42 | 5,00 | ||||
| 2026-02-10 | 13F | Founders Financial Securities Llc | 7.774 | 334 | ||||||
| 2026-02-13 | 13F | Maia Wealth LLC | 31.847 | -12,20 | 1.464 | -3,24 | ||||
| 2025-11-14 | 13F | Citadel Advisors Llc | 0 | -100,00 | 0 | |||||
| 2026-02-04 | 13F | LRI Investments, LLC | 12.201 | 11,65 | 524 | 16,48 | ||||
| 2026-01-23 | 13F | Legacy Bridge, LLC | 883 | 0,00 | 38 | 2,78 | ||||
| 2026-02-06 | 13F | HighTower Advisors, LLC | 363.417 | 6,04 | 15.605 | 10,76 | ||||
| 2026-02-26 | 13F | Anchor Investment Management, LLC | 122.254 | 4,72 | 5.250 | 9,38 | ||||
| 2026-01-15 | 13F | Quantum Financial Planning Services, Inc. | 18.810 | 808 | ||||||
| 2026-02-05 | 13F | Thrivent Financial For Lutherans | 608.263 | 5,81 | 26 | 13,04 | ||||
| 2026-02-10 | 13F | Beckerman Institutional, LLC | 14.568 | -0,54 | 626 | 3,82 | ||||
| 2026-02-13 | 13F | Citigroup Inc | 9.789 | -22,87 | 420 | -19,39 | ||||
| 2026-02-13 | 13F | Baird Financial Group, Inc. | 163.272 | -1,80 | 7.011 | 2,58 | ||||
| 2026-02-09 | 13F | Glenview Trust Co | 30.253 | -4,55 | 1.299 | -0,23 | ||||
| 2026-02-10 | 13F | Hazlett, Burt & Watson, Inc. | 147 | 0,68 | 0 | |||||
| 2025-11-07 | 13F | Beacon Capital Management, LLC | 0 | -100,00 | 0 | |||||
| 2026-02-10 | 13F/A | Northwestern Mutual Wealth Management Co | 733.447 | 2,15 | 31.494 | 6,69 | ||||
| 2026-01-12 | 13F | Amplius Wealth Advisors, LLC | 16.508 | -7,42 | 709 | -3,41 | ||||
| 2026-02-06 | 13F | Global Retirement Partners, LLC | 20.101 | -8,34 | 863 | -4,22 | ||||
| 2026-02-13 | 13F | Ubs Asset Management Americas Inc | 7.562 | 325 |