Grundlæggende statistik
| Institutionelle aktier (lange) | 127.887.365 - 66,66% (ex 13D/G) - change of 17,52MM shares 15,87% MRQ |
| Institutionel værdi (lang) | $ 2.722.909 USD ($1000) |
Institutionelt ejerskab og aktionærer
Galaxy Digital Inc. (US:GLXY) har 314 institutionelle ejere og aktionærer, der har indsendt 13D/G- eller 13F-formularer til Securities Exchange Commission (SEC). Disse institutioner har i alt 127,887,365 aktier. Største aktionærer omfatter Vanguard Group Inc, Fmr Llc, Capital Research Global Investors, BlackRock, Inc., Jane Street Group, Llc, Susquehanna International Group, Llp, Price T Rowe Associates Inc /md/, Invesco Ltd., Covalis Capital Llp, and Toroso Investments, LLC .
Galaxy Digital Inc. (NasdaqGS:GLXY) institutionel ejerskabsstruktur viser aktuelle positioner i virksomheden efter institutioner og fonde, samt seneste ændringer i positionsstørrelse. Større aktionærer kan omfatte individuelle investorer, investeringsforeninger, hedgefonde eller institutioner. Skema 13D angiver, at investoren besidder (eller besidder) mere end 5 % af virksomheden og har til hensigt (eller har til hensigt at) aktivt at forfølge en ændring i forretningsstrategi. Skema 13G indikerer en passiv investering på over 5%.
The share price as of April 27, 2026 is 25,04 / share. Previously, on May 16, 2025, the share price was 22,80 / share. This represents an increase of 9,82% over that period.

Fondens stemningsscore
Fund Sentiment Score (fka Ownership Accumulation Score) finder de aktier, der bliver mest købt af fonde. Det er resultatet af en sofistikeret, multi-faktor kvantitativ model, der identificerer virksomheder med de højeste niveauer af institutionel akkumulering. Scoringsmodellen bruger en kombination af den samlede stigning i oplyste ejere, ændringerne i porteføljeallokeringer i disse ejere og andre målinger. Tallet går fra 0 til 100, hvor højere tal indikerer et højere niveau af akkumulering for sine jævnaldrende, og 50 er gennemsnittet.
Opdateringsfrekvens: Dagligt
Se Ownership Explorer, som giver en liste over højest rangerende virksomheder.
AI+ Ask Fintel’s AI assistant about Galaxy Digital Inc..
Select a question to share a public post with an AI-crafted answer.
Thinking of good questions…
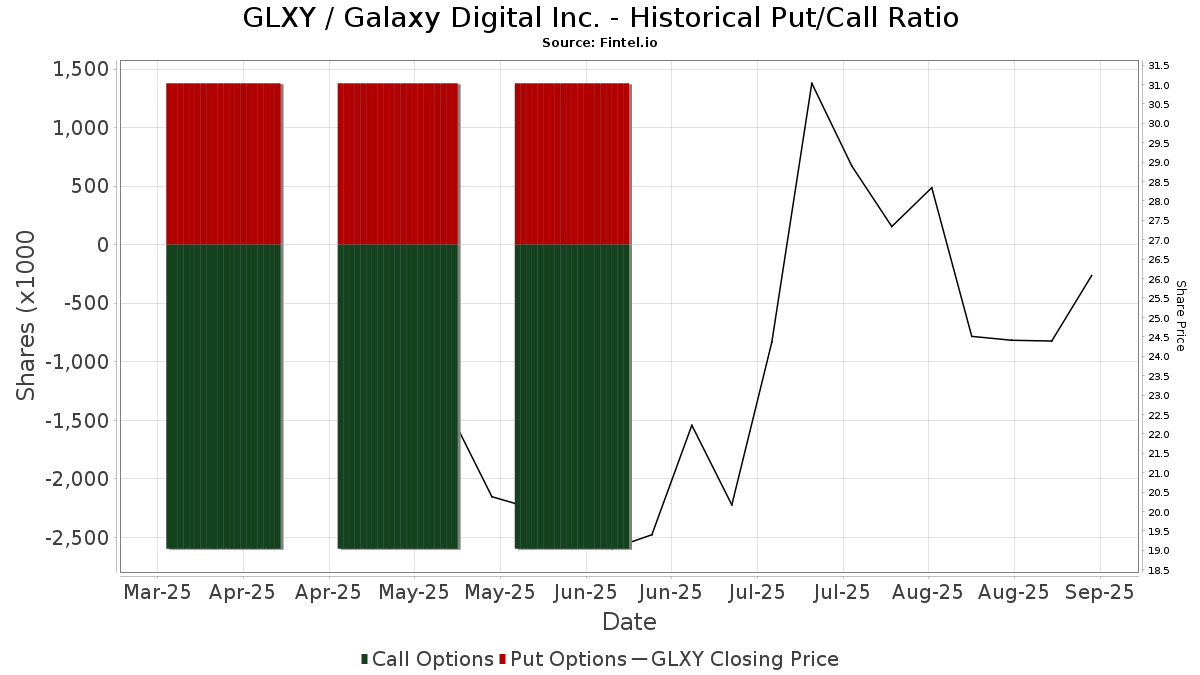
Institutionel Put/Call-forhold
Ud over at indberette standardaktie- og gældsudstedelser skal institutter med mere end 100 mill. aktiver under forvaltning også oplyse deres put- og call-optionsbeholdninger. Da salgsoptioner generelt indikerer negativ stemning, og købsoptioner indikerer positiv stemning, kan vi få en fornemmelse af den overordnede institutionelle stemning ved at plotte forholdet mellem put og kald. Diagrammet til højre viser det historiske put/call-forhold for dette instrument.
Brug af Put/Call Ratio som en indikator for investorernes stemning overvinder en af de vigtigste mangler ved at bruge totalt institutionelt ejerskab, som er, at en betydelig mængde af aktiver under forvaltning investeres passivt for at spore indekser. Passivt forvaltede fonde køber typisk ikke optioner, så indikatoren for put/call-forholdet følger mere nøje følelsen af aktivt forvaltede fonde.
13D/G-arkivering
Vi præsenterer 13D/G ansøgninger separat fra 13F ansøgninger på grund af den forskellige behandling af SEC. 13D/G-ansøgninger kan indgives af grupper af investorer (med én ledende), hvorimod 13F-ansøgninger ikke kan. Dette resulterer i situationer, hvor en investor kan indsende en 13D/G, der rapporterer én værdi for de samlede aktier (der repræsenterer alle de aktier, der ejes af investorgruppen), men derefter indsender en 13F, der rapporterer en anden værdi for de samlede aktier (der udelukkende repræsenterer deres egne) ejendomsret). Det betyder, at aktieejerskab af 13D/G-arkiver og 13F-arkiveringer ofte ikke er direkte sammenlignelige, så vi præsenterer dem separat.
Bemærk: Fra den 16. maj 2021 viser vi ikke længere ejere, der ikke har indsendt en 13D/G inden for det seneste år. Tidligere viste vi den fulde historie af 13D/G-arkiver. Generelt skal enheder, der er forpligtet til at indgive 13D/G-ansøgninger, indgive mindst årligt, før de indsender en afsluttende ansøgning. Dog forlader fonde nogle gange positioner uden at indsende en afsluttende ansøgning (dvs. de afvikler), så visning af den fulde historie resulterede nogle gange i forvirring om det nuværende ejerskab. For at undgå forvirring viser vi nu kun 'aktuelle' ejere - det vil sige - ejere, der har anmeldt inden for det seneste år.
Upgrade to unlock premium data.
| Fil dato | Form | Investor | Forrige Aktier |
Seneste Aktier |
Δ Aktier (Procent) |
Ejendomsret (Procent) |
Δ Ejerskab (Procent) |
|
|---|---|---|---|---|---|---|---|---|
| 2026-02-12 | Capital Research Global Investors | 18,161,998 | 9.40 | |||||
| 2026-02-06 | Novogratz Michael | 195,161,415 | 192,161,415 | -1.54 | 49.94 | -6.62 | ||
| 2026-02-05 | FMR LLC | 24,925,990 | 21,154,711 | -15.13 | 10.90 | -27.33 | ||
| 2026-01-07 | VANGUARD GROUP INC | 14,026,571 | 20,669,893 | 47.36 | 10.74 | 26.50 |
13F og NPORT arkivering
Detaljer om 13F-arkivering er gratis. Detaljer om NP-ansøgninger kræver et premium-medlemskab. Grønne rækker angiver nye positioner. Røde rækker angiver lukkede positioner. Klik på linket ikon for at se den fulde transaktionshistorik.
Opgrader
for at låse premium-data op og eksportere til Excel ![]() .
.
| Fil dato | Kilde | Investor | Type | Gennemsnitlig pris (Øst) |
Aktier | Δ Aktier (%) |
Rapporteret Værdi ($1000) |
Δ Værdi (%) |
Port Alloc (%) |
|
|---|---|---|---|---|---|---|---|---|---|---|
| 2026-03-12 | 13F/A | Peak6 Llc | Call | 318.000 | -64,01 | 7.110 | -76,20 | |||
| 2026-02-03 | 13F | Encompass More Asset Management | 40.081 | 896 | ||||||
| 2026-04-10 | 13F | Armstrong Advisory Group, Inc | 79 | 1 | ||||||
| 2026-01-30 | 13F | Bogart Wealth, LLC | 700 | 16 | ||||||
| 2026-03-12 | 13F/A | Peak6 Llc | 18.156 | 406 | ||||||
| 2026-02-12 | 13F | Ensign Peak Advisors, Inc | 11.450 | -61,45 | 256 | -74,50 | ||||
| 2026-03-12 | 13F/A | Peak6 Llc | Put | 30.000 | -57,57 | 671 | -71,97 | |||
| 2026-02-13 | 13F | Soros Fund Management Llc | 271.911 | -0,69 | 6.080 | -34,33 | ||||
| 2026-02-13 | 13F | Public Employees Retirement Association Of Colorado | 16.775 | 0,00 | 0 | |||||
| 2026-02-17 | 13F | Himension Fund | 20.329 | 96,17 | 455 | 29,71 | ||||
| 2026-02-14 | 13F | Howe & Rusling Inc | 0 | -100,00 | 0 | |||||
| 2026-02-10 | 13F | Norges Bank | 1.431.241 | 32.045 | ||||||
| 2026-02-17 | 13F | SummitTX Capital, L.P. | 10.121 | -0,71 | 226 | -34,30 | ||||
| 2026-02-11 | 13F | Winton Capital Group Ltd | 172.415 | 3.855 | ||||||
| 2025-11-12 | 13F | Fifth Lane Capital, Lp | 0 | -100,00 | 0 | -100,00 | ||||
| 2026-02-23 | 13F | Virtu Financial LLC | 52.803 | 1 | ||||||
| 2026-04-10 | 13F/A | OP Asset Management Ltd | 50.937 | 940 | ||||||
| 2026-04-17 | 13F | RFG Advisory, LLC | 45.933 | 2,69 | 847 | -15,30 | ||||
| 2026-01-28 | 13F | United Asset Strategies, Inc. | 10.495 | 0,00 | 235 | -33,90 | ||||
| 2026-02-10 | 13F | Quantbot Technologies LP | 99.570 | 2.226 | ||||||
| 2026-02-17 | 13F | Magnetar Financial LLC | 16.000 | 358 | ||||||
| 2026-02-12 | 13F | Jane Street Group, Llc | Put | 499.800 | -40,06 | 11.176 | -60,36 | |||
| 2026-02-12 | 13F | Jane Street Group, Llc | Call | 4.506.200 | 40,95 | 100.759 | -6,78 | |||
| 2026-02-12 | 13F | Jane Street Group, Llc | 16.888 | -96,50 | 378 | -97,69 | ||||
| 2026-01-13 | 13F | Sage Advisors, Llc | 17.863 | 69,14 | 399 | 11,76 | ||||
| 2026-02-11 | 13F | Picton Mahoney Asset Management | 1.500 | 200,00 | 34 | |||||
| 2026-02-04 | 13F | Virginia Retirement Systems Et Al | 107.200 | 1.524,24 | 2.397 | 974,44 | ||||
| 2026-02-11 | 13F | IMA Wealth, Inc. | 28 | 1 | ||||||
| 2026-02-17 | 13F | Amundi | 14.900 | 333 | ||||||
| 2026-02-12 | 13F | Elo Mutual Pension Insurance Co | 45.500 | 1.017 | ||||||
| 2026-02-17 | 13F | Longaeva Partners L.P. | 0 | -100,00 | 0 | |||||
| 2026-03-06 | 13F | Hsbc Holdings Plc | 42.610 | 958 | ||||||
| 2026-04-21 | 13F | Wedbush Securities Inc | 0 | -100,00 | 0 | |||||
| 2026-02-13 | 13F | Citigroup Inc | 71.723 | 275,89 | 1.604 | 148,53 | ||||
| 2026-02-13 | 13F | Stifel Financial Corp | 18.083 | -57,99 | 404 | -72,23 | ||||
| 2026-02-03 | 13F | CORDA Investment Management, LLC. | 47.055 | -10,96 | 1.052 | -41,10 | ||||
| 2026-02-02 | 13F | SevenBridge Financial Group, LLC | 0 | -100,00 | 0 | |||||
| 2025-11-14 | 13F | Resolute Capital Asset Partners LLC | 0 | -100,00 | 0 | -100,00 | ||||
| 2026-02-10 | 13F | JTC Employer Solutions Trusteee Ltd | 5.396 | 0,00 | 0 | |||||
| 2026-02-13 | 13F | Gts Securities Llc | 15.271 | 341 | ||||||
| 2026-01-26 | 13F | Cwm, Llc | 2.954 | 108,17 | 0 | |||||
| 2026-02-17 | 13F | DZ BANK AG Deutsche Zentral Genossenschafts Bank, Frankfurt am Main | 251.496 | 5.623 | ||||||
| 2026-02-17 | 13F | SIG North Trading, ULC | Put | 28.400 | -74,51 | 635 | -83,14 | |||
| 2026-02-17 | 13F | SIG North Trading, ULC | Call | 189.600 | -46,18 | 4.239 | -64,41 | |||
| 2026-02-13 | 13F | Barclays Plc | 109.632 | 6,56 | 2.451 | -29,53 | ||||
| 2026-02-13 | 13F | Barclays Plc | Call | 100 | 2 | |||||
| 2026-02-17 | 13F | Citadel Advisors Llc | Call | 2.494.400 | 38,76 | 55.775 | -8,24 | |||
| 2026-02-17 | 13F | Citadel Advisors Llc | 1.409.132 | 50,92 | 31.508 | -0,19 | ||||
| 2026-01-28 | 13F | Universal- Beteiligungs- und Servicegesellschaft mbH | 109.250 | -2,89 | 2.483 | -34,74 | ||||
| 2026-02-17 | 13F | Citadel Advisors Llc | Put | 1.136.800 | -11,45 | 25.419 | -41,44 | |||
| 2026-02-19 | 13F | Invesco Ltd. | 3.082.187 | 31,10 | 68.918 | -13,30 | ||||
| 2026-02-17 | 13F | Toronto Dominion Bank | 46.136 | 56,13 | 1.033 | 3,30 | ||||
| 2026-04-16 | 13F | Lee Johnson Capital Management, Llc | 0 | -100,00 | 0 | |||||
| 2026-01-29 | 13F | Vanguard Group Inc | 20.669.893 | 27,54 | 462.310 | -15,63 | ||||
| 2026-02-17 | 13F | D. E. Shaw & Co., Inc. | 107.193 | -6,30 | 2.397 | -38,06 | ||||
| 2026-02-17 | 13F | Dark Forest Capital Management Lp | 109.385 | 2.446 | ||||||
| 2026-02-17 | 13F | Caption Management, LLC | 8.700 | 195 | ||||||
| 2025-11-10 | 13F | MMCAP International Inc. SPC | 0 | -100,00 | 0 | -100,00 | ||||
| 2026-01-14 | 13F | ORG Partners LLC | 663 | -31,51 | 15 | -60,00 | ||||
| 2026-02-12 | 13F | Penserra Capital Management LLC | 1.137 | 0 | ||||||
| 2026-02-12 | 13F | BlackRock, Inc. | 5.833.382 | 50,66 | 130.434 | -0,36 | ||||
| 2026-02-17 | 13F | SageView Advisory Group, LLC | 250 | 6 | ||||||
| 2026-02-03 | 13F | Chesapeake Capital Corp /il/ | 0 | -100,00 | 0 | -100,00 | ||||
| 2026-02-17 | 13F | Lazard Asset Management Llc | Put | 66.000 | 1.476 | |||||
| 2025-11-14 | 13F | Manchester Capital Management LLC | 1.470 | 0,00 | 50 | 53,13 | ||||
| 2026-02-13 | 13F | Centerpoint Advisors, LLC | 1.500 | 0,00 | 0 | |||||
| 2026-02-17 | 13F | Lazard Asset Management Llc | 36.884 | 825 | ||||||
| 2026-02-17 | 13F | Lazard Asset Management Llc | Call | 50.000 | 1.118 | |||||
| 2026-02-26 | 13F/A | Banque Transatlantique SA | 0 | -100,00 | 0 | -100,00 | ||||
| 2025-11-12 | 13F | Rovida Advisors Inc. | 0 | -100,00 | 0 | -100,00 | ||||
| 2026-02-10 | 13F | Ritter Daniher Financial Advisory LLC / DE | 90 | 2 | ||||||
| 2026-02-17 | 13F | Clearline Capital LP | 180.392 | 4.034 | ||||||
| 2026-02-17 | 13F | Philosophy Capital Management LLC | 477.025 | -31,85 | 10.666 | -54,93 | ||||
| 2026-02-06 | 13F | Harvest Portfolios Group Inc. | 174.300 | 6,01 | 3.902 | -29,82 | ||||
| 2026-02-13 | 13F | Itau Unibanco Holding S.A. | 2.186 | 49 | ||||||
| 2026-02-17 | 13F | Twinbeech Capital Lp | 188.768 | 4.221 | ||||||
| 2026-02-17 | 13F | Parallax Volatility Advisers, L.P. | 0 | -100,00 | 0 | -100,00 | ||||
| 2026-02-11 | 13F | Simplex Trading, Llc | 0 | -100,00 | 0 | -100,00 | ||||
| 2026-01-28 | 13F | Key Client Fiduciary Advisors, LLC | Put | 0 | -100,00 | 0 | -100,00 | |||
| 2026-02-17 | 13F | Brevan Howard Capital Management LP | 9.721 | 220 | ||||||
| 2026-01-26 | 13F | KBC Group NV | 5.347 | 0,00 | 0 | |||||
| 2026-02-10 | 13F | CIBC World Markets Inc. | 22.019 | -13,72 | 492 | -42,92 | ||||
| 2026-02-17 | 13F | Engineers Gate Manager LP | 20.524 | 459 | ||||||
| 2026-02-10 | 13F | KERR FINANCIAL PLANNING Corp | 14 | -6,67 | 0 | |||||
| 2026-02-13 | 13F | Landscape Capital Management, L.l.c. | 0 | -100,00 | 0 | |||||
| 2026-02-09 | 13F | Geode Capital Management, Llc | 2.433.242 | 12,99 | 54.424 | -25,28 | ||||
| 2026-02-13 | 13F | First Trust Advisors Lp | 500.370 | -2,97 | 11.188 | -35,83 | ||||
| 2026-04-09 | 13F | PFS Partners, LLC | 374 | 0,00 | 7 | -25,00 | ||||
| 2026-02-04 | 13F | Swiss Life Asset Management Ltd | 16.008 | 136,98 | 358 | 56,58 | ||||
| 2026-02-17 | 13F/A | BlueCrest Capital Management Ltd | 0 | -100,00 | 0 | -100,00 | ||||
| 2026-02-11 | 13F | Jessup Wealth Management, Inc | 108 | 2 | ||||||
| 2026-01-21 | 13F | Newbridge Financial Services Group, Inc. | 1.050 | 23 | ||||||
| 2026-02-13 | 13F | Clear Street Group Inc. | 1.176.854 | 3,79 | 26.314 | -31,36 | ||||
| 2026-02-10 | 13F | Cornerstone Select Advisors, LLC | 17.174 | 384 | ||||||
| 2026-02-11 | 13F | Cerity Partners LLC | 27.254 | 172,51 | 609 | 80,18 | ||||
| 2025-11-07 | 13F | HighTower Advisors, LLC | Call | 0 | -100,00 | 0 | -100,00 | |||
| 2026-02-17 | 13F | Brevan Howard Capital Management LP | Call | 0 | -100,00 | 0 | -100,00 | |||
| 2026-02-13 | 13F | Wiregrass Investment Management Llc | 11.000 | 246 | ||||||
| 2026-02-12 | 13F | Commonwealth Equity Services, Llc | 47.170 | 0,36 | 1.055 | 105.300,00 | ||||
| 2025-11-06 | 13F | Abich Financial Wealth Management LLC | 3.657 | 124 | ||||||
| 2026-02-12 | 13F | Groupe la Francaise | 0 | -100,00 | 0 | -100,00 | ||||
| 2026-02-13 | 13F | Marshall Wace, Llp | 611.923 | 13.683 | ||||||
| 2026-02-11 | 13F | Capital Research Global Investors | 18.161.998 | 406.102 | ||||||
| 2026-04-27 | 13F | Qrg Capital Management, Inc. | 13.200 | 244 | ||||||
| 2026-02-13 | 13F | American Century Companies Inc | 681.381 | 316,25 | 15.236 | 175,30 | ||||
| 2026-02-13 | 13F | Manufacturers Life Insurance Company, The | 0 | -100,00 | 0 | -100,00 | ||||
| 2026-02-17 | 13F | Concentric Capital Strategies, LP | 55.330 | -79,49 | 1.237 | -86,44 | ||||
| 2025-11-13 | 13F | MYDA Advisors LLC | 0 | -100,00 | 0 | -100,00 | ||||
| 2026-01-23 | 13F | Assetmark, Inc | 2 | -87,50 | 0 | |||||
| 2025-11-12 | 13F | Brinker Capital Investments, LLC | 0 | -100,00 | 0 | -100,00 | ||||
| 2026-02-17 | 13F | Polymer Capital Management (US) LLC | 18.133 | 405 | ||||||
| 2026-02-13 | 13F/A | Abound Financial, Llc | 1.067 | 24 | ||||||
| 2026-04-22 | 13F | Apollon Wealth Management, LLC | 35.154 | 649 | ||||||
| 2026-02-17 | 13F | Summit Trail Advisors, Llc | 0 | -100,00 | 0 | -100,00 | ||||
| 2026-04-03 | 13F | Global Wealth Strategies & Associates | 346 | 0,00 | 6 | -14,29 | ||||
| 2026-02-04 | 13F | Meridian Wealth Management, LLC | 14.458 | 66,99 | 323 | 10,62 | ||||
| 2025-11-13 | 13F | K2 Principal Fund, L.p. | Put | 0 | -100,00 | 0 | -100,00 | |||
| 2026-02-17 | 13F | Raymond James Financial Inc | 0 | -100,00 | 0 | |||||
| 2026-02-17 | 13F | Cetera Investment Advisers | 32.963 | 2,30 | 737 | -32,32 | ||||
| 2026-01-30 | 13F | State of New Jersey Common Pension Fund D | 84.318 | -5,30 | 1.885 | -37,38 | ||||
| 2026-02-13 | 13F | Transamerica Financial Advisors, Inc. | 12 | 0 | ||||||
| 2026-04-16 | 13F | BI Asset Management Fondsmaeglerselskab A/S | 0 | -100,00 | 0 | |||||
| 2026-02-11 | 13F | BIT Capital GmbH | Call | 775.000 | 17.329 | |||||
| 2026-02-11 | 13F | BIT Capital GmbH | 235.812 | -26,67 | 5.273 | -51,51 | ||||
| 2026-02-17 | 13F | Scientech Research LLC | 11.007 | 246 | ||||||
| 2026-02-17 | 13F | Cresset Asset Management, LLC | 0 | -100,00 | 0 | -100,00 | ||||
| 2026-02-17 | 13F | Credit Agricole S A | 0 | -100,00 | 0 | -100,00 | ||||
| 2026-04-17 | 13F | Bell Investment Advisors, Inc | 23 | 0 | ||||||
| 2026-02-13 | 13F | OMERS ADMINISTRATION Corp | 21.200 | 42,28 | 474 | -5,95 | ||||
| 2026-04-17 | 13F | Ambassador Advisors, LLC | 58.517 | 7,13 | 1.080 | -11,63 | ||||
| 2026-02-13 | 13F | State Street Corp | 1.840.778 | 30,22 | 41.160 | -13,88 | ||||
| 2025-11-12 | 13F | Catalyst Funds Management Pty Ltd | 0 | -100,00 | 0 | -100,00 | ||||
| 2026-02-17 | 13F | Arrington Capital Management, LLC | Call | 10.000 | 224 | |||||
| 2026-02-18 | 13F | Vident Advisory, LLC | 134.369 | 5,03 | 3.007 | -30,51 | ||||
| 2026-01-29 | 13F | Concurrent Investment Advisors, LLC | 14.453 | -12,24 | 323 | -41,91 | ||||
| 2026-01-30 | 13F | Us Bancorp \de\ | 249 | 6 | ||||||
| 2026-02-13 | 13F | Arrowstreet Capital, Limited Partnership | 872.181 | 845,14 | 19.509 | 525,26 | ||||
| 2026-02-11 | 13F | Primecap Management Co/ca/ | 290.700 | 0,00 | 6.500 | -33,86 | ||||
| 2026-02-12 | 13F | Renaissance Technologies Llc | 176.721 | 3.951 | ||||||
| 2026-01-15 | 13F | Allspring Global Investments Holdings, LLC | 40.611 | -78,66 | 908 | -85,88 | ||||
| 2026-02-06 | 13F | Global Retirement Partners, LLC | 33.095 | 1.651,06 | 740 | 1.074,60 | ||||
| 2026-02-17 | 13F | Cantor Fitzgerald, L. P. | 23.000 | 514 | ||||||
| 2026-04-17 | 13F | Roxbury Financial LLC | 1.042 | 19 | ||||||
| 2026-02-12 | 13F | Ci Investments Inc. | 0 | -100,00 | 0 | |||||
| 2026-02-11 | 13F | Situational Awareness LP | 0 | -100,00 | 0 | -100,00 | ||||
| 2026-02-02 | 13F | Danske Bank A/s | 1.600 | 36 | ||||||
| 2026-02-05 | 13F | Blume Capital Management, Inc. | 400 | 9 | ||||||
| 2026-02-10 | 13F | Bnp Paribas Arbitrage, Sa | 500 | 150,00 | 11 | 83,33 | ||||
| 2026-02-05 | 13F | Cambridge Investment Research Advisors, Inc. | 9.603 | 0 | ||||||
| 2026-02-17 | 13F | Ghisallo Capital Management LLC | 500.000 | 0,00 | 11.180 | -33,87 | ||||
| 2025-11-14 | 13F | Sculptor Capital LP | 0 | -100,00 | 0 | -100,00 | ||||
| 2026-02-05 | 13F | Phoenix Holdings Ltd. | 0 | -100,00 | 0 | |||||
| 2026-02-17 | 13F | Tudor Investment Corp Et Al | Put | 37.800 | 845 | |||||
| 2026-02-17 | 13F | Bank Of America Corp /de/ | 240.405 | -36,42 | 5.375 | -57,96 | ||||
| 2026-02-17 | 13F | Tudor Investment Corp Et Al | 116.470 | 687,54 | 2.604 | 420,80 | ||||
| 2026-02-17 | 13F | Freestone Grove Partners LP | 500.000 | 11,11 | 11.180 | -26,52 | ||||
| 2026-02-11 | 13F | Two Seas Capital LP | 0 | -100,00 | 0 | -100,00 | ||||
| 2026-04-23 | 13F | SJS Investment Consulting Inc. | 3.700 | 0,00 | 68 | -17,07 | ||||
| 2026-01-29 | 13F | Facet Wealth, Inc. | 20.039 | 639 | ||||||
| 2026-02-17 | 13F | Trexquant Investment LP | 489.466 | 10.944 | ||||||
| 2026-04-06 | 13F | GAMMA Investing LLC | 42 | 250,00 | 1 | |||||
| 2026-02-17 | 13F | Graham Capital Management, L.P. | 12.715 | 284 | ||||||
| 2026-04-02 | 13F | Aspect Partners, LLC | 220 | 5,26 | 4 | 0,00 | ||||
| 2026-02-11 | 13F | Jpmorgan Chase & Co | 272.212 | 37.498,34 | 6.087 | 25.258,33 | ||||
| 2026-02-13 | 13F | Toroso Investments, LLC | 2.623.873 | 1,32 | 58.670 | -32,99 | ||||
| 2026-02-17 | 13F | Northern Trust Corp | 561.483 | 43,10 | 12.555 | -5,36 | ||||
| 2026-02-13 | 13F | Wells Fargo & Company/mn | Put | 2.423.000 | 73,07 | 54.178 | 14,46 | |||
| 2026-02-17 | 13F | Point72 Asset Management, L.P. | Put | 130.200 | 2.911 | |||||
| 2026-02-17 | 13F | Elequin Capital Lp | 418 | 9 | ||||||
| 2026-02-12 | 13F | Grey Fox Wealth Advisors, LLC | 0 | -100,00 | 0 | |||||
| 2026-02-17 | 13F | Point72 Asset Management, L.P. | Call | 28.200 | 631 | |||||
| 2026-02-13 | 13F | Toroso Investments, LLC | Put | 313.100 | -92,49 | 7.001 | -95,03 | |||
| 2026-02-13 | 13F | Toroso Investments, LLC | Call | 206.000 | 4.606 | |||||
| 2026-04-23 | 13F | North Star Investment Management Corp. | 0 | -100,00 | 0 | |||||
| 2026-02-17 | 13F | Burkehill Global Management, LP | 0 | -100,00 | 0 | |||||
| 2026-02-17 | 13F | Metavasi Capital LP | 0 | -100,00 | 0 | -100,00 | ||||
| 2026-02-17 | 13F | Aqr Capital Management Llc | 23.353 | 522 | ||||||
| 2026-02-13 | 13F | Neuberger Berman Group LLC | 81.913 | 1.832 | ||||||
| 2026-02-17 | 13F | Philadelphia Financial Management of San Francisco, LLC | Put | 0 | -100,00 | 0 | -100,00 | |||
| 2026-04-20 | 13F | Ronald Blue Trust, Inc. | 468 | 1.362,50 | 9 | |||||
| 2026-02-10 | 13F | CIBC Asset Management Inc | 0 | -100,00 | 0 | |||||
| 2026-04-27 | 13F | Truist Financial Corp | 11.007 | 15,50 | 203 | -4,69 | ||||
| 2026-02-17 | 13F | LMR Partners LLP | Call | 83.500 | 1.867 | |||||
| 2026-01-27 | 13F | Belpointe Asset Management LLC | 11.847 | -13,15 | 265 | -42,73 | ||||
| 2026-02-10 | 13F | Envestnet Asset Management Inc | 14.655 | 4,11 | 328 | -31,16 | ||||
| 2025-11-13 | 13F | Acadian Asset Management Llc | 0 | -100,00 | 0 | |||||
| 2026-02-17 | 13F | Fred Alger Management, Llc | 1.165.251 | 572,06 | 26.055 | 344,47 | ||||
| 2026-02-17 | 13F | SIG North Trading, ULC | 0 | -100,00 | 0 | |||||
| 2026-02-11 | 13F | Cookson Peirce & Co Inc | 10.000 | 224 | ||||||
| 2026-04-27 | 13F | Sound Income Strategies, LLC | 5.213 | 0,00 | 91 | -49,44 | ||||
| 2026-04-16 | 13F | SG Americas Securities, LLC | 451.875 | 78,92 | 6 | 20,00 | ||||
| 2026-02-17 | 13F | Price T Rowe Associates Inc /md/ | 3.481.577 | -56,06 | 78 | -71,16 | ||||
| 2026-04-24 | 13F | Private Advisor Group, LLC | 10.108 | 6,93 | 186 | -11,85 | ||||
| 2026-02-13 | 13F | Morgan Stanley | 2.390.599 | -2,17 | 53.454 | -35,30 | ||||
| 2026-02-17 | 13F | Aster Capital Management (DIFC) Ltd | 0 | -100,00 | 0 | |||||
| 2026-02-03 | 13F | Mitsubishi UFJ Kokusai Asset Management Co., Ltd. | 7.157 | 177 | ||||||
| 2026-02-13 | 13F | FirstWave Capital Management LLC | 44.102 | 986 | ||||||
| 2026-02-13 | 13F | Sei Investments Co | 38.895 | 337,56 | 870 | 189,67 | ||||
| 2026-02-13 | 13F | Wells Fargo & Company/mn | 2.512.391 | 69,71 | 56.177 | 12,24 | ||||
| 2026-02-12 | 13F | Wealthspire Advisors, LLC | 0 | -100,00 | 0 | -100,00 | ||||
| 2026-02-13 | 13F | Mariner, LLC | 9.696 | 217 | ||||||
| 2026-02-17 | 13F | Signature Equity Partners, LLC | 6 | 0 | ||||||
| 2025-11-13 | 13F | Capital World Investors | 0 | -100,00 | 0 | -100,00 | ||||
| 2026-02-17 | 13F | Two Sigma Investments, Lp | 786.889 | 17.595 | ||||||
| 2026-02-09 | 13F | Jefferies Financial Group Inc. | 16.463 | 39,42 | 368 | -7,77 | ||||
| 2026-02-02 | 13F | Wolverine Asset Management Llc | Put | 25.100 | 25.000,00 | 561 | 18.600,00 | |||
| 2026-02-12 | 13F | Hollencrest Capital Management | 850 | 0,00 | 19 | -32,14 | ||||
| 2026-02-17 | 13F | Man Group plc | 171.066 | -85,00 | 3.825 | -90,08 | ||||
| 2026-02-09 | 13F | Jefferies Financial Group Inc. | Call | 50.000 | 1.118 | |||||
| 2026-02-12 | 13F | Walled Lake Planning & Wealth Management, Llc | 11.108 | 0,00 | 248 | -33,87 | ||||
| 2026-02-17 | 13F | BlueCrest Capital Management Ltd | Put | 10.000 | 224 | |||||
| 2026-02-13 | 13F | Verition Fund Management LLC | 0 | -100,00 | 0 | -100,00 | ||||
| 2026-02-11 | 13F | Group One Trading, L.p. | 240.114 | 104,52 | 5.369 | 35,25 | ||||
| 2026-02-09 | 13F | Legal & General Group Plc | 153.285 | -5,25 | 3.427 | -37,34 | ||||
| 2026-04-09 | 13F | TrueWealth Advisors, LLC | 0 | -100,00 | 0 | |||||
| 2026-04-14 | 13F | Prospera Financial Services Inc | 13.249 | -2,63 | 244 | -19,74 | ||||
| 2026-02-13 | 13F | Van Eck Associates Corp | 1.590.776 | 12,69 | 36 | -25,53 | ||||
| 2026-01-30 | 13F | Exencial Wealth Advisors, Llc | 14.137 | 316 | ||||||
| 2026-02-06 | 13F | HighTower Advisors, LLC | 42.399 | -24,57 | 948 | -50,11 | ||||
| 2026-02-13 | 13F | Hudson Bay Capital Management LP | 13.740 | 307 | ||||||
| 2026-02-10 | 13F/A | Northwestern Mutual Wealth Management Co | 2.050 | 46 | ||||||
| 2026-02-09 | 13F | Harbour Investments, Inc. | 3.799 | 12.563,33 | 85 | 8.300,00 | ||||
| 2026-04-07 | 13F | Retirement Wealth Solutions LLC | 26 | 333,33 | 0 | |||||
| 2026-04-10 | 13F | TCP Asset Management, LLC | 10.744 | 0,00 | 198 | -17,50 | ||||
| 2025-11-14 | 13F | ExodusPoint Capital Management, LP | 0 | -100,00 | 0 | -100,00 | ||||
| 2026-04-13 | 13F | Creative Financial Designs Inc /adv | 1.100 | -66,15 | 20 | -72,22 | ||||
| 2026-04-17 | 13F | AdvisorNet Financial, Inc | 2.676 | -3,91 | 49 | -20,97 | ||||
| 2026-02-17 | 13F | Algert Global Llc | 43.020 | 1 | ||||||
| 2026-04-13 | 13F | IFP Advisors, Inc | 5.541 | -47,01 | 102 | -56,22 | ||||
| 2026-02-17 | 13F | G2 Investment Partners Management LLC | 92.900 | -20,26 | 2.077 | -47,26 | ||||
| 2026-02-17 | 13F | XTX Topco Ltd | 0 | -100,00 | 0 | -100,00 | ||||
| 2026-01-22 | 13F | Harwood Advisory Group, LLC | 376 | 0,00 | 8 | -33,33 | ||||
| 2026-02-13 | 13F | Ubs Asset Management Americas Inc | 287.936 | 12,43 | 6.438 | -25,64 | ||||
| 2025-11-17 | 13F | Sender Co & Partners, Inc. | 0 | -100,00 | 0 | -100,00 | ||||
| 2026-02-13 | 13F | Natixis | 35.421 | 182,55 | 814 | 91,08 | ||||
| 2026-02-17 | 13F | DV Trading LLC | 7 | 0 | ||||||
| 2026-02-06 | 13F | EverSource Wealth Advisors, LLC | 5.342 | 0,85 | 119 | -33,52 | ||||
| 2026-04-22 | 13F | Advocate Investing Services LLC | 490 | 9 | ||||||
| 2026-02-13 | 13F | Formula Growth Ltd | 94.772 | -31,91 | 2.119 | -54,97 | ||||
| 2026-02-03 | 13F | Milestone Asset Management Group, LLC | 278.235 | -0,98 | 6.221 | -34,52 | ||||
| 2026-02-11 | 13F | Horizon Kinetics Asset Management Llc | 1.249.554 | -0,34 | 27.940 | -34,09 | ||||
| 2026-02-13 | 13F | Mml Investors Services, Llc | 55.586 | 1.243 | ||||||
| 2026-02-17 | 13F | Ionic Capital Management LLC | Call | 35.000 | 783 | |||||
| 2026-02-17 | 13F | Ionic Capital Management LLC | 500 | 11 | ||||||
| 2026-04-13 | 13F | Salem Investment Counselors Inc | 50 | 1 | ||||||
| 2026-01-29 | 13F | Comerica Bank | 7.474 | 661,88 | 167 | 406,06 | ||||
| 2026-02-12 | 13F | denkapparat Operations GmbH | 19.338 | 432 | ||||||
| 2025-11-04 | 13F | IMC-Chicago, LLC | 0 | -100,00 | 0 | -100,00 | ||||
| 2026-02-12 | 13F | Bank Of Montreal /can/ | Put | 300 | 7 | |||||
| 2026-02-12 | 13F | Triumph Capital Management | 48 | 1 | ||||||
| 2026-02-12 | 13F | Bank Of Montreal /can/ | 210.486 | -0,09 | 4.706 | -33,92 | ||||
| 2026-02-03 | 13F | Morse Asset Management, Inc | 2.110 | -34,67 | 47 | -56,88 | ||||
| 2026-02-13 | 13F | Quattro Advisors LLC | 336 | 8 | ||||||
| 2026-04-13 | 13F | Global X Japan Co., Ltd. | 3.672 | 68 | ||||||
| 2025-11-12 | 13F | Monashee Investment Management LLC | 0 | -100,00 | 0 | |||||
| 2026-01-29 | 13F | Concord Wealth Partners | 14 | 0,00 | 0 | |||||
| 2026-02-11 | 13F | Insight Advisors, LLC/ PA | 0 | -100,00 | 0 | |||||
| 2026-02-12 | 13F | DRW Securities, LLC | Put | 0 | -100,00 | 0 | -100,00 | |||
| 2026-04-17 | 13F | CENTRAL TRUST Co | 0 | -100,00 | 0 | |||||
| 2026-02-03 | 13F | Pilgrim Partners Asia Pte Ltd | 4.000 | 89 | ||||||
| 2026-02-17 | 13F | Capital Fund Management S.a. | Call | 135.300 | 3.025 | |||||
| 2025-11-14 | 13F | Capula Management Ltd | 0 | -100,00 | 0 | -100,00 | ||||
| 2026-02-17 | 13F | Capital Fund Management S.a. | Put | 89.200 | 1.995 | |||||
| 2026-02-12 | 13F | Swiss National Bank | 349.500 | 6,30 | 7.815 | -29,70 | ||||
| 2026-01-16 | 13F | FNY Investment Advisers, LLC | 0 | -100,00 | 0 | |||||
| 2026-02-13 | 13F | DeepCurrents Investment Group LLC | Call | 1.500 | 3.354 | |||||
| 2026-02-18 | 13F | Beacon Pointe Advisors, LLC | 30.135 | 1,52 | 674 | -32,90 | ||||
| 2026-02-17 | 13F | Captrust Financial Advisors | 11.657 | 12,58 | 261 | -25,71 | ||||
| 2026-04-24 | 13F | Root Financial Partners, LLC | 82 | 2 | ||||||
| 2026-02-13 | 13F | Charles Schwab Investment Management Inc | 1.965.028 | 25,12 | 43.952 | -17,23 | ||||
| 2026-02-17 | 13F | Susquehanna International Group, Llp | Call | 4.476.800 | -4,51 | 100.101 | -36,85 | |||
| 2026-02-17 | 13F | Susquehanna International Group, Llp | 605.246 | 66,77 | 13.533 | 10,29 | ||||
| 2026-02-17 | 13F | Susquehanna International Group, Llp | Put | 2.087.100 | -63,38 | 46.668 | -75,78 | |||
| 2026-04-08 | 13F | Wealth Enhancement Advisory Services, Llc | 33.023 | 28,91 | 629 | -5,99 | ||||
| 2026-02-27 | 13F | Strategic Investment Solutions, Inc. /IL | 2.483 | -79,62 | 56 | -86,62 | ||||
| 2026-04-08 | 13F | Wealth Enhancement Advisory Services, Llc | Call | 10.600 | 0,95 | 0 | -100,00 | |||
| 2026-02-06 | 13F | Pnc Financial Services Group, Inc. | 2.435 | 0,45 | 54 | -33,33 | ||||
| 2026-02-12 | 13F | Scotia Capital Inc. | 34.277 | 28,82 | 767 | -14,70 | ||||
| 2026-02-17 | 13F | Quadrature Capital Ltd | 362.590 | 52,42 | 8.126 | 1,04 | ||||
| 2026-01-29 | 13F | Quent Capital, LLC | 6.474 | 68,99 | 144 | 10,85 | ||||
| 2026-02-13 | 13F | AWM Investment Company, Inc. | 385.000 | -16,30 | 8.609 | -44,65 | ||||
| 2026-02-17 | 13F/A | Militia Capital Partners, LP | 0 | -100,00 | 0 | -100,00 | ||||
| 2026-02-17 | 13F | ExodusPoint Capital Management, LP | Put | 0 | -100,00 | 0 | -100,00 | |||
| 2026-02-12 | 13F | Intrinsic Edge Capital Management LLC | 32.848 | -86,48 | 734 | -91,06 | ||||
| 2026-02-17 | 13F | First Manhattan Co | 17.890 | 19,75 | 400 | -20,79 | ||||
| 2026-02-12 | 13F | Marex Group plc | Call | 0 | -100,00 | 0 | -100,00 | |||
| 2026-02-17 | 13F | Boothbay Fund Management, Llc | 19.731 | -39,62 | 441 | -60,05 | ||||
| 2026-02-17 | 13F | Holocene Advisors, LP | 64.600 | 1.444 | ||||||
| 2026-02-10 | 13F | Hillsdale Investment Management Inc. | 311.400 | 6.984 | ||||||
| 2026-01-20 | 13F | Thurston, Springer, Miller, Herd & Titak, Inc. | 0 | -100,00 | 0 | -100,00 | ||||
| 2026-01-26 | 13F | Private Trust Co Na | 0 | -100,00 | 0 | -100,00 | ||||
| 2026-01-29 | 13F | Dunhill Financial, LLC | 4 | 0 | ||||||
| 2026-02-13 | 13F | Alyeska Investment Group, L.P. | 688.817 | 15.402 | ||||||
| 2026-02-13 | 13F | BNP Paribas Asset Management Holding S.A. | 2.493 | 0 | ||||||
| 2025-11-12 | 13F | CIBC Bancorp USA Inc. | 11.854 | 401 | ||||||
| 2026-02-12 | 13F | Steward Partners Investment Advisory, Llc | 4.037 | 72,74 | 90 | 13,92 | ||||
| 2026-02-13 | 13F | Vontobel Holding Ltd. | 23.979 | -6,54 | 537 | -38,18 | ||||
| 2026-02-17 | 13F | Royal Bank Of Canada | 200.516 | -31,12 | 4.483 | -54,45 | ||||
| 2026-04-17 | 13F | HHM Wealth Advisors, LLC | 3 | 0,00 | 0 | |||||
| 2026-02-13 | 13F | Jacobi Capital Management LLC | 21.100 | 0,00 | 472 | -33,94 | ||||
| 2026-04-15 | 13F | ARS Wealth Advisors Group, LLC | 0 | -100,00 | 0 | |||||
| 2026-02-17 | 13F | Agf Management Ltd | 0 | -100,00 | 0 | -100,00 | ||||
| 2026-02-17 | 13F | Millennium Management Llc | Call | 0 | -100,00 | 0 | -100,00 | |||
| 2026-04-23 | 13F | Accurate Wealth Management, LLC | 21.594 | 0,15 | 468 | -13,04 | ||||
| 2025-12-09 | 13F/A | Tudor Investment Corp Et Al | Call | 10.000 | 338 | |||||
| 2026-02-10 | 13F | Thoroughbred Financial Services, Llc | 17.577 | 0 | ||||||
| 2026-02-13 | 13F | Senator Investment Group LP | 143.639 | 0,00 | 3.219 | -33,70 | ||||
| 2026-04-08 | 13F | E Fund Management (Hong Kong) Co., Ltd. | 487 | 9 | ||||||
| 2026-02-17 | 13F | Advisor Group Holdings, Inc. | 28.659 | 161,34 | 641 | 80,28 | ||||
| 2026-02-17 | 13F | Feynman Point Asset Management LLC | 46.000 | 1.029 | ||||||
| 2026-02-17 | 13F | Advisory Services Network, LLC | 26.797 | 10,64 | 599 | -26,77 | ||||
| 2026-01-27 | 13F | Zurcher Kantonalbank (Zurich Cantonalbank) | 74.676 | 130,67 | 1.670 | 52,56 | ||||
| 2026-02-13 | 13F | Arkadios Wealth Advisors | 0 | -100,00 | 0 | -100,00 | ||||
| 2026-02-13 | 13F | Truvestments Capital Llc | 750 | 0,00 | 17 | -36,00 | ||||
| 2026-04-24 | 13F | Vision Financial Markets Llc | 150 | 0,00 | 3 | -33,33 | ||||
| 2026-04-22 | 13F | Pictet Asset Management Holding SA | 33.552 | -58,43 | 619 | -65,74 | ||||
| 2026-02-13 | 13F | Arkadios Wealth Advisors | Call | 0 | -100,00 | 0 | -100,00 | |||
| 2026-02-17 | 13F | Tolleson Wealth Management, Inc. | 145.000 | 0,00 | 3.242 | -33,86 | ||||
| 2026-02-12 | 13F | Voya Investment Management Llc | 183.558 | 98,07 | 4.104 | 30,99 | ||||
| 2026-02-13 | 13F | Marathon Trading Investment Management LLC | 18.800 | 420 | ||||||
| 2026-02-13 | 13F | SRS Capital Advisors, Inc. | 720 | 0,00 | 16 | -33,33 | ||||
| 2026-02-17 | 13F | Covalis (Gibraltar) Ltd | Put | 1.069.900 | 23.923 | |||||
| 2026-02-10 | 13F | Eurizon Capital SGR S.p.A. | 3.100 | 71 | ||||||
| 2026-02-17 | 13F | Vennlight Capital Management, LP | 90.073 | 6,60 | 2.014 | -29,48 | ||||
| 2026-02-11 | 13F | LPL Financial LLC | 115.965 | 145,45 | 2.593 | 62,30 | ||||
| 2026-02-17 | 13F | Parallax Volatility Advisers, L.P. | Call | 236.700 | 195,88 | 5.293 | 95,71 | |||
| 2026-02-17 | 13F | Parallax Volatility Advisers, L.P. | Put | 171.700 | 42.825,00 | 3.839 | 29.430,77 | |||
| 2026-02-17 | 13F | Banco Bilbao Vizcaya Argentaria, S.a. | 0 | -100,00 | 0 | |||||
| 2026-02-17 | 13F | Qube Research & Technologies Ltd | 1.648.723 | 36.865 | ||||||
| 2026-02-13 | 13F | Umb Bank N A/mo | 800 | -65,22 | 18 | -77,92 | ||||
| 2026-01-28 | 13F | Arizona State Retirement System | 48.960 | -2,37 | 1.095 | -35,46 | ||||
| 2026-04-07 | 13F | Farther Finance Advisors, LLC | 7.518 | 33,16 | 131 | 3,17 | ||||
| 2026-02-10 | 13F | Rovida Investment Management Ltd | 1.811.200 | -2,69 | 40.535 | -35,55 | ||||
| 2026-02-13 | 13F | Flow Traders U.s. Llc | 20.981 | 0 | ||||||
| 2026-03-16 | 13F/A | Rockefeller Capital Management L.P. | 39.481 | -15,45 | 883 | -44,11 | ||||
| 2026-02-19 | 13F | CI Private Wealth, LLC | 11.148 | 0,66 | 249 | -33,42 | ||||
| 2026-02-10 | 13F | Main Management ETF Advisors, LLC | 71.253 | 1,03 | 2 | -50,00 | ||||
| 2026-01-28 | 13F | Teacher Retirement System Of Texas | 0 | -100,00 | 0 | -100,00 | ||||
| 2026-02-10 | 13F | Bank of New York Mellon Corp | 106.834 | 175,54 | 2.389 | 82,29 | ||||
| 2026-02-17 | 13F | Jain Global LLC | 0 | -100,00 | 0 | -100,00 | ||||
| 2026-04-27 | 13F | Y-Intercept (Hong Kong) Ltd | 32.002 | 590 | ||||||
| 2026-02-13 | 13F | Caitong International Asset Management Co., Ltd | 1.434 | 183,40 | 32 | 88,24 | ||||
| 2026-02-17 | 13F | Kurv Investment Management LLC | 16.920 | 378 | ||||||
| 2026-02-13 | 13F | Walleye Trading LLC | 57.522 | 142,31 | 1.286 | 60,35 | ||||
| 2026-02-17 | 13F | Susquehanna Advisors Group, Inc. | 85.500 | 1.912 | ||||||
| 2026-01-29 | 13F | UBS Group AG | 563.102 | -8,69 | 12.591 | -39,62 | ||||
| 2026-01-20 | 13F | Sullivan Wood Capital Management LLC | 1.321.113 | 6,70 | 29.540 | -29,43 | ||||
| 2026-04-07 | 13F | CoreCap Advisors, LLC | 371 | -57,41 | 7 | -68,42 | ||||
| 2026-02-13 | 13F | Walleye Trading LLC | Put | 207.100 | 53,98 | 4.631 | 1,83 | |||
| 2026-01-22 | 13F | Bartlett & Co. Wealth Management Llc | 430 | 0,00 | 10 | -35,71 | ||||
| 2026-02-13 | 13F | Walleye Trading LLC | Call | 111.000 | -37,54 | 2.482 | -58,71 | |||
| 2026-04-24 | 13F | Redwood Wealth Management Group, LLC | 19.475 | -2,75 | 359 | -19,69 | ||||
| 2026-04-09 | 13F | Key Client Fiduciary Advisors, LLC | Call | 21.000 | -29,77 | 387 | -42,75 | |||
| 2025-11-14 | 13F | Hbk Investments L P | 0 | -100,00 | 0 | -100,00 | ||||
| 2026-02-17 | 13F | Fmr Llc | 19.914.545 | -17,02 | 445.289 | -45,12 | ||||
| 2026-02-13 | 13F | Victory Capital Management Inc | 21.693 | 10,70 | 485 | -26,74 | ||||
| 2026-04-09 | 13F | Key Client Fiduciary Advisors, LLC | 879.879 | 2,49 | 16.234 | -15,44 | ||||
| 2026-02-11 | 13F | MCF Advisors LLC | 2.224 | 0,00 | 50 | -34,67 | ||||
| 2026-04-24 | 13F | Medallion Wealth Advisors, LLC | 0 | -100,00 | 0 | -100,00 | ||||
| 2026-04-21 | 13F | Capelight Capital Asset Management LP | 205.000 | 13,89 | 3.782 | -6,01 | ||||
| 2026-02-17 | 13F | Covalis Capital Llp | Put | 2.630.100 | 58.809 | |||||
| 2026-02-18 | 13F | GWM Advisors LLC | 11.581 | 259 | ||||||
| 2025-11-03 | 13F | Stonegate Investment Group, LLC | 7.712 | 261 | ||||||
| 2026-02-10 | 13F | Seven Grand Managers, Llc | 1.250.000 | -37,50 | 27.950 | -58,67 | ||||
| 2026-02-17 | 13F | Corsair Capital Management, L.p. | 0 | -100,00 | 0 | -100,00 | ||||
| 2026-02-17 | 13F | Capital Fund Management S.a. | 321.090 | 756,77 | 7.180 | 466,61 | ||||
| 2026-02-17 | 13F | Weiss Asset Management LP | 353.277 | 19,06 | 7.899 | -21,26 | ||||
| 2026-02-10 | 13F | Goldman Sachs Group Inc | Call | 375.000 | 0,00 | 8.385 | -33,86 | |||
| 2026-02-10 | 13F | Goldman Sachs Group Inc | Put | 907.500 | 27,82 | 20.292 | -15,47 | |||
| 2026-02-10 | 13F | Goldman Sachs Group Inc | 736.208 | 43,22 | 16.462 | -5,29 | ||||
| 2026-04-24 | 13F | Keybank National Association/oh | 0 | -100,00 | 0 | |||||
| 2026-02-10 | 13F | Connor, Clark & Lunn Investment Management Ltd. | 0 | -100,00 | 0 | -100,00 | ||||
| 2026-02-12 | 13F | Summit Financial, LLC | 46.185 | 170,66 | 1.033 | 79,17 | ||||
| 2026-02-10 | 13F | Zweig-DiMenna Associates LLC | 0 | -100,00 | 0 | -100,00 | ||||
| 2026-02-17 | 13F | California State Teachers Retirement System | 157.406 | 5,45 | 3.520 | -30,26 | ||||
| 2026-01-07 | 13F | Harbour Capital Advisors, LLC | 14.135 | -3,35 | 350 | -39,62 | ||||
| 2026-04-16 | 13F | Polianta Ltd | 0 | -100,00 | 0 | |||||
| 2025-11-14 | 13F | Lighthouse Investment Partners, LLC | 0 | -100,00 | 0 | -100,00 | ||||
| 2026-02-12 | 13F | Federation des caisses Desjardins du Quebec | 1.634 | -1,92 | 37 | -35,71 | ||||
| 2026-04-09 | 13F | DHJJ Financial Advisors, Ltd. | 1.550 | 0,00 | 29 | -17,65 | ||||
| 2026-02-17 | 13F | Two Sigma Advisers, Lp | 200.250 | 2.467,31 | 4.478 | 1.602,28 | ||||
| 2026-04-27 | 13F | Leonteq Securities AG | 7.984 | -3,61 | 147 | -35,24 | ||||
| 2026-02-17 | 13F | Tower Research Capital LLC (TRC) | 555 | -67,68 | 12 | -79,31 | ||||
| 2026-04-09 | 13F | Whitaker-Myers Wealth Managers, LTD. | 0 | -100,00 | 0 | |||||
| 2026-02-12 | 13F | Dimensional Fund Advisors Lp | 52.879 | 1,28 | 1.182 | -33,03 | ||||
| 2026-01-28 | 13F | Klp Kapitalforvaltning As | 37.800 | 6,78 | 845 | -29,35 | ||||
| 2026-02-13 | 13F | Baird Financial Group, Inc. | 0 | -100,00 | 0 | -100,00 | ||||
| 2026-01-29 | 13F | Sanctuary Advisors, LLC | 14.235 | -10,36 | 318 | -40,67 | ||||
| 2026-02-17 | 13F | Janus Henderson Group Plc | 73.681 | 0,00 | 1.650 | -33,78 | ||||
| 2026-04-14 | 13F | Bayshore Capital Advisors, LLC | 156.705 | 0,00 | 2.891 | -17,47 | ||||
| 2026-02-17 | 13F | Value Aligned Research Advisors, LLC | 1.061.151 | 23.727 | ||||||
| 2026-02-13 | 13F | National Bank Of Canada /fi/ | 103.910 | -40,73 | 3.180 | -58,15 | ||||
| 2026-02-17 | 13F | Nomura Holdings Inc | Call | 76.200 | 1.704 | |||||
| 2026-02-17 | 13F | Nomura Holdings Inc | Put | 124.000 | 24,00 | 2.773 | -18,01 | |||
| 2026-02-13 | 13F | Lord, Abbett & Co. Llc | Call | 97.500 | 0,00 | 0 | ||||
| 2026-01-27 | 13F | TD Waterhouse Canada Inc. | 1.918 | 5,97 | 43 | -34,37 | ||||
| 2026-02-13 | 13F | Centiva Capital, LP | Call | 413.600 | 9.248 | |||||
| 2026-02-17 | 13F | Nomura Holdings Inc | 135.623 | -43,55 | 3.033 | -62,67 | ||||
| 2026-02-03 | 13F | Sequoia Financial Advisors, LLC | 10.543 | -3,80 | 236 | -36,49 | ||||
| 2026-04-07 | 13F | GK Wealth Management LLC | 0 | -100,00 | 0 | |||||
| 2026-02-13 | 13F | Integrated Wealth Concepts LLC | 0 | -100,00 | 0 | -100,00 | ||||
| 2026-02-17 | 13F | MIRAE ASSET GLOBAL ETFS HOLDINGS Ltd. | 859.499 | 52,14 | 19.269 | 0,82 | ||||
| 2026-02-13 | 13F | Bullseye Asset Management LLC | 15.000 | 0,00 | 0 | |||||
| 2026-04-15 | 13F | Exchange Traded Concepts, Llc | 592.901 | 10.939 | ||||||
| 2026-04-22 | 13F | Louisbourg Investments Inc. | 50 | 0,00 | 1 | -100,00 | ||||
| 2026-02-06 | 13F | Larson Financial Group LLC | 1.137 | 13,70 | 25 | -24,24 | ||||
| 2026-02-11 | 13F | Deutsche Bank Ag\ | 18.899 | 143,29 | 423 | 61,07 | ||||
| 2026-02-13 | 13F | MAI Capital Management | 4.130 | 3,12 | 92 | -31,85 | ||||
| 2026-02-17 | 13F | Cinctive Capital Management LP | 0 | -100,00 | 0 | |||||
| 2025-11-14 | 13F | Wolverine Trading, Llc | Call | 584.700 | 382,03 | 20.049 | 727,79 | |||
| 2026-02-13 | 13F | Kestra Advisory Services, LLC | 4.184 | 94 | ||||||
| 2026-02-17 | 13F | Voloridge Investment Management, Llc | 66.120 | 1.478 | ||||||
| 2025-11-14 | 13F | Wolverine Trading, Llc | Put | 183.900 | 243,10 | 6.306 | 489,25 | |||
| 2026-04-06 | 13F | CX Institutional | 8.315 | 27,32 | 0 | |||||
| 2026-02-19 | 13F | Mcguire Capital Advisors Inc | 6.875 | 154 | ||||||
| 2026-02-17 | 13F | Discovery Capital Management, Llc / Ct | 100.000 | 2.236 | ||||||
| 2026-04-17 | 13F | Cidel Asset Management Inc | 25.011 | 0,00 | 461 | -17,53 | ||||
| 2026-04-07 | 13F | Signaturefd, Llc | 12.000 | 221 | ||||||
| 2026-02-10 | 13F | Thames Capital Management Llc | 0 | -100,00 | 0 | -100,00 | ||||
| 2026-02-17 | 13F | Schonfeld Strategic Advisors LLC | 20.205 | 452 | ||||||
| 2026-02-17 | 13F | Balyasny Asset Management Llc | 535.661 | -35,41 | 11.977 | -57,28 | ||||
| 2025-11-14 | 13F | Wolverine Trading, Llc | 15.729 | -31,13 | 539 | 18,20 | ||||
| 2026-02-12 | 13F | CIBC Private Wealth Group, LLC | 3.004 | -76,89 | 67 | -84,74 | ||||
| 2026-01-27 | 13F | PFG Advisors | 12.935 | 289 | ||||||
| 2026-02-12 | 13F | Marex Group plc | 72.844 | 31,63 | 1.629 | -12,99 | ||||
| 2026-02-17 | 13F | Moore Capital Management, Lp | 1.362.250 | 0,00 | 30.511 | -33,77 | ||||
| 2026-02-05 | 13F | Allworth Financial LP | 649 | 15 | ||||||
| 2026-02-17 | 13F | Millennium Management Llc | 1.152.462 | 1.027,09 | 25.769 | 645,42 | ||||
| 2026-02-18 | 13F | VGI Partners Ltd | 0 | -100,00 | 0 | |||||
| 2026-04-15 | 13F | Signature Estate & Investment Advisors Llc | 25.739 | 0,33 | 475 | -17,28 | ||||
| 2026-02-17 | 13F | State Of Wisconsin Investment Board | 106.213 | -6,71 | 2.375 | -38,32 | ||||
| 2026-02-13 | 13F | Walleye Capital LLC | Call | 62.600 | -61,95 | 1.400 | -74,84 | |||
| 2026-02-13 | 13F | Walleye Capital LLC | Put | 60.300 | -40,71 | 1.348 | -60,79 | |||
| 2026-02-17 | 13F | Ameriprise Financial Inc | 684.663 | 729,98 | 15.309 | 448,91 | ||||
| 2026-02-13 | 13F | Walleye Capital LLC | 68.586 | 36,30 | 1.534 | -9,88 |