Grundlæggende statistik
| Institutionelle aktier (lange) | 55.758.390 - 113,66% (ex 13D/G) - change of -15,44MM shares -21,68% MRQ |
| Institutionel værdi (lang) | $ 3.364.568 USD ($1000) |
Institutionelt ejerskab og aktionærer
Freshpet, Inc. (US:FRPT) har 350 institutionelle ejere og aktionærer, der har indsendt 13D/G- eller 13F-formularer til Securities Exchange Commission (SEC). Disse institutioner har i alt 55,758,390 aktier. Største aktionærer omfatter BlackRock, Inc., Vanguard Group Inc, Wasatch Advisors Inc, Wellington Management Group Llp, William Blair Investment Management, Llc, Capital World Investors, Bank Of Montreal /can/, State Street Corp, Armistice Capital, Llc, and Alyeska Investment Group, L.P. .
Freshpet, Inc. (NasdaqGM:FRPT) institutionel ejerskabsstruktur viser aktuelle positioner i virksomheden efter institutioner og fonde, samt seneste ændringer i positionsstørrelse. Større aktionærer kan omfatte individuelle investorer, investeringsforeninger, hedgefonde eller institutioner. Skema 13D angiver, at investoren besidder (eller besidder) mere end 5 % af virksomheden og har til hensigt (eller har til hensigt at) aktivt at forfølge en ændring i forretningsstrategi. Skema 13G indikerer en passiv investering på over 5%.
The share price as of April 20, 2026 is 68,12 / share. Previously, on April 21, 2025, the share price was 73,26 / share. This represents a decline of 7,02% over that period.

Fondens stemningsscore
Fund Sentiment Score (fka Ownership Accumulation Score) finder de aktier, der bliver mest købt af fonde. Det er resultatet af en sofistikeret, multi-faktor kvantitativ model, der identificerer virksomheder med de højeste niveauer af institutionel akkumulering. Scoringsmodellen bruger en kombination af den samlede stigning i oplyste ejere, ændringerne i porteføljeallokeringer i disse ejere og andre målinger. Tallet går fra 0 til 100, hvor højere tal indikerer et højere niveau af akkumulering for sine jævnaldrende, og 50 er gennemsnittet.
Opdateringsfrekvens: Dagligt
Se Ownership Explorer, som giver en liste over højest rangerende virksomheder.
AI+ Ask Fintel’s AI assistant about Freshpet, Inc..
Select a question to share a public post with an AI-crafted answer.
Thinking of good questions…
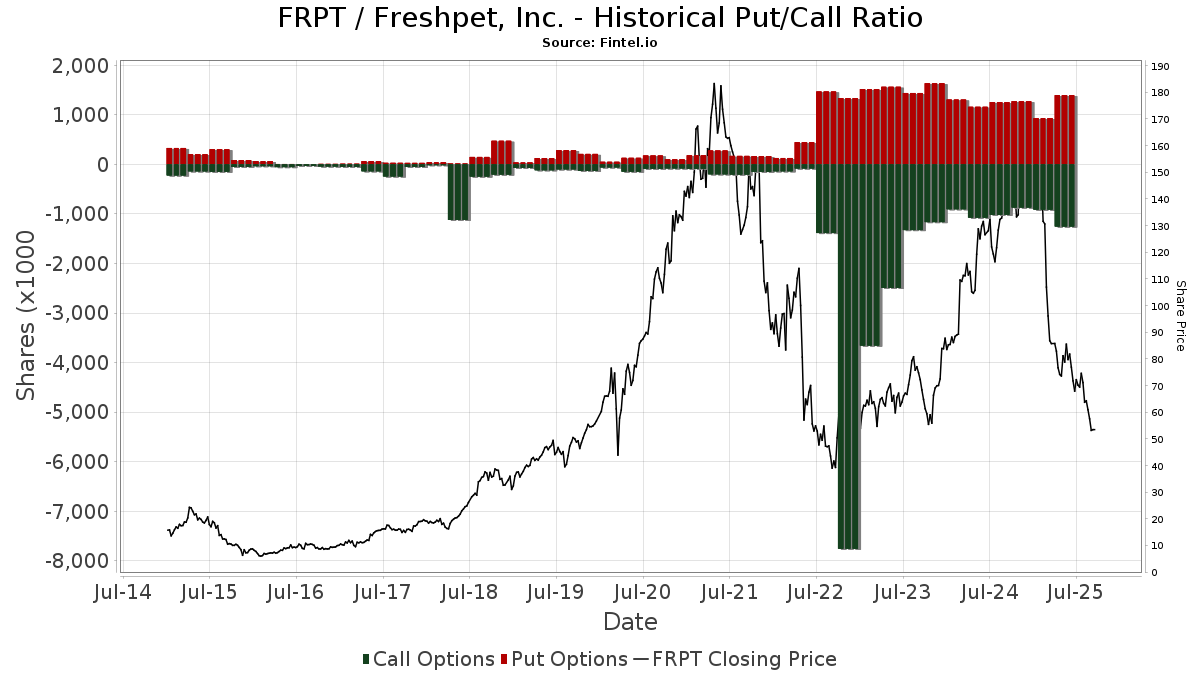
Institutionel Put/Call-forhold
Ud over at indberette standardaktie- og gældsudstedelser skal institutter med mere end 100 mill. aktiver under forvaltning også oplyse deres put- og call-optionsbeholdninger. Da salgsoptioner generelt indikerer negativ stemning, og købsoptioner indikerer positiv stemning, kan vi få en fornemmelse af den overordnede institutionelle stemning ved at plotte forholdet mellem put og kald. Diagrammet til højre viser det historiske put/call-forhold for dette instrument.
Brug af Put/Call Ratio som en indikator for investorernes stemning overvinder en af de vigtigste mangler ved at bruge totalt institutionelt ejerskab, som er, at en betydelig mængde af aktiver under forvaltning investeres passivt for at spore indekser. Passivt forvaltede fonde køber typisk ikke optioner, så indikatoren for put/call-forholdet følger mere nøje følelsen af aktivt forvaltede fonde.
13D/G-arkivering
Vi præsenterer 13D/G ansøgninger separat fra 13F ansøgninger på grund af den forskellige behandling af SEC. 13D/G-ansøgninger kan indgives af grupper af investorer (med én ledende), hvorimod 13F-ansøgninger ikke kan. Dette resulterer i situationer, hvor en investor kan indsende en 13D/G, der rapporterer én værdi for de samlede aktier (der repræsenterer alle de aktier, der ejes af investorgruppen), men derefter indsender en 13F, der rapporterer en anden værdi for de samlede aktier (der udelukkende repræsenterer deres egne) ejendomsret). Det betyder, at aktieejerskab af 13D/G-arkiver og 13F-arkiveringer ofte ikke er direkte sammenlignelige, så vi præsenterer dem separat.
Bemærk: Fra den 16. maj 2021 viser vi ikke længere ejere, der ikke har indsendt en 13D/G inden for det seneste år. Tidligere viste vi den fulde historie af 13D/G-arkiver. Generelt skal enheder, der er forpligtet til at indgive 13D/G-ansøgninger, indgive mindst årligt, før de indsender en afsluttende ansøgning. Dog forlader fonde nogle gange positioner uden at indsende en afsluttende ansøgning (dvs. de afvikler), så visning af den fulde historie resulterede nogle gange i forvirring om det nuværende ejerskab. For at undgå forvirring viser vi nu kun 'aktuelle' ejere - det vil sige - ejere, der har anmeldt inden for det seneste år.
Upgrade to unlock premium data.
| Fil dato | Form | Investor | Forrige Aktier |
Seneste Aktier |
Δ Aktier (Procent) |
Ejendomsret (Procent) |
Δ Ejerskab (Procent) |
|
|---|---|---|---|---|---|---|---|---|
| 2026-03-26 | VANGUARD GROUP INC | 5,223,695 | 0 | -100.00 | 0.00 | -100.00 | ||
| 2026-02-12 | BANK OF MONTREAL /CAN/ | 2,555,965 | 5.23 | |||||
| 2026-02-12 | Champlain Investment Partners, LLC | 2,568,954 | 1,776,396 | -30.85 | 3.60 | -32.08 | ||
| 2025-11-12 | WELLINGTON MANAGEMENT GROUP LLP | 2,527,486 | 2,296,843 | -9.13 | 4.70 | -9.79 | ||
| 2025-08-14 | WASATCH ADVISORS INC | 2,723,115 | 3,839,332 | 40.99 | 7.90 | 41.07 | ||
| 2025-08-12 | WCM INVESTMENT MANAGEMENT, LLC | 2,771,377 | 0 | -100.00 | 0.00 | -100.00 | ||
| 2025-04-03 | BlackRock, Inc. | 2,551,904 | 5,644,972 | 121.21 | 11.60 | 118.87 |
13F og NPORT arkivering
Detaljer om 13F-arkivering er gratis. Detaljer om NP-ansøgninger kræver et premium-medlemskab. Grønne rækker angiver nye positioner. Røde rækker angiver lukkede positioner. Klik på linket ikon for at se den fulde transaktionshistorik.
Opgrader
for at låse premium-data op og eksportere til Excel ![]() .
.
| Fil dato | Kilde | Investor | Type | Gennemsnitlig pris (Øst) |
Aktier | Δ Aktier (%) |
Rapporteret Værdi ($1000) |
Δ Værdi (%) |
Port Alloc (%) |
|
|---|---|---|---|---|---|---|---|---|---|---|
| 2026-02-06 | 13F | Handelsbanken Fonder AB | 15.200 | 16,92 | 1 | |||||
| 2026-02-17 | 13F | Two Sigma Investments, Lp | 24.871 | -79,70 | 1.515 | -77,56 | ||||
| 2025-11-20 | 13F | Asset Dedication, LLC | 0 | -100,00 | 0 | |||||
| 2026-02-17 | 13F | Jones Financial Companies Lllp | 1.006 | 84,59 | 61 | 125,93 | ||||
| 2026-01-30 | 13F | NJ State Employees Deferred Compensation Plan | 0 | -100,00 | 0 | -100,00 | ||||
| 2026-02-12 | 13F | Ensign Peak Advisors, Inc | 10.256 | -45,10 | 625 | -39,36 | ||||
| 2025-11-07 | 13F | Main Street Group, LTD | 0 | -100,00 | 0 | |||||
| 2026-02-13 | 13F | Public Employees Retirement Association Of Colorado | 5.070 | 0,00 | 0 | |||||
| 2026-01-23 | 13F | Patten Group, Inc. | 7.304 | 445 | ||||||
| 2026-02-12 | 13F | Wasatch Advisors Inc | 3.937.309 | 4,30 | 239.900 | 15,31 | ||||
| 2026-02-13 | 13F | Squarepoint Ops LLC | Put | 0 | -100,00 | 0 | -100,00 | |||
| 2026-02-13 | 13F | Champlain Investment Partners, LLC | 0 | -100,00 | 0 | |||||
| 2025-11-07 | 13F | HighTower Advisors, LLC | 0 | -100,00 | 0 | -100,00 | ||||
| 2026-01-23 | 13F | Halbert Hargrove Global Advisors, Llc | 0 | -100,00 | 0 | -100,00 | ||||
| 2025-11-14 | 13F | Wolverine Trading, Llc | 11.849 | 136,84 | 621 | 81,58 | ||||
| 2025-11-14 | 13F | Wolverine Trading, Llc | Call | 33.000 | 0,92 | 1.730 | -22,67 | |||
| 2025-11-14 | 13F | Wolverine Trading, Llc | Put | 57.600 | 21,52 | 3.019 | -6,88 | |||
| 2026-02-10 | 13F | Norges Bank | 607.990 | 37.045 | ||||||
| 2025-10-22 | 13F | Commonwealth Equity Services, Llc | 0 | -100,00 | 0 | |||||
| 2026-02-17 | 13F | Maryland State Retirement & Pension System | 9.306 | 1,28 | 567 | 12,06 | ||||
| 2026-02-17 | 13F | Graham Capital Management, L.P. | 0 | -100,00 | 0 | |||||
| 2025-11-12 | 13F | Simplex Trading, Llc | 0 | -100,00 | 0 | |||||
| 2026-02-17 | 13F | Amundi | 232.430 | 39,91 | 14.162 | 60,05 | ||||
| 2026-02-13 | 13F | Charles Schwab Investment Management Inc | 354.771 | 11,63 | 21.616 | 23,41 | ||||
| 2026-02-17 | 13F | Gilder Gagnon Howe & Co Llc | 1.055.140 | -10,49 | 64.290 | -1,04 | ||||
| 2026-01-20 | 13F | American National Bank | 0 | -100,00 | 0 | |||||
| 2026-02-03 | 13F | Mitsubishi UFJ Kokusai Asset Management Co., Ltd. | 64 | 0,00 | 4 | 0,00 | ||||
| 2026-02-13 | 13F | Manufacturers Life Insurance Company, The | 0 | -100,00 | 0 | |||||
| 2026-02-11 | 13F | Fox Run Management, L.l.c. | 0 | -100,00 | 0 | |||||
| 2026-01-23 | 13F | Bellevue Asset Management, Llc | 60 | 42,86 | 4 | 50,00 | ||||
| 2026-02-17 | 13F | Armistice Capital, Llc | 1.296.000 | 4,96 | 78.965 | 16,04 | ||||
| 2026-02-17 | 13F | Royal Bank Of Canada | 67.607 | -30,90 | 4.118 | -23,61 | ||||
| 2026-02-05 | 13F | Qsemble Capital Management, LP | 5.501 | 335 | ||||||
| 2026-02-13 | 13F | Barclays Plc | Call | 0 | -100,00 | 0 | -100,00 | |||
| 2026-02-12 | 13F | Jane Street Group, Llc | 0 | -100,00 | 0 | -100,00 | ||||
| 2026-02-09 | 13F | William Blair Investment Management, Llc | 1.952.767 | 30,94 | 118.982 | 44,77 | ||||
| 2026-04-13 | 13F | Sarasin & Partners LLP | 26.850 | 3,27 | 1.583 | -0,06 | ||||
| 2026-01-30 | 13F | New York State Teachers Retirement System | 18.600 | 0,54 | 1 | 0,00 | ||||
| 2026-01-28 | 13F | Geneos Wealth Management Inc. | 0 | -100,00 | 0 | -100,00 | ||||
| 2026-02-11 | 13F | Illinois Municipal Retirement Fund | 23.627 | -11,24 | 1.440 | -1,91 | ||||
| 2026-02-12 | 13F | Colonial Trust Co / SC | 214 | 0,00 | 13 | 18,18 | ||||
| 2026-02-13 | 13F | Stifel Financial Corp | 80.544 | -0,88 | 4.908 | 9,58 | ||||
| 2025-11-13 | 13F | Dynamic Technology Lab Private Ltd | 0 | -100,00 | 0 | |||||
| 2026-02-13 | 13F | Sculptor Capital LP | Put | 0 | -100,00 | 0 | ||||
| 2026-01-28 | 13F | Universal- Beteiligungs- und Servicegesellschaft mbH | 21.498 | -33,00 | 1.310 | -25,96 | ||||
| 2026-02-18 | 13F | State of Tennessee, Treasury Department | 15.079 | -38,39 | 1.051 | -22,03 | ||||
| 2026-03-06 | 13F | Hsbc Holdings Plc | 12.407 | 757 | ||||||
| 2026-04-20 | 13F | State of Alaska, Department of Revenue | 24.094 | -3,05 | 1 | 0,00 | ||||
| 2026-01-29 | 13F | Rakuten Securities, Inc. | 1 | -85,71 | 0 | |||||
| 2026-02-12 | 13F | BlackRock, Inc. | 5.764.300 | 2,57 | 351.219 | 13,40 | ||||
| 2026-02-13 | 13F | Mariner, LLC | 12.559 | -8,83 | 763 | 0,40 | ||||
| 2026-02-17 | 13F | Advisory Services Network, LLC | 0 | -100,00 | 0 | |||||
| 2025-11-14 | 13F | Delta Global Management LP | 0 | -100,00 | 0 | |||||
| 2026-02-11 | 13F | Winton Capital Group Ltd | 55.188 | 3.363 | ||||||
| 2026-02-06 | 13F | Larson Financial Group LLC | 700 | 21,95 | 43 | 35,48 | ||||
| 2026-03-26 | 13F/A | Peak6 Llc | 0 | -100,00 | 0 | -100,00 | ||||
| 2026-02-11 | 13F | Parallel Advisors, LLC | 1.562 | 181,44 | 95 | 216,67 | ||||
| 2026-02-12 | 13F | Jane Street Group, Llc | Call | 27.400 | -30,46 | 1.669 | -23,12 | |||
| 2026-02-17 | 13F | Toronto Dominion Bank | 15.787 | 962 | ||||||
| 2025-11-07 | 13F | TimesSquare Capital Management, LLC | 0 | -100,00 | 0 | |||||
| 2026-02-12 | 13F | Jane Street Group, Llc | Put | 29.200 | 0,69 | 1.779 | 11,33 | |||
| 2026-02-11 | 13F | Inceptionr Llc | 0 | -100,00 | 0 | |||||
| 2026-02-13 | 13F | Barclays Plc | 429.121 | 3,76 | 26.146 | 14,72 | ||||
| 2025-11-14 | 13F | Integrated Wealth Concepts LLC | 0 | -100,00 | 0 | |||||
| 2026-02-11 | 13F | Janney Montgomery Scott LLC | 17.766 | 24,19 | 1 | |||||
| 2026-01-26 | 13F | Private Trust Co Na | 86 | 0,00 | 5 | 25,00 | ||||
| 2026-02-13 | 13F | Quarry LP | 212 | 13 | ||||||
| 2026-02-19 | 13F | Invesco Ltd. | 181.715 | 7,51 | 11.072 | 18,86 | ||||
| 2026-02-09 | 13F | Hantz Financial Services, Inc. | 1.436 | 291,28 | 0 | |||||
| 2026-02-13 | 13F | Divisadero Street Capital Management, LP | 0 | -100,00 | 0 | |||||
| 2025-11-14 | 13F | Eminence Capital, Lp | 0 | -100,00 | 0 | |||||
| 2025-10-30 | 13F | Envestnet Portfolio Solutions, Inc. | 0 | -100,00 | 0 | -100,00 | ||||
| 2026-02-06 | 13F | Leonteq Securities AG | 389 | -93,16 | 24 | -92,65 | ||||
| 2025-10-27 | 13F | First Horizon Corp | 0 | -100,00 | 0 | |||||
| 2026-02-17 | 13F | D. E. Shaw & Co., Inc. | Call | 37.000 | -63,51 | 2.254 | -59,66 | |||
| 2026-02-17 | 13F | D. E. Shaw & Co., Inc. | Put | 210.900 | -32,36 | 12.850 | -25,22 | |||
| 2025-11-14 | 13F | Point72 Asia (Singapore) Pte. Ltd. | 1.940 | 107 | ||||||
| 2026-04-17 | 13F | IFC & Insurance Marketing, Inc. | 0 | -100,00 | 0 | |||||
| 2026-02-13 | 13F | Citigroup Inc | 416.757 | 51,94 | 25.393 | 67,99 | ||||
| 2026-02-17 | 13F | Voleon Capital Management Lp | 7.229 | 440 | ||||||
| 2026-01-26 | 13F | KBC Group NV | 13.866 | 0,00 | 1 | |||||
| 2025-10-23 | 13F | Spire Wealth Management | 0 | -100,00 | 0 | |||||
| 2026-02-10 | 13F | Acadian Asset Management Llc | 0 | -100,00 | 0 | |||||
| 2026-02-13 | 13F | Ossiam | 0 | -100,00 | 0 | |||||
| 2026-02-06 | 13F | EverSource Wealth Advisors, LLC | 1.068 | 75,66 | 65 | 96,97 | ||||
| 2026-02-17 | 13F | Twinbeech Capital Lp | 17.010 | 1.036 | ||||||
| 2026-02-17 | 13F | Bamco Inc /ny/ | 0 | -100,00 | 0 | |||||
| 2026-02-13 | 13F | Colony Group, LLC | 33.208 | 6,00 | 2.023 | 13,14 | ||||
| 2026-02-17 | 13F | Tower Research Capital LLC (TRC) | 1.901 | 416,58 | 116 | 475,00 | ||||
| 2026-01-30 | 13F/A | M&t Bank Corp | 8.309 | 118,26 | 507 | 142,11 | ||||
| 2026-02-13 | 13F | Aigen Investment Management, Lp | 0 | -100,00 | 0 | |||||
| 2026-02-09 | 13F | Jefferies Financial Group Inc. | 0 | -100,00 | 0 | |||||
| 2026-02-17 | 13F | SageView Advisory Group, LLC | 21 | 1 | ||||||
| 2026-02-12 | 13F | Granite Investment Partners, LLC | 222.970 | 5,01 | 13.586 | 16,10 | ||||
| 2025-11-03 | 13F | AustralianSuper Pty Ltd | 0 | -100,00 | 0 | |||||
| 2026-02-13 | 13F | Great West Life Assurance Co /can/ | 42.223 | 0,00 | 3 | 0,00 | ||||
| 2026-02-10 | 13F | Meramec Financial Planners, LLC | 88 | 6 | ||||||
| 2026-02-06 | 13F | Kingdom Financial Group LLC. | 26 | 2 | ||||||
| 2026-01-26 | 13F | Cwm, Llc | 33.858 | 8,42 | 2 | 100,00 | ||||
| 2026-02-13 | 13F | Jacobs Levy Equity Management, Inc | 15.067 | -95,89 | 918 | -95,46 | ||||
| 2026-01-23 | 13F | Ami Asset Management Corp | 8.417 | 513 | ||||||
| 2026-02-05 | 13F | Elyxium Wealth, LLC | 1 | 0 | ||||||
| 2026-02-13 | 13F | JustInvest LLC | 6.152 | 52,62 | 375 | 68,47 | ||||
| 2026-01-23 | 13F | Optima Capital Llc | 9 | 1 | ||||||
| 2026-02-17 | 13F | Citadel Advisors Llc | 17.943 | 1.093 | ||||||
| 2026-04-15 | 13F | Trust Point Inc. | 6.148 | 4,08 | 362 | 0,84 | ||||
| 2026-02-03 | 13F | Pier Capital, LLC | 0 | -100,00 | 0 | |||||
| 2026-02-13 | 13F | Cynosure Management, Llc | 0 | -100,00 | 0 | -100,00 | ||||
| 2026-02-17 | 13F | Citadel Advisors Llc | Put | 235.200 | 66,22 | 14.331 | 83,77 | |||
| 2025-10-28 | 13F | Wolff Wiese Magana Llc | 0 | -100,00 | 0 | -100,00 | ||||
| 2026-02-11 | 13F | Cedar Mountain Advisors, LLC | 2 | 0 | ||||||
| 2026-02-12 | 13F | State Board Of Administration Of Florida Retirement System | 42.015 | 0,00 | 2.560 | 10,54 | ||||
| 2026-02-17 | 13F | Citadel Advisors Llc | Call | 344.600 | -1,43 | 20.996 | 8,98 | |||
| 2026-01-30 | 13F | Keybank National Association/oh | 7.204 | 439 | ||||||
| 2026-02-17 | 13F | Mercer Global Advisors Inc /adv | 9.110 | 68,55 | 555 | 86,87 | ||||
| 2026-04-17 | 13F | Riverbridge Partners Llc | 923.023 | -8,04 | 54.421 | -11,01 | ||||
| 2026-02-11 | 13F | GW&K Investment Management, LLC | 0 | -100,00 | 0 | -100,00 | ||||
| 2026-02-17 | 13F | Hbk Investments L P | Put | 4.500 | 274 | |||||
| 2025-11-07 | 13F | Wealth Alliance | 0 | -100,00 | 0 | |||||
| 2026-02-10 | 13F | Daiwa Securities Group Inc. | 10.400 | 0,00 | 1 | |||||
| 2026-04-06 | 13F | Versant Capital Management, Inc | 476 | 19,60 | 28 | 16,67 | ||||
| 2026-02-13 | 13F | American Century Companies Inc | 6.277 | 382 | ||||||
| 2026-04-07 | 13F | Park Avenue Securities Llc | 3.768 | -21,52 | 0 | |||||
| 2026-01-28 | 13F | Teacher Retirement System Of Texas | 0 | -100,00 | 0 | |||||
| 2026-02-17 | 13F | Raymond James Financial Inc | 318.684 | 457,56 | 19.417 | 516,61 | ||||
| 2026-02-17 | 13F | Hbk Investments L P | Call | 3.500 | 213 | |||||
| 2026-02-17 | 13F | Balyasny Asset Management Llc | Put | 0 | -100,00 | 0 | ||||
| 2026-02-17 | 13F | PDT Partners, LLC | 0 | -100,00 | 0 | |||||
| 2026-02-03 | 13F | Western Standard LLC | 0 | -100,00 | 0 | |||||
| 2025-11-14 | 13F | Binnacle Investments Inc | 8 | -85,71 | 0 | -100,00 | ||||
| 2026-04-15 | 13F | Merit Financial Group, LLC | 3.779 | -5,53 | 223 | -8,64 | ||||
| 2026-02-10 | 13F | State of Wyoming | 922 | -7,43 | 56 | 3,70 | ||||
| 2025-11-20 | 13F | Centaurus Financial, Inc. | 0 | -100,00 | 0 | |||||
| 2026-02-06 | 13F | ProShare Advisors LLC | 72.824 | -25,59 | 4.437 | -17,73 | ||||
| 2026-01-20 | 13F | Cromwell Holdings LLC | 10 | 1 | ||||||
| 2026-02-17 | 13F | Trexquant Investment LP | 0 | -100,00 | 0 | |||||
| 2026-02-17 | 13F | Two Sigma Investments, Lp | Put | 0 | -100,00 | 0 | ||||
| 2025-11-14 | 13F | Fred Alger Management, Llc | 0 | -100,00 | 0 | -100,00 | ||||
| 2026-02-09 | 13F | Keating Financial Advisory Services, Inc. | 15 | 1 | ||||||
| 2026-02-02 | 13F | Fifth Third Bancorp | 6.250 | 63,74 | 381 | 80,95 | ||||
| 2026-01-22 | 13F | Red Tortoise LLC | 32 | 0,00 | 2 | 0,00 | ||||
| 2026-02-17 | 13F | Advisor Group Holdings, Inc. | 4.550 | 95,28 | 277 | 119,84 | ||||
| 2026-01-30 | 13F | Jennison Associates Llc | 216.620 | 0,96 | 13.199 | 11,62 | ||||
| 2026-02-13 | 13F | Edgestream Partners, L.P. | 71.478 | 4.355 | ||||||
| 2026-02-13 | 13F | Trillium Asset Management, Llc | 35.722 | -20,03 | 2.267 | -7,88 | ||||
| 2026-02-17 | 13F | Engaged Capital LLC | 401.130 | -35,21 | 24.441 | -28,37 | ||||
| 2026-01-21 | 13F | SJS Investment Consulting Inc. | 7 | 0 | ||||||
| 2026-02-17 | 13F | D. E. Shaw & Co., Inc. | 0 | -100,00 | 0 | |||||
| 2026-01-30 | 13F | State of New Jersey Common Pension Fund D | 40.811 | 15,98 | 2.487 | 28,21 | ||||
| 2026-01-21 | 13F | Newbridge Financial Services Group, Inc. | 400 | 0,00 | 24 | 9,09 | ||||
| 2026-02-17 | 13F | Capstone Investment Advisors, Llc | 0 | -100,00 | 0 | -100,00 | ||||
| 2025-11-12 | 13F | Park Square Financial Group, LLC | 0 | -100,00 | 0 | |||||
| 2026-02-09 | 13F | Quest Partners LLC | 1.251 | 0,00 | 76 | 11,76 | ||||
| 2026-02-13 | 13F | Bridgewater Associates, LP | 16.076 | 24,39 | 980 | 37,50 | ||||
| 2026-01-30 | 13F | Mitsubishi UFJ Trust & Banking Corp | 193.584 | 107,43 | 11.795 | 129,34 | ||||
| 2026-02-14 | 13F | Rockefeller Capital Management L.P. | 1.232 | -44,08 | 75 | -38,02 | ||||
| 2026-02-17 | 13F | Creative Planning | 13.421 | 81,66 | 818 | 100,74 | ||||
| 2026-04-10 | 13F | Abound Wealth Management | 3 | 0,00 | 0 | |||||
| 2026-02-06 | 13F | Covestor Ltd | 2.623 | 38,64 | 0 | |||||
| 2026-02-13 | 13F | Transamerica Financial Advisors, Inc. | 4 | 0 | ||||||
| 2026-02-12 | 13F | Campbell & CO Investment Adviser LLC | 0 | -100,00 | 0 | |||||
| 2026-02-13 | 13F | Police & Firemen's Retirement System of New Jersey | 20.624 | -3,89 | 1.257 | 6,26 | ||||
| 2026-01-27 | 13F | Tokio Marine Asset Management Co Ltd | 8.000 | 0,00 | 487 | 10,68 | ||||
| 2026-02-17 | 13F | Two Sigma Advisers, Lp | 0 | -100,00 | 0 | |||||
| 2025-11-06 | 13F | Whipplewood Advisors, LLC | 0 | -100,00 | 0 | |||||
| 2026-02-17 | 13F | Cetera Investment Advisers | 21.345 | -5,45 | 1.301 | 4,50 | ||||
| 2026-01-30 | 13F | Us Bancorp \de\ | 7.425 | 3,59 | 452 | 14,43 | ||||
| 2026-02-11 | 13F | Los Angeles Capital Management Llc | 222 | -98,46 | 11 | -98,62 | ||||
| 2026-01-23 | 13F | TFC Financial Management | 10 | 1 | ||||||
| 2026-02-02 | 13F | Danske Bank A/s | 200 | 0,00 | 12 | 9,09 | ||||
| 2026-02-14 | 13F | Militia Capital Partners, LP | 6.600 | 402 | ||||||
| 2026-02-11 | 13F | Loup Funds, LLC | 158.792 | 9.675 | ||||||
| 2026-01-29 | 13F | Quent Capital, LLC | 1.605 | 1.554,64 | 98 | 1.840,00 | ||||
| 2026-04-17 | 13F | Bell Investment Advisors, Inc | 67 | 0,00 | 4 | -25,00 | ||||
| 2026-01-15 | 13F | Nisa Investment Advisors, Llc | 268 | -91,85 | 16 | -91,16 | ||||
| 2025-11-14 | 13F | Point72 Hong Kong Ltd | 12.676 | 699 | ||||||
| 2026-02-09 | 13F | Key FInancial Inc | 1.500 | 91 | ||||||
| 2026-02-13 | 13F | Bridgefront Capital, LLC | 0 | -100,00 | 0 | |||||
| 2026-01-23 | 13F | Assetmark, Inc | 16 | -5,88 | 1 | |||||
| 2026-02-11 | 13F | Buckingham Strategic Partners | 3.735 | -6,69 | 228 | 2,71 | ||||
| 2026-02-13 | 13F | Voya Financial Advisors, Inc. | 3.454 | 218 | ||||||
| 2026-02-02 | 13F | Oppenheimer Asset Management Inc. | 75.143 | -19,31 | 4.578 | -10,80 | ||||
| 2025-11-12 | 13F | Ci Investments Inc. | 0 | -100,00 | 0 | |||||
| 2025-11-13 | 13F | Fuller & Thaler Asset Management, Inc. | 0 | -100,00 | 0 | -100,00 | ||||
| 2026-02-13 | 13F | State Street Corp | 1.534.110 | 1,59 | 93.473 | 12,32 | ||||
| 2026-02-17 | 13F | Worldquant Millennium Advisors Llc | 16.537 | 2,28 | 1.008 | 13,02 | ||||
| 2026-02-17 | 13F | Tudor Investment Corp Et Al | Put | 28.000 | 1.706 | |||||
| 2026-01-29 | 13F | D.a. Davidson & Co. | 4.526 | 276 | ||||||
| 2026-02-04 | 13F | Versor Investments LP | 7.614 | 38,87 | 464 | 53,31 | ||||
| 2026-02-17 | 13F | Tudor Investment Corp Et Al | Call | 20.000 | 1.219 | |||||
| 2025-11-13 | 13F | VSM Wealth Advisory, LLC | 0 | -100,00 | 0 | |||||
| 2025-11-14 | 13F | Peak6 Llc | Put | 0 | -100,00 | 0 | -100,00 | |||
| 2026-01-30 | 13F | Laurel Wealth Advisors LLC | 614 | 37 | ||||||
| 2026-02-13 | 13F | Maverick Capital Ltd | 7.561 | 461 | ||||||
| 2026-02-17 | 13F | Strive Financial Group ,LLC | 1 | 0 | ||||||
| 2026-02-17 | 13F | Adage Capital Partners Gp, L.l.c. | 308.000 | -48,75 | 18.766 | -43,34 | ||||
| 2026-02-10 | 13F | Envestnet Asset Management Inc | 142.691 | -26,57 | 8.694 | -18,82 | ||||
| 2026-02-13 | 13F | Squarepoint Ops LLC | 132.935 | -64,63 | 8.100 | -60,90 | ||||
| 2026-01-29 | 13F | Pictet Asset Management Holding SA | 7.279 | 0,00 | 444 | 10,47 | ||||
| 2025-11-13 | 13F | Capital Research Global Investors | 0 | -100,00 | 0 | |||||
| 2026-02-13 | 13F | Squarepoint Ops LLC | Call | 17.500 | -81,66 | 1.066 | -79,72 | |||
| 2026-04-20 | 13F | Morton Brown Family Wealth, LLC | 100 | 0,00 | 6 | -16,67 | ||||
| 2026-02-12 | 13F | Renaissance Technologies Llc | 11.000 | -87,70 | 670 | -86,40 | ||||
| 2026-01-28 | 13F | B. Metzler seel. Sohn & Co. AG | 34.624 | 30,52 | 2.110 | 44,35 | ||||
| 2026-01-27 | 13F | Proffitt & Goodson Inc | 0 | -100,00 | 0 | |||||
| 2026-02-17 | 13F | Freestone Grove Partners LP | 153.639 | -26,39 | 9.361 | -18,62 | ||||
| 2025-11-14 | 13F | Nicholas Investment Partners, LP | 0 | -100,00 | 0 | |||||
| 2026-02-13 | 13F | Verition Fund Management LLC | 19.570 | -15,66 | 1.192 | -6,73 | ||||
| 2026-02-17 | 13F | JANA Partners Management, LP | 557.390 | -46,82 | 33.962 | -41,21 | ||||
| 2026-02-17 | 13F | Elequin Capital Lp | 91 | 6 | ||||||
| 2025-11-14 | 13F | Millennium Management Llc | Put | 0 | -100,00 | 0 | -100,00 | |||
| 2026-02-09 | 13F | Morningstar Investment Management LLC | 0 | -100,00 | 0 | |||||
| 2026-04-09 | 13F | Park Place Capital Corp | 571 | 0,00 | 34 | -2,94 | ||||
| 2025-11-13 | 13F | Magnetar Financial LLC | 0 | -100,00 | 0 | |||||
| 2026-02-17 | 13F | Bank Of America Corp /de/ | 891.598 | -1,86 | 54.325 | 8,51 | ||||
| 2026-02-17 | 13F | Atom Investors LP | 0 | -100,00 | 0 | |||||
| 2026-02-13 | 13F | BNP Paribas Asset Management Holding S.A. | 792 | 39,93 | 0 | |||||
| 2026-01-14 | 13F | Pallas Capital Advisors LLC | 7.134 | -12,70 | 435 | -3,56 | ||||
| 2026-02-17 | 13F | J. Goldman & Co LP | Put | 0 | -100,00 | 0 | ||||
| 2026-02-10 | 13F | Rothschild Investment Llc | 303 | 5,57 | 18 | 20,00 | ||||
| 2026-02-11 | 13F | SOUTH STATE Corp | 32 | 540,00 | 2 | |||||
| 2026-04-17 | 13F | Andina Capital Management, LLC | 6.393 | 377 | ||||||
| 2026-02-17 | 13F | Point72 Asset Management, L.P. | Call | 6.300 | 384 | |||||
| 2026-02-17 | 13F | Aqr Capital Management Llc | 1.158.967 | -3,14 | 70.413 | 9,77 | ||||
| 2026-02-12 | 13F | New York State Common Retirement Fund | 52.334 | 10,48 | 3.189 | 22,15 | ||||
| 2026-02-17 | 13F | Capitolis Liquid Global Markets LLC | 260.000 | 15.842 | ||||||
| 2026-02-10 | 13F | Bnp Paribas Arbitrage, Sa | 290.303 | -15,22 | 17.688 | -6,26 | ||||
| 2025-11-13 | 13F | Clear Street Markets Llc | 0 | -100,00 | 0 | -100,00 | ||||
| 2026-02-05 | 13F | Gabelli Funds Llc | 3.500 | 213 | ||||||
| 2026-04-03 | 13F | Adirondack Trust Co | 75 | 0,00 | 4 | 0,00 | ||||
| 2026-02-09 | 13F | Optimize Financial Inc | 10.957 | 1,44 | 668 | 12,10 | ||||
| 2026-02-17 | 13F | Northern Trust Corp | 417.627 | -0,03 | 25.446 | 10,53 | ||||
| 2025-10-29 | 13F | Defender Capital, LLC. | 0 | -100,00 | 0 | -100,00 | ||||
| 2026-02-11 | 13F | Jpmorgan Chase & Co | 691.752 | -50,38 | 42.148 | -45,14 | ||||
| 2026-04-10 | 13F | Country Trust Bank | 243.508 | 2,84 | 14.357 | -0,49 | ||||
| 2026-04-02 | 13F | Hilltop National Bank | 145 | 9 | ||||||
| 2026-02-17 | 13F | Guggenheim Capital Llc | 3.358 | -41,25 | 205 | -35,24 | ||||
| 2026-02-17 | 13F | Man Group plc | 96.715 | 461,02 | 5.893 | 520,21 | ||||
| 2026-02-06 | 13F | Global Retirement Partners, LLC | 394 | 936,84 | 24 | 1.100,00 | ||||
| 2026-02-03 | 13F | International Assets Investment Management, Llc | 134 | 8 | ||||||
| 2026-02-06 | 13F | Fortis Group Advisors, LLC | 28.259 | 1.970 | ||||||
| 2026-02-13 | 13F | Sterling Capital Management LLC | 29.203 | -0,06 | 1.779 | 10,50 | ||||
| 2026-02-17 | 13F | Susquehanna Portfolio Strategies, LLC | 162.469 | 9.899 | ||||||
| 2025-11-14 | 13F | Scientech Research LLC | 0 | -100,00 | 0 | |||||
| 2025-11-14 | 13F | Point72 Asset Management, L.P. | Put | 0 | -100,00 | 0 | -100,00 | |||
| 2025-11-13 | 13F | Wells Fargo & Company/mn | Put | 0 | -100,00 | 0 | -100,00 | |||
| 2026-02-17 | 13F | Shelton Capital Management | 9.686 | -1,49 | 590 | 9,06 | ||||
| 2026-02-13 | 13F | Wells Fargo & Company/mn | 173.585 | 43,46 | 10.577 | 58,61 | ||||
| 2026-02-13 | 13F | Wexford Capital Lp | 1.577 | 96 | ||||||
| 2026-02-02 | 13F | Horizon Investments, LLC | 7 | 0 | ||||||
| 2026-01-29 | 13F | Teachers Retirement System Of The State Of Kentucky | 12.257 | -11,65 | 1 | |||||
| 2025-11-20 | 13F/A | BRYN MAWR TRUST Co | 0 | -100,00 | 0 | -100,00 | ||||
| 2025-11-07 | 13F | CenterBook Partners LP | 0 | -100,00 | 0 | -100,00 | ||||
| 2026-02-13 | 13F | Neuberger Berman Group LLC | 0 | -100,00 | 0 | |||||
| 2025-11-17 | 13F | Kestra Investment Management, LLC | 0 | -100,00 | 0 | |||||
| 2026-04-07 | 13F | Signaturefd, Llc | 491 | -2,39 | 29 | -6,67 | ||||
| 2026-01-21 | 13F | Yousif Capital Management, Llc | 13.168 | -12,81 | 891 | 7,09 | ||||
| 2025-11-14 | 13F | IHT Wealth Management, LLC | 0 | -100,00 | 0 | |||||
| 2026-02-13 | 13F | Cornerstone Financial Management LLC | 9 | 1 | ||||||
| 2026-02-17 | 13F | Balyasny Asset Management Llc | 931.905 | 56.781 | ||||||
| 2026-02-17 | 13F | Ameriprise Financial Inc | 721.195 | -4,33 | 43.945 | 5,78 | ||||
| 2026-04-15 | 13F | Activest Wealth Management | 0 | -100,00 | 0 | |||||
| 2026-02-09 | 13F | Legal & General Group Plc | 122.951 | -4,48 | 7.491 | 5,61 | ||||
| 2026-02-13 | 13F | FORA Capital, LLC | 0 | -100,00 | 0 | |||||
| 2026-02-17 | 13F | Millennium Management Llc | 82.357 | -76,64 | 5.018 | -74,17 | ||||
| 2025-11-12 | 13F | Hager Investment Management Services, Llc | 0 | -100,00 | 0 | |||||
| 2026-02-13 | 13F | Fort Point Capital Partners LLC | 347.257 | 3,05 | 21.967 | 18,29 | ||||
| 2026-02-13 | 13F | Boston Partners | 14.971 | 912 | ||||||
| 2026-02-13 | 13F | Prudential Financial Inc | 44.683 | -2,94 | 2.687 | 5,87 | ||||
| 2026-04-16 | 13F | Diversified Trust Co | 0 | -100,00 | 0 | |||||
| 2026-02-12 | 13F | Quadrant Capital Group Llc | 2.576 | 840,15 | 157 | 940,00 | ||||
| 2026-02-11 | 13F | Deutsche Bank Ag\ | 390.707 | 11,54 | 23.806 | 23,32 | ||||
| 2026-02-13 | 13F | Treasurer of the State of North Carolina | 19.936 | -6,84 | 1 | 0,00 | ||||
| 2025-11-14 | 13F | Axa S.a. | 0 | -100,00 | 0 | |||||
| 2025-11-10 | 13F | Jfs Wealth Advisors, Llc | 0 | -100,00 | 0 | |||||
| 2026-02-05 | 13F | Thrivent Financial For Lutherans | 33.538 | -4,70 | 2 | 100,00 | ||||
| 2026-02-17 | 13F | DV Trading LLC | 2 | 0 | ||||||
| 2026-02-17 | 13F | Aster Capital Management (DIFC) Ltd | 470 | -62,40 | 29 | -58,82 | ||||
| 2025-11-14 | 13F | Skopos Labs, Inc. | 0 | -100,00 | 0 | |||||
| 2026-02-09 | 13F | CBIZ Investment Advisory Services, LLC | 41 | 2 | ||||||
| 2026-04-16 | 13F | SG Americas Securities, LLC | 45.970 | -44,29 | 3 | -60,00 | ||||
| 2026-02-11 | 13F | Havemeyer Place LP | 9.500 | 579 | ||||||
| 2026-02-13 | 13F | Rhumbline Advisers | 112.597 | 3,99 | 6.860 | 14,97 | ||||
| 2026-02-09 | 13F | Huntington National Bank | 467 | 4,94 | 28 | 16,67 | ||||
| 2026-02-13 | 13F | Victory Capital Management Inc | 7.312 | -37,14 | 446 | -30,58 | ||||
| 2026-02-13 | 13F | Motiv8 Investments LLC | 463 | 0 | ||||||
| 2026-02-10 | 13F | Commonwealth Of Pennsylvania Public School Empls Retrmt Sys | 12.083 | -2,74 | 736 | 7,60 | ||||
| 2026-02-17 | 13F | Silvercrest Asset Management Group Llc | 428.625 | 0,86 | 26.116 | 11,51 | ||||
| 2026-02-11 | 13F | Gilpin Wealth Management, Llc | 4 | 0 | ||||||
| 2026-02-12 | 13F | Swiss National Bank | 96.250 | 1,80 | 5.865 | 12,55 | ||||
| 2026-02-05 | 13F | Bessemer Group Inc | 16.363 | -4,03 | 1 | |||||
| 2026-02-06 | 13F | Bare Financial Services, Inc | 37 | 311,11 | 2 | |||||
| 2025-11-13 | 13F | Natixis Advisors, L.p. | 0 | -100,00 | 0 | |||||
| 2026-04-13 | 13F | IFP Advisors, Inc | 91 | -17,27 | 5 | -16,67 | ||||
| 2026-04-13 | 13F | True Wealth Design, LLC | 618 | -1,28 | 36 | -5,26 | ||||
| 2026-02-17 | 13F | Concentric Capital Strategies, LP | 0 | -100,00 | 0 | |||||
| 2025-11-14 | 13F | Virtu Financial LLC | 0 | -100,00 | 0 | |||||
| 2026-02-11 | 13F | Group One Trading, L.p. | Put | 18.600 | -37,79 | 1.133 | -31,21 | |||
| 2026-02-11 | 13F | Group One Trading, L.p. | Call | 5.100 | -93,74 | 311 | -93,10 | |||
| 2026-02-13 | 13F | Ubs Asset Management Americas Inc | 145.087 | 2,07 | 8.840 | 12,86 | ||||
| 2025-11-14 | 13F | Cubist Systematic Strategies, LLC | Put | 22.200 | -52,97 | 1.223 | -61,86 | |||
| 2025-11-14 | 13F | Cubist Systematic Strategies, LLC | Call | 31.100 | -18,80 | 1.714 | -34,17 | |||
| 2026-02-05 | 13F | Atria Investments Llc | 5.250 | 19,24 | 320 | 31,82 | ||||
| 2025-11-14 | 13F | Cubist Systematic Strategies, LLC | 141.695 | 7.809 | ||||||
| 2025-11-12 | 13F | Legato Capital Management LLC | 0 | -100,00 | 0 | -100,00 | ||||
| 2026-02-17 | 13F | California State Teachers Retirement System | 46.733 | 2,17 | 2.847 | 12,98 | ||||
| 2026-02-03 | 13F | Pilgrim Partners Asia Pte Ltd | 660 | -43,10 | 40 | -36,51 | ||||
| 2026-02-17 | 13F | Cresset Asset Management, LLC | 9.887 | 0,57 | 602 | 11,28 | ||||
| 2026-02-17 | 13F | Monimus Capital Management, Lp | 17.382 | 1.059 | ||||||
| 2026-02-20 | 13F | Sunbelt Securities, Inc. | 23 | 1 | ||||||
| 2025-11-13 | 13F | Portolan Capital Management, LLC | 0 | -100,00 | 0 | -100,00 | ||||
| 2026-02-13 | 13F | Mml Investors Services, Llc | 3.880 | -29,17 | 236 | -21,59 | ||||
| 2026-02-10 | 13F | Savant Capital, LLC | 0 | -100,00 | 0 | |||||
| 2026-02-17 | 13F | Capital Fund Management S.a. | Put | 47.200 | -29,76 | 2.876 | -22,36 | |||
| 2026-02-06 | 13F | Kilter Group LLC | 0 | -100,00 | 0 | |||||
| 2026-02-17 | 13F | Capital Fund Management S.a. | Call | 12.500 | -49,80 | 762 | -44,53 | |||
| 2026-02-10 | 13F/A | Northwestern Mutual Wealth Management Co | 2.516 | -68,41 | 153 | -65,07 | ||||
| 2025-11-14 | 13F | Lido Advisors, LLC | 0 | -100,00 | 0 | |||||
| 2026-02-13 | 13F | Cetera Trust Company, N.A | 3.450 | 2,22 | 210 | 13,51 | ||||
| 2026-01-30 | 13F | Rachor Investment Advisory Services, LLC | 48 | 3 | ||||||
| 2025-11-14 | 13F | PointState Capital LP | 0 | -100,00 | 0 | |||||
| 2026-02-11 | 13F | Franklin Resources Inc | 782.851 | -52,36 | 47.699 | -47,33 | ||||
| 2026-02-12 | 13F | MetLife Investment Management, LLC | 1.414 | -0,14 | 86 | 10,26 | ||||
| 2026-02-13 | 13F | Caxton Associates Llp | 4.012 | 244 | ||||||
| 2025-11-12 | 13F | NewSquare Capital LLC | 0 | -100,00 | 0 | |||||
| 2026-02-09 | 13F | Atlantic Trust, LLC | 73 | 217,39 | 4 | 300,00 | ||||
| 2026-02-12 | 13F | Geneva Capital Management Llc | 0 | -100,00 | 0 | |||||
| 2026-01-08 | 13F | Chesapeake Asset Management Llc | 86 | 5 | ||||||
| 2026-02-17 | 13F | Jain Global LLC | 10.474 | -10,48 | 638 | -0,93 | ||||
| 2026-02-17 | 13F | Canada Pension Plan Investment Board | 12.900 | -37,68 | 786 | -31,14 | ||||
| 2026-02-13 | 13F | Ieq Capital, Llc | 45.678 | -8,88 | 2.783 | 0,76 | ||||
| 2025-11-14 | 13F | Point72 (DIFC) Ltd | 1.614 | 89 | ||||||
| 2026-02-02 | 13F | Strs Ohio | 1.140 | 0,18 | 69 | 11,29 | ||||
| 2026-02-12 | 13F | Bank Of Montreal /can/ | 1.564.534 | 334,49 | 95.327 | 380,38 | ||||
| 2026-02-18 | 13F/A | Alberta Investment Management Corp | 861.300 | 13,39 | 52.479 | 25,36 | ||||
| 2025-10-31 | 13F | Savoir Faire Capital Management, L.P. | 0 | -100,00 | 0 | |||||
| 2026-02-17 | 13F | Schonfeld Strategic Advisors LLC | 0 | -100,00 | 0 | |||||
| 2026-04-08 | 13F | Wealth Enhancement Advisory Services, Llc | 18.369 | 2,57 | 1.091 | -2,15 | ||||
| 2026-02-02 | 13F | Truist Financial Corp | 23.877 | 9,61 | 1.455 | 21,17 | ||||
| 2026-02-13 | 13F | Alyeska Investment Group, L.P. | 1.197.317 | 122,05 | 72.953 | 145,51 | ||||
| 2026-02-13 | 13F | Healthcare Of Ontario Pension Plan Trust Fund | 0 | -100,00 | 0 | |||||
| 2026-04-13 | 13F | Massmutual Trust Co Fsb/adv | 273 | -48,39 | 16 | -50,00 | ||||
| 2026-02-09 | 13F/A | Fideuram - Intesa Sanpaolo Private Banking S.p.a. | 6.311 | 385 | ||||||
| 2026-02-12 | 13F | Xponance, Inc. | 3.709 | 226 | ||||||
| 2026-01-29 | 13F | Comerica Bank | 12.768 | -22,96 | 778 | -14,90 | ||||
| 2026-02-17 | 13F | Summit Trail Advisors, Llc | 5.664 | 345 | ||||||
| 2026-02-23 | 13F | Mv Capital Management, Inc. | 43 | 760,00 | 3 | |||||
| 2026-02-12 | 13F | Ankerstar Wealth, LLC | 9 | 1 | ||||||
| 2026-02-17 | 13F | Russell Investments Group, Ltd. | 47.219 | -52,93 | 2.877 | -47,96 | ||||
| 2026-02-03 | 13F | SBI Securities Co., Ltd. | 255 | -11,46 | 16 | 0,00 | ||||
| 2026-04-06 | 13F | Washington Trust Advisors, Inc. | 13.375 | 1,52 | 789 | -1,75 | ||||
| 2026-02-13 | 13F | Commerce Bank | 48.151 | -0,42 | 2.934 | 10,10 | ||||
| 2026-02-13 | 13F | Landscape Capital Management, L.l.c. | 26.644 | 1.623 | ||||||
| 2026-02-17 | 13F | Capital Fund Management S.a. | 43.206 | -28,71 | 2.633 | -21,17 | ||||
| 2026-02-17 | 13F | Aquatic Capital Management LLC | 17.101 | -34,12 | 1.042 | -27,20 | ||||
| 2026-02-11 | 13F | Allianz Asset Management GmbH | 118.848 | -9,65 | 7.241 | -0,10 | ||||
| 2026-02-17 | 13F | Hood River Capital Management LLC | 504.276 | 1,88 | 30.726 | 12,64 | ||||
| 2025-11-06 | 13F | Breakwater Capital Group | 0 | -100,00 | 0 | -100,00 | ||||
| 2026-02-17 | 13F | Susquehanna International Group, Llp | Call | 231.500 | -35,30 | 14.105 | -28,47 | |||
| 2026-02-17 | 13F | Holocene Advisors, LP | 3.728 | 227 | ||||||
| 2026-02-17 | 13F | Captrust Financial Advisors | 10.389 | 44,07 | 633 | 59,19 | ||||
| 2025-11-06 | 13F | CENTRAL TRUST Co | 0 | -100,00 | 0 | |||||
| 2026-02-11 | 13F | Zions Bancorporation, National Association /ut/ | 34 | -99,78 | 2 | -99,77 | ||||
| 2026-02-13 | 13F | Golden State Wealth Management, LLC | 10 | 1 | ||||||
| 2026-02-17 | 13F | Susquehanna International Group, Llp | 35.585 | -89,87 | 2.168 | -88,80 | ||||
| 2026-02-17 | 13F | Susquehanna International Group, Llp | Put | 706.500 | -38,58 | 43.047 | -32,09 | |||
| 2025-10-31 | 13F | Pier 88 Investment Partners Llc | 0 | -100,00 | 0 | |||||
| 2026-01-27 | 13F | Zurcher Kantonalbank (Zurich Cantonalbank) | 18.278 | 6,48 | 1.114 | 17,65 | ||||
| 2026-02-17 | 13F | Engineers Gate Manager LP | 0 | -100,00 | 0 | |||||
| 2026-02-12 | 13F | Ironwood Investment Management Llc | 35.103 | -1,36 | 2.139 | 9,03 | ||||
| 2026-02-13 | 13F | Thornburg Investment Management Inc | 64.667 | 0,00 | 3.940 | 10,58 | ||||
| 2026-02-13 | 13F | Pinnacle Wealth Planning Services, Inc. | 1.183 | 72 | ||||||
| 2026-02-09 | 13F | Connors Investor Services Inc | 0 | -100,00 | 0 | |||||
| 2025-11-07 | 13F | Shell Asset Management Co | 1.157 | -54,14 | 0 | |||||
| 2026-02-13 | 13F | Segall Bryant & Hamill, Llc | 80.635 | 4,59 | 4.913 | 15,65 | ||||
| 2026-01-22 | 13F | Financial Consulate, Inc | 9 | 0,00 | 1 | |||||
| 2026-02-06 | 13F | Pnc Financial Services Group, Inc. | 4.456 | 35,73 | 272 | 50,56 | ||||
| 2026-02-13 | 13F | Barclays Plc | Put | 0 | -100,00 | 0 | -100,00 | |||
| 2026-02-12 | 13F | Brinker Capital Investments, LLC | 0 | -100,00 | 0 | |||||
| 2026-02-11 | 13F | Ing Groep Nv | 0 | -100,00 | 0 | |||||
| 2026-01-26 | 13F | Whittier Trust Co Of Nevada Inc | 21 | -25,00 | 1 | 0,00 | ||||
| 2026-02-11 | 13F | Simplex Trading, Llc | Call | 19.700 | -58,17 | 1.200 | 59.900,00 | |||
| 2026-02-13 | 13F | Marshall Wace, Llp | 390.154 | 23.772 | ||||||
| 2026-02-11 | 13F | Simplex Trading, Llc | Put | 10.900 | -67,27 | 664 | 66.300,00 | |||
| 2026-02-17 | 13F | Two Sigma Securities, Llc | 8.928 | 544 | ||||||
| 2026-02-13 | 13F | Parkside Financial Bank & Trust | 2.187 | 0,41 | 133 | 10,83 | ||||
| 2026-01-15 | 13F | Fortitude Family Office, LLC | 0 | -100,00 | 0 | |||||
| 2026-01-28 | 13F | Arizona State Retirement System | 13.617 | -5,58 | 830 | 4,41 | ||||
| 2026-02-12 | 13F | Voya Investment Management Llc | 3.830 | -10,53 | 233 | -0,85 | ||||
| 2026-02-17 | 13F | CWM Advisors, LLC | 19.176 | 1.168 | ||||||
| 2026-02-11 | 13F | Capital World Investors | 1.587.691 | 7,08 | 96.738 | 18,38 | ||||
| 2026-01-29 | 13F | Dunhill Financial, LLC | 1 | 0 | ||||||
| 2026-02-10 | 13F | Bank of New York Mellon Corp | 1.057.181 | 18,88 | 64.414 | 31,44 | ||||
| 2026-02-10 | 13F | Eurizon Capital SGR S.p.A. | 41.470 | 2.526 | ||||||
| 2026-02-13 | 13F | SRS Capital Advisors, Inc. | 260 | -98,63 | 16 | -98,56 | ||||
| 2026-02-02 | 13F | Benjamin Edwards Inc | 5.438 | -1,15 | 331 | 9,24 | ||||
| 2026-02-09 | 13F | Geode Capital Management, Llc | 880.103 | 3,18 | 53.637 | 14,08 | ||||
| 2026-02-19 | 13F | CI Private Wealth, LLC | 3.732 | 227 | ||||||
| 2026-02-09 | 13F | Hartland & Co., LLC | 48 | -82,16 | 3 | -85,71 | ||||
| 2026-02-02 | 13F | Principal Financial Group Inc | 231.767 | -0,90 | 14.122 | 9,57 | ||||
| 2026-02-09 | 13F | Emerald Mutual Fund Advisers Trust | 252.306 | 12,15 | 15.373 | 24,00 | ||||
| 2026-02-11 | 13F | Cerity Partners LLC | 48.372 | 14,94 | 2.947 | 27,08 | ||||
| 2026-02-19 | 13F | Birchwood Financial Partners, Inc. | 84 | 5 | ||||||
| 2025-11-13 | 13F | Jump Financial, LLC | 0 | -100,00 | 0 | -100,00 | ||||
| 2026-02-17 | 13F | Lighthouse Investment Partners, LLC | 371.792 | 22.653 | ||||||
| 2026-02-13 | 13F | Kayne Anderson Rudnick Investment Management Llc | 217.756 | -20,07 | 13.268 | -11,63 | ||||
| 2026-02-09 | 13F | Fisher Asset Management, LLC | 295.712 | 2,62 | 18.018 | 13,46 | ||||
| 2026-02-13 | 13F | Grandeur Peak Global Advisors, LLC | 135.321 | 117,06 | 8.245 | 140,03 | ||||
| 2025-11-06 | 13F | Bryce Point Capital, LLC | 13.661 | 37,52 | 753 | 11,41 | ||||
| 2026-02-13 | 13F | Sei Investments Co | 296.288 | -31,30 | 18.053 | -24,06 | ||||
| 2026-02-13 | 13F | Public Sector Pension Investment Board | 0 | -100,00 | 0 | |||||
| 2025-11-14 | 13F | Centiva Capital, LP | 0 | -100,00 | 0 | -100,00 | ||||
| 2026-02-17 | 13F | Ancora Advisors, LLC | 137 | 407,41 | 8 | 700,00 | ||||
| 2026-01-28 | 13F | Salomon & Ludwin, LLC | 350 | 10,06 | 21 | 23,53 | ||||
| 2026-02-13 | 13F | Walleye Trading LLC | Call | 23.700 | -27,30 | 1.444 | -19,60 | |||
| 2026-02-13 | 13F | Walleye Trading LLC | Put | 28.900 | 172,64 | 1.761 | 201,37 | |||
| 2025-11-12 | 13F | Erste Asset Management GmbH | 0 | -100,00 | 0 | |||||
| 2026-02-05 | 13F | Td Private Client Wealth Llc | 60 | 25,00 | 4 | 50,00 | ||||
| 2026-04-20 | 13F | Louisiana State Employees Retirement System | 21.600 | -3,57 | 1.274 | -6,67 | ||||
| 2026-01-23 | 13F | Baillie Gifford & Co | 23.601 | 0,00 | 1.438 | 10,62 | ||||
| 2025-11-13 | 13F | Connor, Clark & Lunn Investment Management Ltd. | 0 | -100,00 | 0 | |||||
| 2026-01-29 | 13F | IMC-Chicago, LLC | 0 | -100,00 | 0 | -100,00 | ||||
| 2026-02-13 | 13F | Morgan Stanley | 953.249 | 80,32 | 58.082 | 99,36 | ||||
| 2026-02-13 | 13F | Umb Bank N A/mo | 304 | 109,66 | 19 | 157,14 | ||||
| 2026-01-29 | 13F | Vanguard Group Inc | 5.281.833 | 2,49 | 321.822 | 13,32 | ||||
| 2026-04-15 | 13F | Bayforest Capital Ltd | 745 | -91,10 | 44 | -91,57 | ||||
| 2026-02-02 | 13F | Sachetta, LLC | 41 | 4.000,00 | 2 | |||||
| 2026-02-17 | 13F | Qube Research & Technologies Ltd | 82.255 | -90,12 | 5.012 | -89,07 | ||||
| 2026-02-10 | 13F | Goldman Sachs Group Inc | 230.829 | 33,29 | 14.064 | 47,36 | ||||
| 2026-02-03 | 13F/A | Bank Of America Corp /de/ | Call | 0 | -100,00 | 0 | -100,00 | |||
| 2026-02-11 | 13F | LPL Financial LLC | 15.880 | -48,00 | 968 | -42,54 | ||||
| 2026-02-17 | 13F | Gotham Asset Management, LLC | 58.473 | 746,94 | 3.563 | 837,37 | ||||
| 2026-02-10 | 13F | Bruce G. Allen Investments, LLC | 4 | -77,78 | 0 | |||||
| 2026-04-13 | 13F | Hm Payson & Co | 0 | -100,00 | 0 | |||||
| 2026-02-12 | 13F | California Public Employees Retirement System | 64.750 | -3,31 | 3.945 | 6,91 | ||||
| 2026-04-06 | 13F | GAMMA Investing LLC | 2.617 | 44,83 | 154 | 40,00 | ||||
| 2026-02-12 | 13F | Hrt Financial Lp | 23.992 | 1 | ||||||
| 2025-10-30 | 13F | Twin Peaks Wealth Advisors, LLC | 0 | -100,00 | 0 | |||||
| 2025-10-31 | 13F | Symphony Financial, Ltd. Co. | 0 | -100,00 | 0 | -100,00 | ||||
| 2026-04-07 | 13F | Farther Finance Advisors, LLC | 526 | -13,20 | 32 | -13,89 | ||||
| 2026-01-28 | 13F | Klp Kapitalforvaltning As | 10.600 | 0,00 | 646 | 10,45 | ||||
| 2026-04-13 | 13F | Creative Financial Designs Inc /adv | 19 | 1 | ||||||
| 2025-11-04 | 13F | Wcm Investment Management, Llc | 0 | -100,00 | 0 | |||||
| 2026-01-29 | 13F | Sanctuary Advisors, LLC | 3.940 | 240 | ||||||
| 2026-01-29 | 13F | UBS Group AG | Call | 20.000 | 1.219 | |||||
| 2026-01-20 | 13F | Tritonpoint Wealth, Llc | 3.550 | 216 | ||||||
| 2026-01-29 | 13F | UBS Group AG | 403.477 | -9,17 | 24.584 | 0,42 | ||||
| 2026-02-13 | 13F | Y-Intercept (Hong Kong) Ltd | 0 | -100,00 | 0 | |||||
| 2026-02-10 | 13F | Mutual Of America Capital Management Llc | 5.578 | 2,09 | 340 | 12,62 | ||||
| 2026-02-13 | 13F | Caitong International Asset Management Co., Ltd | 360 | 510,17 | 22 | 600,00 | ||||
| 2026-02-17 | 13F | Alliancebernstein L.p. | 16.457 | 21,03 | 1.003 | 33,78 | ||||
| 2026-02-17 | 13F | Fmr Llc | 559.373 | -62,82 | 34.083 | -58,89 | ||||
| 2026-02-03 | 13F | Morse Asset Management, Inc | 25 | 0,00 | 2 | 0,00 | ||||
| 2026-02-12 | 13F | Marex Group plc | 9.743 | 98,35 | 594 | 119,63 | ||||
| 2026-02-12 | 13F | Wealthspire Advisors, LLC | 0 | -100,00 | 0 | |||||
| 2026-02-17 | 13F | Ilex Capital Partners (UK) LLP | 915.161 | 18.177,63 | 55.761 | 20.176,36 | ||||
| 2026-01-27 | 13F | Lecap Asset Management Ltd | 0 | -100,00 | 0 | |||||
| 2025-10-27 | 13F | Nordea Investment Management Ab | 0 | -100,00 | 0 | |||||
| 2026-01-27 | 13F | TD Waterhouse Canada Inc. | 528 | 32 | ||||||
| 2026-02-03 | 13F | Farmers & Merchants Investments Inc | 20 | 0,00 | 1 | 0,00 | ||||
| 2026-02-13 | 13F | Natixis | 0 | -100,00 | 0 | |||||
| 2026-02-13 | 13F | Smartleaf Asset Management LLC | 882 | 32,04 | 53 | 51,43 | ||||
| 2026-02-17 | 13F | Blair William & Co/il | 35.920 | 5,22 | 2.189 | 16,32 | ||||
| 2026-02-12 | 13F | Principal Securities, Inc. | 0 | -100,00 | 0 | |||||
| 2026-02-12 | 13F | JPL Wealth Management, LLC | 0 | -100,00 | 0 | |||||
| 2026-02-02 | 13F | Cornerstone Planning Group LLC | 42 | -27,59 | 3 | 50,00 | ||||
| 2026-02-11 | 13F | Strategic Advocates LLC | 2 | 0,00 | 0 | |||||
| 2026-02-17 | 13F | Price T Rowe Associates Inc /md/ | 135.529 | 13,95 | 8 | 33,33 | ||||
| 2025-11-14 | 13F | Texas Permanent School Fund | 0 | -100,00 | 0 | |||||
| 2026-02-12 | 13F | Dimensional Fund Advisors Lp | 839.589 | -0,62 | 51.154 | 9,89 | ||||
| 2025-11-14 | 13F | Polymer Capital Management (US) LLC | 0 | -100,00 | 0 | |||||
| 2026-02-05 | 13F | Amalgamated Bank | 15.883 | 4,31 | 1 | |||||
| 2026-02-04 | 13F | Oregon Public Employees Retirement Fund | 11.164 | 1,46 | 680 | 12,21 | ||||
| 2026-02-11 | 13F | Clearbridge Investments, LLC | 108.861 | -7,67 | 6.633 | 2,08 | ||||
| 2026-02-09 | 13F | Royce & Associates Lp | 83.019 | 61,96 | 5.058 | 79,11 | ||||
| 2026-01-29 | 13F | IMC-Chicago, LLC | Put | 52.100 | -42,75 | 3.174 | -36,71 | |||
| 2026-01-29 | 13F | IMC-Chicago, LLC | Call | 22.800 | -55,29 | 1.389 | -50,57 | |||
| 2026-02-13 | 13F | Kestra Advisory Services, LLC | 767 | 47 | ||||||
| 2025-11-13 | 13F | Farringdon Capital, Ltd. | 0 | -100,00 | 0 | |||||
| 2026-04-16 | 13F | Capital Advisors, Ltd. LLC | 213 | -2,74 | 0 | |||||
| 2026-02-09 | 13F | Emerald Advisers, Llc | 417.400 | 11,40 | 25.432 | 23,17 | ||||
| 2026-02-17 | 13F | Quantinno Capital Management LP | 50.444 | 90,23 | 3.074 | 110,34 | ||||
| 2026-02-05 | 13F | Allworth Financial LP | 1.025 | 40,99 | 62 | 55,00 | ||||
| 2026-02-13 | 13F | Pathstone Holdings, LLC | 16.436 | 98,12 | 1.001 | 119,04 | ||||
| 2026-02-17 | 13F | Dark Forest Capital Management Lp | 16.373 | -83,58 | 998 | -81,85 | ||||
| 2026-02-17 | 13F | Wellington Management Group Llp | 2.152.246 | -6,30 | 131.136 | 3,60 | ||||
| 2026-02-17 | 13F | Janus Henderson Group Plc | 21.019 | 0,00 | 1.281 | 10,62 | ||||
| 2026-02-13 | 13F | Walleye Capital LLC | Put | 42.700 | 33,86 | 2.602 | 47,95 | |||
| 2025-11-14 | 13F | Investors Towarzystwo Funduszy Inwestycyjnych Spolka Akcyjna | 10.300 | -44,32 | 568 | -54,89 | ||||
| 2026-02-13 | 13F | Walleye Capital LLC | 45.844 | 1.192,47 | 2.793 | 1.332,31 | ||||
| 2026-02-17 | 13F | Brevan Howard Capital Management LP | 0 | -100,00 | 0 | |||||
| 2026-02-13 | 13F | Walleye Capital LLC | Call | 22.700 | -53,10 | 1.383 | -48,14 | |||
| 2025-11-12 | 13F | First Trust Advisors Lp | 0 | -100,00 | 0 | |||||
| 2026-02-17 | 13F | State Of Wisconsin Investment Board | 19.500 | -22,97 | 1.188 | -14,84 | ||||
| 2026-01-28 | 13F | WPG Advisers, LLC | 84 | 110,00 | 5 | 150,00 | ||||
| 2026-02-13 | 13F | MAI Capital Management | 18 | 100,00 | 1 | |||||
| 2026-02-17 | 13F | XTX Topco Ltd | 5.932 | 361 | ||||||
| 2026-01-29 | 13F | Impax Asset Management Group plc | 140.000 | 100,00 | 8.530 | 121,16 | ||||
| 2026-02-12 | 13F | Nuveen, LLC | 179.022 | -1,09 | 10.908 | 9,35 | ||||
| 2026-02-12 | 13F | CIBC Private Wealth Group, LLC | 114 | 26,67 | 7 | 50,00 | ||||
| 2026-02-17 | 13F | Public Employees Retirement System Of Ohio | 52.059 | -1,03 | 3.172 | 9,42 |