Grundlæggende statistik
| Institutionelle aktier (lange) | 377.407.404 (ex 13D/G) - change of -37,92MM shares -9,13% MRQ |
| Institutionel værdi (lang) | $ 4.568.096 USD ($1000) |
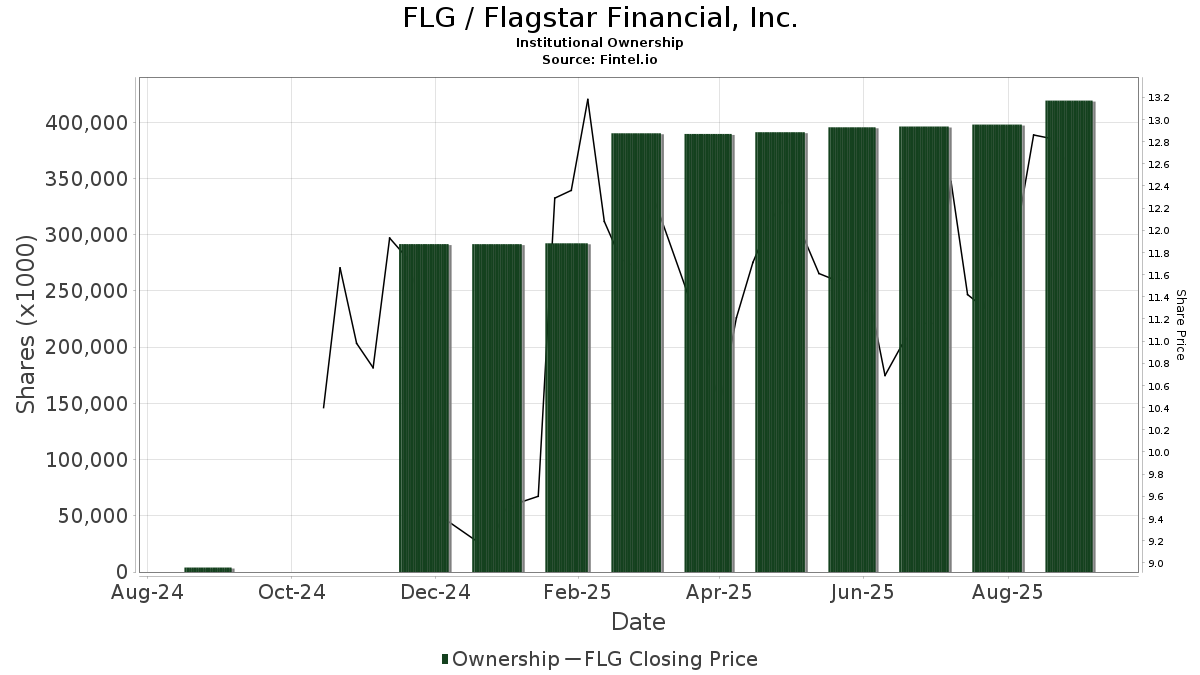
Institutionelt ejerskab og aktionærer
Flagstar Bank, National Association (US:FLG) har 388 institutionelle ejere og aktionærer, der har indsendt 13D/G- eller 13F-formularer til Securities Exchange Commission (SEC). Disse institutioner har i alt 377,407,404 aktier. Største aktionærer omfatter Liberty 77 Capital L.P., BlackRock, Inc., Reverence Capital Partners, L.p., Hudson Bay Capital Management LP, Vanguard Group Inc, State Street Corp, T. Rowe Price Investment Management, Inc., Geode Capital Management, Llc, Alliancebernstein L.p., and Susquehanna International Group, Llp .
Flagstar Bank, National Association (NYSE:FLG) institutionel ejerskabsstruktur viser aktuelle positioner i virksomheden efter institutioner og fonde, samt seneste ændringer i positionsstørrelse. Større aktionærer kan omfatte individuelle investorer, investeringsforeninger, hedgefonde eller institutioner. Skema 13D angiver, at investoren besidder (eller besidder) mere end 5 % af virksomheden og har til hensigt (eller har til hensigt at) aktivt at forfølge en ændring i forretningsstrategi. Skema 13G indikerer en passiv investering på over 5%.
The share price as of April 14, 2026 is 14,07 / share. Previously, on April 15, 2025, the share price was 10,32 / share. This represents an increase of 36,34% over that period.
Fondens stemningsscore
Fund Sentiment Score (fka Ownership Accumulation Score) finder de aktier, der bliver mest købt af fonde. Det er resultatet af en sofistikeret, multi-faktor kvantitativ model, der identificerer virksomheder med de højeste niveauer af institutionel akkumulering. Scoringsmodellen bruger en kombination af den samlede stigning i oplyste ejere, ændringerne i porteføljeallokeringer i disse ejere og andre målinger. Tallet går fra 0 til 100, hvor højere tal indikerer et højere niveau af akkumulering for sine jævnaldrende, og 50 er gennemsnittet.
Opdateringsfrekvens: Dagligt
Se Ownership Explorer, som giver en liste over højest rangerende virksomheder.
AI+ Ask Fintel’s AI assistant about Flagstar Bank, National Association.
Select a question to share a public post with an AI-crafted answer.
Thinking of good questions…
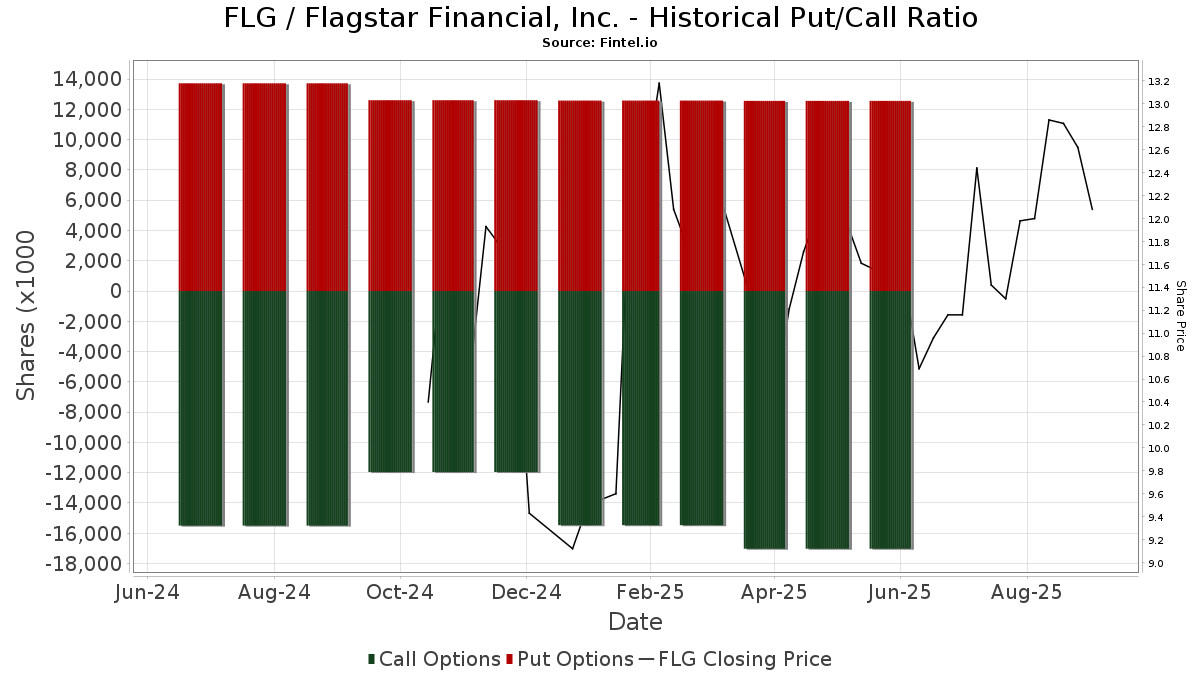
Institutionel Put/Call-forhold
Ud over at indberette standardaktie- og gældsudstedelser skal institutter med mere end 100 mill. aktiver under forvaltning også oplyse deres put- og call-optionsbeholdninger. Da salgsoptioner generelt indikerer negativ stemning, og købsoptioner indikerer positiv stemning, kan vi få en fornemmelse af den overordnede institutionelle stemning ved at plotte forholdet mellem put og kald. Diagrammet til højre viser det historiske put/call-forhold for dette instrument.
Brug af Put/Call Ratio som en indikator for investorernes stemning overvinder en af de vigtigste mangler ved at bruge totalt institutionelt ejerskab, som er, at en betydelig mængde af aktiver under forvaltning investeres passivt for at spore indekser. Passivt forvaltede fonde køber typisk ikke optioner, så indikatoren for put/call-forholdet følger mere nøje følelsen af aktivt forvaltede fonde.
13D/G-arkivering
Vi præsenterer 13D/G ansøgninger separat fra 13F ansøgninger på grund af den forskellige behandling af SEC. 13D/G-ansøgninger kan indgives af grupper af investorer (med én ledende), hvorimod 13F-ansøgninger ikke kan. Dette resulterer i situationer, hvor en investor kan indsende en 13D/G, der rapporterer én værdi for de samlede aktier (der repræsenterer alle de aktier, der ejes af investorgruppen), men derefter indsender en 13F, der rapporterer en anden værdi for de samlede aktier (der udelukkende repræsenterer deres egne) ejendomsret). Det betyder, at aktieejerskab af 13D/G-arkiver og 13F-arkiveringer ofte ikke er direkte sammenlignelige, så vi præsenterer dem separat.
Bemærk: Fra den 16. maj 2021 viser vi ikke længere ejere, der ikke har indsendt en 13D/G inden for det seneste år. Tidligere viste vi den fulde historie af 13D/G-arkiver. Generelt skal enheder, der er forpligtet til at indgive 13D/G-ansøgninger, indgive mindst årligt, før de indsender en afsluttende ansøgning. Dog forlader fonde nogle gange positioner uden at indsende en afsluttende ansøgning (dvs. de afvikler), så visning af den fulde historie resulterede nogle gange i forvirring om det nuværende ejerskab. For at undgå forvirring viser vi nu kun 'aktuelle' ejere - det vil sige - ejere, der har anmeldt inden for det seneste år.
Upgrade to unlock premium data.
| Fil dato | Form | Investor | Forrige Aktier |
Seneste Aktier |
Δ Aktier (Procent) |
Ejendomsret (Procent) |
Δ Ejerskab (Procent) |
|
|---|---|---|---|---|---|---|---|---|
| 2026-03-26 | VANGUARD GROUP INC | 30,982,752 | 0 | -100.00 | 0.00 | -100.00 | ||
| 2026-01-30 | RCP GenPar HoldCo LLC | 35,981,113 | 8.65 | |||||
| 2025-10-21 | Liberty 77 Capital L.P. | 75,013,636 | 113,520,361 | 51.33 | 24.90 | 37.57 | ||
| 2025-05-14 | Hudson Bay Capital Management LP | 41,416,544 | 34,689,439 | -16.24 | 8.36 | -16.15 | ||
| 2025-05-13 | STATE STREET CORP | 23,115,141 | 18,331,396 | -20.70 | 4.40 | -21.43 | ||
| 2025-04-17 | BlackRock, Inc. | 38,730,567 | 33,959,600 | -12.32 | 8.20 | -11.83 |
13F og NPORT arkivering
Detaljer om 13F-arkivering er gratis. Detaljer om NP-ansøgninger kræver et premium-medlemskab. Grønne rækker angiver nye positioner. Røde rækker angiver lukkede positioner. Klik på linket ikon for at se den fulde transaktionshistorik.
Opgrader
for at låse premium-data op og eksportere til Excel ![]() .
.
| Fil dato | Kilde | Investor | Type | Gennemsnitlig pris (Øst) |
Aktier | Δ Aktier (%) |
Rapporteret Værdi ($1000) |
Δ Værdi (%) |
Port Alloc (%) |
|
|---|---|---|---|---|---|---|---|---|---|---|
| 2026-02-13 | 13F | Atlas Capital Advisors Llc | 10.515 | 0,00 | 132 | 18,92 | ||||
| 2026-02-17 | 13F | Man Group plc | 364.438 | 4.588 | ||||||
| 2026-02-17 | 13F | Guggenheim Capital Llc | 21.010 | 49,06 | 265 | 62,96 | ||||
| 2026-01-21 | 13F | Sound Income Strategies, LLC | 3.259 | -1,15 | 42 | 7,69 | ||||
| 2026-02-13 | 13F | Sterling Capital Management LLC | 17.625 | -16,27 | 222 | -9,05 | ||||
| 2026-02-13 | 13F | Prudential Financial Inc | 23.826 | -48,52 | 300 | -44,01 | ||||
| 2026-02-10 | 13F | Eurizon Capital SGR S.p.A. | 4.289 | 54 | ||||||
| 2025-11-13 | 13F | Global Value Investment Corp. | 304.509 | -0,38 | 3.517 | 8,55 | ||||
| 2026-03-12 | 13F/A | Peak6 Llc | 0 | -100,00 | 0 | -100,00 | ||||
| 2026-02-12 | 13F | Johnson Financial Group, Inc. | 1.226 | -71,98 | 15 | -70,00 | ||||
| 2026-02-10 | 13F | Bnp Paribas Arbitrage, Sa | 247.731 | -81,29 | 3.119 | -79,61 | ||||
| 2026-02-13 | 13F | Rafferty Asset Management, LLC | 640.726 | -24,55 | 8.067 | -17,76 | ||||
| 2026-01-26 | 13F | PFG Investments, LLC | 29.256 | -10,64 | 368 | -2,65 | ||||
| 2025-11-12 | 13F | Aster Capital Management (DIFC) Ltd | 0 | -100,00 | 0 | |||||
| 2026-02-17 | 13F | Aqr Capital Management Llc | 128.404 | 27,12 | 1.617 | 38,71 | ||||
| 2026-01-29 | 13F | Quent Capital, LLC | 241 | 0,00 | 3 | 50,00 | ||||
| 2026-02-10 | 13F | Novak & Powell Financial Services, Inc. | 19.190 | 0,06 | 242 | 9,05 | ||||
| 2026-02-17 | 13F | Point72 Asset Management, L.P. | Put | 14.700 | 185 | |||||
| 2026-04-10 | 13F | Armstrong Advisory Group, Inc | 100 | 0,00 | 1 | 0,00 | ||||
| 2026-02-17 | 13F | Point72 Asset Management, L.P. | Call | 15.000 | 189 | |||||
| 2026-02-12 | 13F | Third Avenue Management Llc | 217.305 | 2.736 | ||||||
| 2026-02-13 | 13F | Police & Firemen's Retirement System of New Jersey | 83.766 | -0,43 | 1.055 | 8,55 | ||||
| 2026-02-13 | 13F | Bay Colony Advisory Group, Inc d/b/a Bay Colony Advisors | 0 | -100,00 | 0 | |||||
| 2026-01-16 | 13F | FNY Investment Advisers, LLC | 6.000 | 174,73 | 0 | |||||
| 2026-02-13 | 13F | Manufacturers Life Insurance Company, The | 0 | -100,00 | 0 | |||||
| 2026-01-16 | 13F | Trust Co Of Vermont | 400 | 0,00 | 5 | 25,00 | ||||
| 2026-02-12 | 13F | Ensign Peak Advisors, Inc | 22.989 | -63,27 | 289 | -59,97 | ||||
| 2025-11-14 | 13F | Engle Capital Management, L.P. | 0 | -100,00 | 0 | |||||
| 2026-01-28 | 13F | Turtle Creek Wealth Advisors, LLC | 16.807 | 0,08 | 212 | 9,33 | ||||
| 2026-02-12 | 13F | New York State Common Retirement Fund | 96.219 | 0,00 | 1.211 | 9,00 | ||||
| 2026-02-17 | 13F | Price T Rowe Associates Inc /md/ | 641.058 | -0,08 | 8 | 14,29 | ||||
| 2026-01-12 | 13F | Seacrest Wealth Management, Llc | 13.923 | -5,11 | 175 | -0,57 | ||||
| 2026-01-16 | 13F | FNY Investment Advisers, LLC | Call | 27 | -3,57 | 0 | ||||
| 2026-02-13 | 13F | Level Four Advisory Services, Llc | 37.303 | -10,11 | 470 | -2,09 | ||||
| 2026-02-12 | 13F | Gagnon Securities Llc | 74.867 | -0,11 | 943 | 8,90 | ||||
| 2026-02-17 | 13F | Tower Research Capital LLC (TRC) | 13.186 | -36,01 | 166 | -30,25 | ||||
| 2026-02-17 | 13F | Two Sigma Investments, Lp | Put | 13.200 | 166 | |||||
| 2026-02-17 | 13F | Amundi | 10.166 | 128 | ||||||
| 2026-02-17 | 13F | Two Sigma Investments, Lp | 1.376.645 | -19,02 | 17.332 | -11,73 | ||||
| 2025-11-14 | 13F | ExodusPoint Capital Management, LP | Call | 630.000 | -22,22 | 7.276 | 90.850,00 | |||
| 2025-11-14 | 13F | ExodusPoint Capital Management, LP | 162.698 | 1.400,21 | 1.879 | |||||
| 2026-01-23 | 13F | Nbt Bank N A /ny | 83 | 0,00 | 1 | |||||
| 2026-02-17 | 13F | Equitable Holdings, Inc. | 198.410 | 0,08 | 2.498 | 9,09 | ||||
| 2026-02-17 | 13F | Interval Partners, LP | 923.876 | 11.632 | ||||||
| 2025-10-24 | 13F | Hemington Wealth Management | 150 | 89,87 | 0 | |||||
| 2026-01-28 | 13F | Universal- Beteiligungs- und Servicegesellschaft mbH | 17.425 | 17,90 | 219 | 28,82 | ||||
| 2026-02-04 | 13F | Securian Asset Management, Inc | 21.815 | -2,65 | 275 | 6,20 | ||||
| 2025-11-14 | 13F | Point72 Asset Management, L.P. | 0 | -100,00 | 0 | -100,00 | ||||
| 2026-01-29 | 13F | Rakuten Securities, Inc. | 300 | 0,00 | 4 | 0,00 | ||||
| 2025-11-14 | 13F | Scientech Research LLC | 0 | -100,00 | 0 | |||||
| 2026-02-17 | 13F | Bank Of America Corp /de/ | 3.080.415 | -45,38 | 38.782 | -40,46 | ||||
| 2026-02-17 | 13F | Magnetar Financial LLC | 96.611 | 1.216 | ||||||
| 2026-01-28 | 13F | Proathlete Wealth Management Llc | 416 | 5 | ||||||
| 2026-02-02 | 13F | CENTRAL TRUST Co | 55 | 0,00 | 1 | |||||
| 2026-03-12 | 13F/A | Peak6 Llc | Call | 722.200 | -50,29 | 9.092 | -45,82 | |||
| 2026-02-14 | 13F | Rockefeller Capital Management L.P. | 11.873 | -81,83 | 149 | -80,24 | ||||
| 2026-02-17 | 13F | Advisory Services Network, LLC | 0 | -100,00 | 0 | |||||
| 2026-03-12 | 13F/A | Peak6 Llc | Put | 400.400 | -44,03 | 5.041 | -38,99 | |||
| 2026-02-17 | 13F | DV Trading LLC | 1.000 | 13 | ||||||
| 2026-02-02 | 13F | Fifth Third Bancorp | 3.439 | -15,25 | 43 | -6,52 | ||||
| 2026-02-19 | 13F/A | T. Rowe Price Investment Management, Inc. | 12.651.136 | -6,32 | 159 | 2,58 | ||||
| 2026-02-13 | 13F | Wells Fargo & Company/mn | 559.711 | 31,75 | 7.047 | 43,62 | ||||
| 2026-01-29 | 13F | Vanguard Group Inc | 32.074.631 | -1,00 | 403.820 | 7,91 | ||||
| 2025-10-31 | 13F | Whittier Trust Co | 0 | -100,00 | 0 | |||||
| 2026-02-17 | 13F | Dv Equities, Llc | 1.981 | 25 | ||||||
| 2026-01-16 | 13F | Applied Capital LLC/FL | 13.732 | 173 | ||||||
| 2026-02-17 | 13F | Abel Hall, LLC | 12.614 | 159 | ||||||
| 2026-02-10 | 13F | Norges Bank | 3.498.468 | 44.046 | ||||||
| 2026-02-10 | 13F | Continuum Advisory, LLC | 0 | -100,00 | 0 | |||||
| 2026-02-09 | 13F | Annis Gardner Whiting Capital Advisors, LLC | 38 | 0 | ||||||
| 2026-02-18 | 13F | State of Tennessee, Treasury Department | 105.082 | -4,11 | 1.389 | 9,80 | ||||
| 2026-02-11 | 13F | Jpmorgan Chase & Co | 1.023.795 | -73,24 | 12.890 | -70,83 | ||||
| 2026-02-10 | 13F | Evolution Wealth Management Inc. | 72 | 0,00 | 1 | |||||
| 2026-02-05 | 13F | JCSD Capital, LLC | Put | 82.800 | 1.042 | |||||
| 2026-02-13 | 13F | De Lisle Partners LLP | 73.237 | 0,00 | 922 | 8,87 | ||||
| 2026-01-23 | 13F | State of Alaska, Department of Revenue | 29.495 | -8,34 | 0 | |||||
| 2026-04-06 | 13F | Highline Wealth Partners Llc | 1 | 0,00 | 0 | |||||
| 2026-02-10 | 13F | State of Wyoming | 131 | 43,96 | 2 | 0,00 | ||||
| 2026-02-17 | 13F | Sender Co & Partners, Inc. | 0 | -100,00 | 0 | |||||
| 2026-02-17 | 13F | Voleon Capital Management Lp | 40.950 | -42,72 | 516 | -37,58 | ||||
| 2026-02-12 | 13F | Skopos Labs, Inc. | 20.054 | 255 | ||||||
| 2026-04-08 | 13F | Wealth Enhancement Advisory Services, Llc | Call | 0 | -100,00 | 0 | -100,00 | |||
| 2026-02-05 | 13F | Amalgamated Bank | 126.194 | -3,21 | 2 | 0,00 | ||||
| 2026-02-09 | 13F | Arnhold LLC | 23.332 | 0,00 | 294 | 8,92 | ||||
| 2025-11-14 | 13F | Wolverine Trading, Llc | Call | 375.800 | 15,35 | 4.325 | 22,83 | |||
| 2025-11-14 | 13F | Wolverine Trading, Llc | Put | 326.200 | -19,14 | 3.755 | -13,90 | |||
| 2026-04-13 | 13F | IFP Advisors, Inc | 1.408 | 0,00 | 19 | 5,88 | ||||
| 2026-01-28 | 13F | Teacher Retirement System Of Texas | 10.301 | -74,73 | 130 | -72,55 | ||||
| 2025-11-12 | 13F | 111 Capital | 0 | -100,00 | 0 | |||||
| 2026-02-13 | 13F | Marshall Wace, Llp | 0 | -100,00 | 0 | |||||
| 2026-02-12 | 13F | Promethium Advisors,llc | 59.300 | -14,86 | 747 | -7,21 | ||||
| 2026-02-17 | 13F | Caption Management, LLC | Call | 388.600 | -59,09 | 4.892 | -55,41 | |||
| 2026-02-17 | 13F | Caption Management, LLC | 20.000 | -73,94 | 252 | -71,67 | ||||
| 2026-02-17 | 13F | Caption Management, LLC | Put | 8.500 | 107 | |||||
| 2025-11-14 | 13F | Capital Analysts, Inc. | 0 | -100,00 | 0 | |||||
| 2026-02-17 | 13F | Leonteq Securities AG | 0 | -100,00 | 0 | |||||
| 2026-01-14 | 13F | Wealthcare Advisory Partners LLC | 0 | -100,00 | 0 | |||||
| 2026-02-13 | 13F | FORA Capital, LLC | 60.712 | 791 | ||||||
| 2026-02-10 | 13F | Easterly Investment Partners Llc | 106.254 | 8,14 | 1.338 | 17,90 | ||||
| 2026-02-18 | 13F | GWM Advisors LLC | 1.003 | 0,10 | 13 | 9,09 | ||||
| 2026-04-08 | 13F | Mirador Capital Partners LP | 88.135 | 5,99 | 1.161 | 10,90 | ||||
| 2026-02-12 | 13F | Round Hill Asset Management | 141.373 | -0,19 | 1.780 | 8,81 | ||||
| 2026-02-10 | 13F | Collar Capital Management, LLC | 117.025 | 0,93 | 1.473 | 10,01 | ||||
| 2025-11-06 | 13F | Ground Swell Capital, LLC | 0 | -100,00 | 0 | -100,00 | ||||
| 2026-02-17 | 13F | D. E. Shaw & Co., Inc. | Put | 150.000 | 0,00 | 1.888 | 9,01 | |||
| 2026-02-03 | 13F | Crossmark Global Holdings, Inc. | 14.603 | -5,05 | 184 | 3,39 | ||||
| 2026-02-17 | 13F | Public Employees Retirement System Of Ohio | 6.494 | -13,17 | 82 | -5,81 | ||||
| 2025-11-14 | 13F | Point72 Asia (Singapore) Pte. Ltd. | 657 | 8 | ||||||
| 2026-02-17 | 13F | Quest Investment Management Llc | 30.487 | -25,05 | 384 | -18,34 | ||||
| 2026-02-13 | 13F | Sei Investments Co | 250.617 | 3,44 | 3.155 | 12,76 | ||||
| 2025-10-30 | 13F | Twin Peaks Wealth Advisors, LLC | 0 | -100,00 | 0 | |||||
| 2026-02-19 | 13F | Invesco Ltd. | 967.095 | 16,35 | 12.176 | 26,82 | ||||
| 2026-02-17 | 13F | Brevan Howard Capital Management LP | 118.745 | -11,66 | 1.495 | -3,67 | ||||
| 2026-02-09 | 13F | Wellington Shields & Co., LLC | 0 | -100,00 | 0 | |||||
| 2026-02-17 | 13F | Polar Asset Management Partners Inc. | 1.188.449 | 243,53 | 14.963 | 274,52 | ||||
| 2026-02-12 | 13F | BRYN MAWR TRUST Co | 0 | -100,00 | 0 | |||||
| 2026-01-30 | 13F | North Star Investment Management Corp. | 715 | 0,00 | 9 | 12,50 | ||||
| 2026-02-13 | 13F | Kilter Group LLC | 18 | -83,02 | 0 | -100,00 | ||||
| 2026-02-04 | 13F | Swiss Life Asset Management Ltd | 14.694 | 0,00 | 185 | 8,88 | ||||
| 2026-02-17 | 13F | D. E. Shaw & Co., Inc. | 242.467 | 887,36 | 3.053 | 978,45 | ||||
| 2026-02-17 | 13F | D. E. Shaw & Co., Inc. | Call | 284.500 | 24,56 | 3.582 | 35,75 | |||
| 2026-02-13 | 13F | Gts Securities Llc | 0 | -100,00 | 0 | |||||
| 2025-11-13 | 13F | Hsbc Holdings Plc | 0 | -100,00 | 0 | -100,00 | ||||
| 2026-02-17 | 13F | Longaeva Partners L.P. | 357.189 | 4.497 | ||||||
| 2026-02-17 | 13F | Twinbeech Capital Lp | 96.700 | -77,36 | 1.217 | -75,33 | ||||
| 2026-02-17 | 13F | SageView Advisory Group, LLC | 10.346 | 130 | ||||||
| 2025-11-04 | 13F | Raleigh Capital Management Inc. | 0 | -100,00 | 0 | |||||
| 2026-02-13 | 13F | Basswood Capital Management, L.l.c. | 491.956 | 0,00 | 6.194 | 8,99 | ||||
| 2026-02-10 | 13F | CIBC Asset Management Inc | 12.804 | 161 | ||||||
| 2026-02-12 | 13F | Jane Street Group, Llc | 940.280 | 5,53 | 11.838 | 15,03 | ||||
| 2026-02-12 | 13F | Jane Street Group, Llc | Put | 1.396.866 | 81,31 | 17.587 | 97,64 | |||
| 2026-02-12 | 13F | Jane Street Group, Llc | Call | 1.080.069 | -6,62 | 13.598 | 1,79 | |||
| 2026-02-12 | 13F | Litman Gregory Asset Management LLC | 2.666 | 34 | ||||||
| 2025-11-10 | 13F | Stevens Capital Management Lp | 0 | -100,00 | 0 | |||||
| 2026-02-04 | 13F | Pacer Advisors, Inc. | 0 | -100,00 | 0 | |||||
| 2026-01-30 | 13F | Camden Capital, LLC | 2.124.280 | 0,00 | 26.745 | 9,00 | ||||
| 2026-02-12 | 13F | BlackRock, Inc. | 43.037.770 | -4,01 | 541.846 | 4,63 | ||||
| 2026-02-17 | 13F | PDT Partners, LLC | 0 | -100,00 | 0 | |||||
| 2026-02-11 | 13F | J.w. Cole Advisors, Inc. | 0 | -100,00 | 0 | |||||
| 2026-02-13 | 13F | Barclays Plc | 992.112 | -68,19 | 12.491 | -65,33 | ||||
| 2026-01-15 | 13F | Retirement Systems of Alabama | 359.260 | -0,69 | 4.523 | 8,26 | ||||
| 2026-02-10 | 13F | Marshall & Sterling Wealth Advisors Inc. | 1.555 | 0,06 | 20 | 11,76 | ||||
| 2026-02-13 | 13F | JustInvest LLC | 25.311 | 9,14 | 319 | 19,10 | ||||
| 2026-02-13 | 13F | Victory Capital Management Inc | 6.216.266 | -1,20 | 78.263 | 7,70 | ||||
| 2026-02-17 | 13F | Ameriprise Financial Inc | 397.543 | -4,55 | 5.005 | 4,05 | ||||
| 2026-02-13 | 13F | Ausdal Financial Partners, Inc. | 27.292 | -4,60 | 344 | 3,94 | ||||
| 2026-02-17 | 13F | Capital Fund Management S.a. | 649.019 | 88,09 | 8.171 | 105,04 | ||||
| 2026-02-17 | 13F | Herold Advisors, Inc. | 0 | -100,00 | 0 | |||||
| 2026-02-03 | 13F | SBI Securities Co., Ltd. | 2.168 | -18,37 | 27 | -10,00 | ||||
| 2026-02-11 | 13F | Private Management Group Inc | 3.111.069 | 1,11 | 39.168 | 10,21 | ||||
| 2026-02-13 | 13F | Pinnacle Wealth Planning Services, Inc. | 199 | 3 | ||||||
| 2025-11-13 | 13F | Tortoise Investment Management, LLC | Call | 0 | -100,00 | 0 | ||||
| 2026-02-06 | 13F | Bare Financial Services, Inc | 87 | 443,75 | 1 | |||||
| 2026-02-09 | 13F | Quest Partners LLC | 29.722 | 14,60 | 374 | 25,08 | ||||
| 2026-02-17 | 13F | Jones Financial Companies Lllp | 2.827 | -22,12 | 36 | -16,67 | ||||
| 2026-02-06 | 13F | Reverence Capital Partners, L.p. | 35.981.113 | 0,00 | 453.002 | 9,00 | ||||
| 2026-02-17 | 13F | Russell Investments Group, Ltd. | 177.464 | -2,12 | 2.234 | 6,69 | ||||
| 2026-02-13 | 13F | National Bank Of Canada /fi/ | 426 | -35,84 | 5 | -28,57 | ||||
| 2025-11-04 | 13F | Guerra Advisors Inc | 351 | 4 | ||||||
| 2026-01-26 | 13F | KBC Group NV | 10.512 | 0,00 | 0 | |||||
| 2026-01-29 | 13F | Teachers Retirement System Of The State Of Kentucky | 76.373 | 0,00 | 1 | |||||
| 2026-01-30 | 13F | Archer Investment Corp | 0 | -100,00 | 0 | |||||
| 2026-02-17 | 13F | Optiver Holding B.V. | 1.558 | -42,04 | 20 | -38,71 | ||||
| 2026-02-12 | 13F | Quadrant Capital Group Llc | 27.122 | -0,56 | 341 | 8,25 | ||||
| 2026-01-28 | 13F | HB Wealth Management, LLC | 10.338 | -5,16 | 130 | 4,00 | ||||
| 2026-02-10 | 13F | Belvedere Trading LLC | Call | 144.900 | 2,40 | 607 | 11,58 | |||
| 2026-01-12 | 13F | VisionPoint Advisory Group, LLC | 0 | -100,00 | 0 | |||||
| 2026-02-10 | 13F | Belvedere Trading LLC | Put | 600 | 0,00 | 3 | 0,00 | |||
| 2026-02-17 | 13F | Old West Investment Management, LLC | 0 | -100,00 | 0 | |||||
| 2026-01-30 | 13F | State of New Jersey Common Pension Fund D | 199.156 | 10,48 | 2.507 | 20,41 | ||||
| 2026-01-30 | 13F | Activest Wealth Management | 1 | 0,00 | 0 | |||||
| 2026-02-17 | 13F | Susquehanna International Group, Llp | Call | 6.746.700 | -1,84 | 84.941 | 6,99 | |||
| 2025-10-23 | 13F | Moisand Fitzgerald Tamayo, LLC | 0 | -100,00 | 0 | |||||
| 2026-01-15 | 13F | Nisa Investment Advisors, Llc | 2.737 | -72,50 | 34 | -70,18 | ||||
| 2026-02-09 | 13F | Frazier Financial Advisors, LLC | 3.969 | 54,68 | 50 | 68,97 | ||||
| 2026-02-17 | 13F | Susquehanna International Group, Llp | 102.496 | -66,05 | 1.290 | -63,01 | ||||
| 2026-02-17 | 13F | Susquehanna International Group, Llp | Put | 4.636.700 | -13,19 | 58.376 | -5,38 | |||
| 2026-02-12 | 13F | Kahn Brothers Group Inc /de/ | 4.177.212 | -2,78 | 52.591 | 5,97 | ||||
| 2026-02-20 | 13F | Sunbelt Securities, Inc. | 11 | 0 | ||||||
| 2025-11-10 | 13F | Princeton Capital Management Llc | 0 | -100,00 | 0 | |||||
| 2026-02-13 | 13F | Transamerica Financial Advisors, Inc. | 109 | 1 | ||||||
| 2026-02-10 | 13F | Moors & Cabot, Inc. | 14.945 | -3,86 | 188 | 5,03 | ||||
| 2025-11-17 | 13F | Kestra Investment Management, LLC | 0 | -100,00 | 0 | -100,00 | ||||
| 2026-02-13 | 13F | Dymon Asia Capital (singapore) Pte. Ltd. | 0 | -100,00 | 0 | |||||
| 2026-02-02 | 13F | Danske Bank A/s | 200 | 0,00 | 3 | 0,00 | ||||
| 2026-02-13 | 13F | Bridgewater Associates, LP | 1.703.894 | 708,20 | 21.452 | 780,99 | ||||
| 2026-02-18 | 13F | Mendon Capital Advisors Corp | Call | 0 | -100,00 | 0 | ||||
| 2026-02-17 | 13F | CWM Advisors, LLC | 45.981 | -4,14 | 579 | 4,33 | ||||
| 2026-01-23 | 13F | Valley National Advisers Inc | 433 | 0,00 | 0 | |||||
| 2026-01-30 | 13F | Levin Capital Strategies, L.p. | 0 | -100,00 | 0 | |||||
| 2026-02-02 | 13F | Oppenheimer & Co Inc | 15.585 | -15,70 | 196 | -7,98 | ||||
| 2026-02-06 | 13F | Covestor Ltd | 1.002 | 0,20 | 0 | |||||
| 2026-02-06 | 13F | Larson Financial Group LLC | 475 | -9,70 | 6 | -16,67 | ||||
| 2026-02-13 | 13F | Morgan Stanley | 4.541.489 | 15,87 | 57.177 | 26,30 | ||||
| 2025-11-14 | 13F | Cubist Systematic Strategies, LLC | Call | 0 | -100,00 | 0 | -100,00 | |||
| 2026-02-09 | 13F | Keating Financial Advisory Services, Inc. | 130 | 2 | ||||||
| 2026-02-11 | 13F | Empowered Funds, LLC | 28.196 | 2,58 | 355 | 11,67 | ||||
| 2026-01-21 | 13F | SJS Investment Consulting Inc. | 678 | 0,00 | 9 | 14,29 | ||||
| 2026-01-12 | 13F | Rialto Wealth Management, LLC | 27 | -55,74 | 0 | |||||
| 2026-02-17 | 13F | Northern Trust Corp | 3.311.663 | -7,12 | 41.694 | 1,24 | ||||
| 2026-04-08 | 13F | DiNuzzo Private Wealth, Inc. | 44 | 0,00 | 1 | |||||
| 2025-11-14 | 13F | Interval Partners, LP | Call | 0 | -100,00 | 0 | ||||
| 2026-01-23 | 13F | Sippican Capital Advisors | 148.805 | 100,06 | 1.873 | 118,04 | ||||
| 2026-02-05 | 13F | Cambridge Investment Research Advisors, Inc. | 34.574 | -10,29 | 0 | |||||
| 2026-02-13 | 13F | Barclays Plc | Put | 0 | -100,00 | 0 | -100,00 | |||
| 2026-04-14 | 13F | Thurston, Springer, Miller, Herd & Titak, Inc. | 334 | 0,00 | 4 | 0,00 | ||||
| 2026-02-17 | 13F | Rexford Capital Inc | 0 | -100,00 | 0 | |||||
| 2025-11-12 | 13F | Transce3nd, LLC | 0 | -100,00 | 0 | |||||
| 2026-02-18 | 13F | Mendon Capital Advisors Corp | 316.332 | 1.813,68 | 3.983 | 1.995,79 | ||||
| 2026-01-30 | 13F | Torren Management, LLC | 359 | 5 | ||||||
| 2026-04-06 | 13F | GAMMA Investing LLC | 6.095 | 5,93 | 80 | 11,11 | ||||
| 2026-01-29 | 13F | Pictet Asset Management Holding SA | 49.063 | 9,87 | 618 | 19,81 | ||||
| 2026-02-17 | 13F | One William Street Capital Management, L.p. | 400.000 | 95,12 | 5.036 | 112,76 | ||||
| 2026-01-16 | 13F | Marquette Asset Management, LLC | 3.333 | 0,00 | 42 | 7,89 | ||||
| 2026-01-15 | 13F | Fortitude Family Office, LLC | 75 | 294,74 | 1 | |||||
| 2026-02-06 | 13F | Global Retirement Partners, LLC | 821 | 62,57 | 10 | 100,00 | ||||
| 2026-02-17 | 13F | State Of Wisconsin Investment Board | 50.146 | 29,57 | 631 | 41,16 | ||||
| 2026-02-03 | 13F | Everence Capital Management Inc | 21.850 | 0,00 | 0 | |||||
| 2026-01-29 | 13F | State Of Michigan Retirement System | 70.695 | -0,84 | 890 | 8,14 | ||||
| 2026-02-02 | 13F | Legacy Edge Advisors, LLC | 16.166 | 204 | ||||||
| 2026-02-13 | 13F | Squarepoint Ops LLC | Call | 38.900 | 490 | |||||
| 2026-02-17 | 13F | Tudor Investment Corp Et Al | 63.762 | -57,04 | 803 | -53,21 | ||||
| 2026-02-10 | 13F | Fpc Investment Advisory, Inc. | 15.700 | 198 | ||||||
| 2026-02-12 | 13F | Brown Brothers Harriman & Co | 0 | -100,00 | 0 | |||||
| 2026-02-17 | 13F | Tudor Investment Corp Et Al | Put | 122.200 | -17,93 | 1.538 | -10,53 | |||
| 2026-01-20 | 13F | SOA Wealth Advisors, LLC. | 133 | 0,00 | 2 | 0,00 | ||||
| 2026-02-17 | 13F | Tudor Investment Corp Et Al | Call | 115.700 | -30,18 | 1.457 | -23,89 | |||
| 2026-02-05 | 13F | Blume Capital Management, Inc. | 0 | -100,00 | 0 | |||||
| 2026-02-12 | 13F | Federation des caisses Desjardins du Quebec | 91.425 | 14,90 | 1.151 | 25,38 | ||||
| 2026-02-09 | 13F | Key FInancial Inc | 66 | 1 | ||||||
| 2026-02-13 | 13F | Verition Fund Management LLC | 370.064 | -27,50 | 4.659 | -20,97 | ||||
| 2026-02-17 | 13F | Hotchkis & Wiley Capital Management Llc | 1.086.301 | -0,72 | 13.677 | 8,21 | ||||
| 2026-02-05 | 13F | Phoenix Holdings Ltd. | 66.880 | 0,65 | 842 | 9,78 | ||||
| 2025-10-31 | 13F | GHP Investment Advisors, Inc. | 0 | -100,00 | 0 | |||||
| 2026-02-13 | 13F | BNP Paribas Asset Management Holding S.A. | 4.102 | 42,23 | 0 | |||||
| 2025-11-06 | 13F | Versor Investments LP | 0 | -100,00 | 0 | -100,00 | ||||
| 2026-01-23 | 13F | Assetmark, Inc | 20 | 25,00 | 0 | |||||
| 2026-02-13 | 13F | State Street Corp | 17.701.698 | -3,69 | 222.864 | 4,98 | ||||
| 2026-02-17 | 13F | Cetera Investment Advisers | 76.588 | -7,16 | 964 | 1,26 | ||||
| 2026-02-03 | 13F | International Assets Investment Management, Llc | 24.447 | 81,22 | 308 | 108,84 | ||||
| 2026-02-12 | 13F | Counterpoint Mutual Funds LLC | 0 | -100,00 | 0 | |||||
| 2026-02-09 | 13F | Shufro Rose & Co Llc | 15.043 | -20,66 | 189 | -14,09 | ||||
| 2026-01-09 | 13F | SG Americas Securities, LLC | 60.788 | -7,59 | 1 | |||||
| 2026-02-09 | 13F | Jefferies Financial Group Inc. | Call | 35.000 | 0,00 | 441 | 8,91 | |||
| 2026-02-17 | 13F | Tricadia Capital Management, LLC | 450.000 | 5.666 | ||||||
| 2026-02-09 | 13F | Jefferies Financial Group Inc. | 18.491 | 233 | ||||||
| 2026-02-13 | 13F | Liberty 77 Capital L.P. | 74.999.994 | 0,00 | 944.250 | 9,00 | ||||
| 2026-04-14 | 13F | Bay Harbor Wealth Management, LLC | 16 | 45,45 | 0 | |||||
| 2026-02-10 | 13F | Envestnet Asset Management Inc | 128.782 | -7,16 | 1.621 | 1,19 | ||||
| 2026-04-14 | 13F | Nbc Securities, Inc. | 892 | 0,00 | 12 | 0,00 | ||||
| 2025-11-14 | 13F | Community Bank, N.A. | 0 | -100,00 | 0 | |||||
| 2026-02-17 | 13F | Atom Investors LP | 0 | -100,00 | 0 | |||||
| 2026-04-13 | 13F | Clayton Financial Group LLC | 3.333 | 0,00 | 44 | 4,88 | ||||
| 2026-01-29 | 13F | D.a. Davidson & Co. | 277.250 | 8,20 | 3.491 | 17,95 | ||||
| 2026-02-17 | 13F | Advisor Group Holdings, Inc. | 34.722 | -28,67 | 437 | -27,17 | ||||
| 2026-02-11 | 13F | Simplex Trading, Llc | 0 | -100,00 | 0 | |||||
| 2025-11-04 | 13F | Tsfg, Llc | 0 | -100,00 | 0 | |||||
| 2026-02-13 | 13F | Quarry LP | 0 | -100,00 | 0 | |||||
| 2026-02-13 | 13F | Caitong International Asset Management Co., Ltd | 0 | -100,00 | 0 | |||||
| 2026-02-05 | 13F | Northwestern Mutual Investment Management Company, Llc | 66.975 | 0,42 | 843 | 9,48 | ||||
| 2026-02-13 | 13F | Glen Eagle Advisors, LLC | 381 | 0,00 | 5 | 0,00 | ||||
| 2026-02-13 | 13F | Hudson Bay Capital Management LP | 34.689.439 | 0,00 | 436.740 | 9,00 | ||||
| 2026-01-29 | 13F | UBS Group AG | 1.863.307 | -41,63 | 23.459 | -36,38 | ||||
| 2026-02-13 | 13F | Smartleaf Asset Management LLC | 865 | 0,23 | 11 | 11,11 | ||||
| 2026-02-17 | 13F | Schonfeld Strategic Advisors LLC | 529.662 | 59,00 | 6.668 | 73,33 | ||||
| 2026-02-17 | 13F | MIRAE ASSET GLOBAL ETFS HOLDINGS Ltd. | 141.177 | -0,04 | 1.777 | 8,95 | ||||
| 2025-11-13 | 13F | Bnp Paribas Arbitrage, Sa | Put | 0 | -100,00 | 0 | -100,00 | |||
| 2026-02-02 | 13F | Millstone Evans Group, LLC | 1.255 | 0,00 | 16 | 7,14 | ||||
| 2025-11-14 | 13F | Numerai GP LLC | 0 | -100,00 | 0 | |||||
| 2025-11-14 | 13F | Cubist Systematic Strategies, LLC | Put | 14.700 | -20,54 | 170 | -13,78 | |||
| 2025-11-14 | 13F | Cubist Systematic Strategies, LLC | 26.135 | 302 | ||||||
| 2025-11-12 | 13F | HAP Trading, LLC | Put | 152.000 | 78 | |||||
| 2026-02-10 | 13F | Angel Oak Capital Advisors, LLC | 25.000 | 0,00 | 315 | 9,03 | ||||
| 2026-02-12 | 13F | Campbell & CO Investment Adviser LLC | 24.041 | -22,50 | 303 | -15,64 | ||||
| 2025-11-14 | 13F | Natixis | 0 | -100,00 | 0 | |||||
| 2025-11-12 | 13F | HAP Trading, LLC | 49.740 | 574 | ||||||
| 2026-01-27 | 13F | Forum Financial Management, LP | 18.087 | 0,11 | 228 | 9,13 | ||||
| 2026-02-13 | 13F | Walleye Capital LLC | Put | 53.000 | -0,19 | 667 | 8,81 | |||
| 2026-02-12 | 13F | Nuveen, LLC | 673.644 | -3,05 | 8.481 | 5,68 | ||||
| 2026-02-13 | 13F | Walleye Capital LLC | 250.855 | 220,09 | 3.158 | 248,95 | ||||
| 2026-02-13 | 13F | Walleye Capital LLC | Call | 51.500 | -42,52 | 648 | -37,33 | |||
| 2025-10-21 | 13F | American National Bank | 0 | -100,00 | 0 | |||||
| 2026-04-07 | 13F | Signaturefd, Llc | 50.605 | 0,00 | 666 | 4,55 | ||||
| 2026-02-12 | 13F | CIBC Private Wealth Group, LLC | 852 | 11 | ||||||
| 2026-02-13 | 13F | Kestra Advisory Services, LLC | 0 | -100,00 | 0 | |||||
| 2026-01-30 | 13F | Samalin Investment Counsel, LLC | 10.406 | 131 | ||||||
| 2026-02-17 | 13F | Kemnay Advisory Services Inc. | 3.343 | 42 | ||||||
| 2026-01-27 | 13F | Elevated Capital Advisors, LLC | 53.399 | 3,99 | 672 | 13,32 | ||||
| 2026-02-06 | 13F | Lloyd Advisory Services, LLC. | 11 | 0 | ||||||
| 2026-02-17 | 13F | Balyasny Asset Management Llc | 1.352.726 | 1.264,52 | 17.031 | 1.387,34 | ||||
| 2026-02-17 | 13F | Balyasny Asset Management Llc | Put | 14.100 | 178 | |||||
| 2026-01-29 | 13F | Dunhill Financial, LLC | 6 | 0 | ||||||
| 2026-02-06 | 13F | Pnc Financial Services Group, Inc. | 19.106 | 6,27 | 241 | 15,94 | ||||
| 2026-02-13 | 13F | MAI Capital Management | Call | 38 | 8,82 | |||||
| 2026-02-13 | 13F | MAI Capital Management | 305 | 0,00 | 4 | 0,00 | ||||
| 2026-02-11 | 13F | Curio Wealth, Llc | 590 | 8 | ||||||
| 2026-02-13 | 13F | Alberta Investment Management Corp | 314.000 | 3.953 | ||||||
| 2026-02-17 | 13F | Algert Global Llc | 334.329 | 0,00 | 4 | 33,33 | ||||
| 2026-02-17 | 13F | Millennium Management Llc | Call | 81.000 | -97,13 | 1.020 | -85,34 | |||
| 2026-02-17 | 13F | Millennium Management Llc | 6.302.606 | 825,81 | 79.350 | 909,27 | ||||
| 2026-04-06 | 13F | Versant Capital Management, Inc | 685 | 8,21 | 9 | 28,57 | ||||
| 2026-02-17 | 13F | Millennium Management Llc | Put | 96.600 | 256,46 | 1.216 | 288,50 | |||
| 2025-11-14 | 13F | Strategic Wealth Partners, Ltd. | 5.196 | -82,78 | 60 | -81,19 | ||||
| 2026-02-13 | 13F | Toroso Investments, LLC | 0 | -100,00 | 0 | |||||
| 2026-02-17 | 13F | Alliancebernstein L.p. | 7.021.175 | 7,09 | 88.397 | 16,73 | ||||
| 2026-02-09 | 13F | Legal & General Group Plc | 483.147 | -2,07 | 6.083 | 6,74 | ||||
| 2026-02-17 | 13F | Voloridge Investment Management, Llc | 0 | -100,00 | 0 | |||||
| 2026-02-04 | 13F | Pensionmark Financial Group, Llc | 43.881 | 204,24 | 167 | 0,00 | ||||
| 2026-02-06 | 13F | HighTower Advisors, LLC | 23.577 | -1,87 | 297 | 6,86 | ||||
| 2026-02-10 | 13F | Commonwealth Of Pennsylvania Public School Empls Retrmt Sys | 74.908 | -2,45 | 943 | 6,43 | ||||
| 2026-02-13 | 13F | Public Employees Retirement Association Of Colorado | 29.810 | 0,00 | 0 | |||||
| 2026-04-13 | 13F | Salem Investment Counselors Inc | 137 | 2 | ||||||
| 2026-02-13 | 13F | Healthcare Of Ontario Pension Plan Trust Fund | 295.500 | -26,12 | 3.720 | -19,48 | ||||
| 2026-02-11 | 13F | Deutsche Bank Ag\ | 242.708 | 4,87 | 3.056 | 14,29 | ||||
| 2026-02-13 | 13F | Graney & King, LLC | 1.715 | 0,00 | 22 | 10,53 | ||||
| 2026-02-09 | 13F/A | Fideuram - Intesa Sanpaolo Private Banking S.p.a. | 2.677 | 34 | ||||||
| 2026-01-21 | 13F | Yousif Capital Management, Llc | 92.620 | -1,31 | 1.171 | 8,03 | ||||
| 2026-02-17 | 13F | Imprint Wealth LLC | 0 | -100,00 | 0 | |||||
| 2026-02-17 | 13F | Steadfast Capital Management Lp | 1.911.300 | -8,76 | 24.063 | -0,54 | ||||
| 2026-02-10 | 13F | Godfrey Financial Associates, Inc. | 203 | 3 | ||||||
| 2026-02-17 | 13F | Mercer Global Advisors Inc /adv | 18.371 | 14,39 | 231 | 24,86 | ||||
| 2026-01-27 | 13F | Financial Management Professionals, Inc. | 16 | 0,00 | 0 | |||||
| 2026-02-05 | 13F | Thrivent Financial For Lutherans | 73.641 | -1,78 | 1 | |||||
| 2026-02-11 | 13F | Havemeyer Place LP | 21.840 | 275 | ||||||
| 2026-02-13 | 13F | Y-Intercept (Hong Kong) Ltd | 92.291 | 1.162 | ||||||
| 2026-01-30 | 13F | Caldwell Trust Co | 500 | 0,00 | 6 | 20,00 | ||||
| 2026-02-12 | 13F | Wealthspire Advisors, LLC | 0 | -100,00 | 0 | |||||
| 2026-02-11 | 13F | Prestige Wealth Management Group LLC | 42 | 0,00 | 1 | |||||
| 2026-02-18 | 13F | Mackenzie Financial Corp | 17.509 | -2,95 | 221 | 5,77 | ||||
| 2026-02-13 | 13F | Ubs Asset Management Americas Inc | 496.588 | -7,87 | 6.252 | 0,43 | ||||
| 2026-02-06 | 13F | Gsa Capital Partners Llp | 17.860 | 0 | ||||||
| 2026-02-12 | 13F | Dimensional Fund Advisors Lp | 6.162.628 | 5,42 | 77.589 | 14,91 | ||||
| 2026-02-17 | 13F | Graham Capital Management, L.P. | 81.531 | 13,16 | 1.026 | 23,32 | ||||
| 2026-02-13 | 13F | Citigroup Inc | Call | 200.000 | 0,00 | 2.518 | 9,00 | |||
| 2026-02-13 | 13F | Rhumbline Advisers | 907.876 | -8,47 | 11.430 | -0,23 | ||||
| 2026-02-05 | 13F | Allworth Financial LP | 10.994 | 8,58 | 138 | 18,97 | ||||
| 2026-02-13 | 13F | Citigroup Inc | 1.688.120 | -4,90 | 21.253 | 3,66 | ||||
| 2026-01-29 | 13F | IMC-Chicago, LLC | 29.936 | -62,93 | 377 | -59,66 | ||||
| 2026-02-10 | 13F | Intech Investment Management Llc | 117.964 | -59,88 | 1.485 | -56,26 | ||||
| 2026-02-12 | 13F | Xponance, Inc. | 36.995 | -13,47 | 466 | -5,68 | ||||
| 2026-01-26 | 13F | Cwm, Llc | 3.420 | -16,07 | 0 | |||||
| 2026-02-13 | 13F | Fieldview Capital Management, LLC | 226.173 | -18,80 | 2.848 | -11,50 | ||||
| 2026-02-06 | 13F | Handelsbanken Fonder AB | 99.900 | 45,84 | 1 | |||||
| 2026-02-12 | 13F | Cibc World Markets Corp | 20.111 | -46,31 | 253 | -36,27 | ||||
| 2026-02-13 | 13F | SRS Capital Advisors, Inc. | 23.866 | 51,56 | 300 | 65,75 | ||||
| 2026-02-17 | 13F | Cresset Asset Management, LLC | 10.026 | -5,15 | 126 | 3,28 | ||||
| 2026-02-06 | 13F | EverSource Wealth Advisors, LLC | 2.683 | 38,01 | 34 | 50,00 | ||||
| 2026-02-10 | 13F | BW Gestao de Investimentos Ltda. | 1.000.000 | 12.590 | ||||||
| 2026-02-12 | 13F | Miller Financial Services LLC | 28.095 | 28,13 | 354 | 39,53 | ||||
| 2026-02-12 | 13F | Swiss National Bank | 614.502 | 1,79 | 7.737 | 10,96 | ||||
| 2026-02-13 | 13F | Alyeska Investment Group, L.P. | 4.226.853 | 53.216 | ||||||
| 2026-01-30 | 13F | New York State Teachers Retirement System | 159.450 | -0,13 | 2 | 100,00 | ||||
| 2026-02-17 | 13F | Farringdon Capital, Ltd. | 0 | -100,00 | 0 | |||||
| 2026-02-18 | 13F | CacheTech Inc. | 10.810 | 0,02 | 136 | 9,68 | ||||
| 2026-02-13 | 13F | Entropy Technologies, LP | 0 | -100,00 | 0 | |||||
| 2026-02-10 | 13F/A | Northwestern Mutual Wealth Management Co | 955 | -60,13 | 12 | -55,56 | ||||
| 2026-02-06 | 13F | Profund Advisors Llc | 21.254 | 1,11 | 268 | 10,33 | ||||
| 2026-02-12 | 13F | Advocate Investing Services LLC | 46 | 1 | ||||||
| 2026-02-17 | 13F | Cape Investment Advisory, Inc. | 215 | 3 | ||||||
| 2026-02-13 | 13F | Caxton Associates Llp | 13.826 | -33,84 | 174 | -27,80 | ||||
| 2026-02-12 | 13F | Hrt Financial Lp | 0 | -100,00 | 0 | |||||
| 2026-02-13 | 13F | Mml Investors Services, Llc | 12.792 | 4,99 | 161 | 15,00 | ||||
| 2026-01-12 | 13F | CVA Family Office, LLC | 1.002 | 0,00 | 13 | 9,09 | ||||
| 2026-02-05 | 13F | Bessemer Group Inc | 1.013 | 26,78 | 0 | |||||
| 2026-01-27 | 13F | Zurcher Kantonalbank (Zurich Cantonalbank) | 62.548 | 0,00 | 787 | 9,00 | ||||
| 2026-02-12 | 13F | State Board Of Administration Of Florida Retirement System | 68.342 | 0,00 | 860 | 9,00 | ||||
| 2026-02-11 | 13F | Group One Trading, L.p. | 994.121 | -25,59 | 12.516 | -18,89 | ||||
| 2026-01-30 | 13F | Us Bancorp \de\ | 218.876 | -0,15 | 2.756 | 8,85 | ||||
| 2026-02-12 | 13F | DRW Securities, LLC | 70.674 | 162,21 | 890 | 185,85 | ||||
| 2026-02-10 | 13F | Quantbot Technologies LP | 176.138 | -68,30 | 2.218 | -65,45 | ||||
| 2025-11-05 | 13F | HighPoint Advisor Group LLC | 0 | -100,00 | 0 | |||||
| 2026-04-13 | 13F | Creative Financial Designs Inc /adv | 467 | 0,21 | 6 | 20,00 | ||||
| 2026-02-23 | 13F | Mv Capital Management, Inc. | 4 | 0,00 | 0 | |||||
| 2026-02-17 | 13F | Canada Pension Plan Investment Board | 953.000 | 11.998 | ||||||
| 2026-04-08 | 13F | Wealth Enhancement Advisory Services, Llc | 73.566 | -31,96 | 992 | -25,38 | ||||
| 2026-02-11 | 13F | IMA Wealth, Inc. | 1.846 | 0,00 | 23 | 9,52 | ||||
| 2026-02-23 | 13F | Virtu Financial LLC | 25.746 | 0 | ||||||
| 2025-10-31 | 13F | National Asset Management, Inc. | 0 | -100,00 | 0 | |||||
| 2026-04-13 | 13F | Massmutual Trust Co Fsb/adv | 283 | 0,00 | 4 | 0,00 | ||||
| 2026-02-12 | 13F | MetLife Investment Management, LLC | 305.729 | -4,98 | 3.849 | 3,58 | ||||
| 2026-01-29 | 13F | Comerica Bank | 77.023 | -5,81 | 970 | 2,65 | ||||
| 2026-02-11 | 13F | Inceptionr Llc | 87.001 | 754,04 | 1.095 | 835,90 | ||||
| 2026-02-12 | 13F | Bank Of Montreal /can/ | 36.519 | 10,35 | 460 | 20,16 | ||||
| 2026-02-17 | 13F | Keebeck Wealth Management, LLC | 33.333 | 0,00 | 420 | 9,11 | ||||
| 2026-02-17 | 13F | Trexquant Investment LP | 0 | -100,00 | 0 | |||||
| 2026-02-11 | 13F | Ameritas Investment Partners, Inc. | 79.536 | 1.001 | ||||||
| 2026-02-09 | 13F | Endeavour Capital Advisors Inc | 80.531 | 0,00 | 1.014 | 8,92 | ||||
| 2026-04-14 | 13F | Beacon Investment Advisory Services, Inc. | 2.492 | 33 | ||||||
| 2026-04-02 | 13F | Ares Financial Consulting, LLC | 194 | 0,00 | 3 | 0,00 | ||||
| 2026-02-17 | 13F | Aquatic Capital Management LLC | 118.302 | -76,71 | 1.489 | -74,62 | ||||
| 2025-11-03 | 13F | AE Wealth Management LLC | 0 | -100,00 | 0 | -100,00 | ||||
| 2026-02-17 | 13F | Captrust Financial Advisors | 20.699 | -7,36 | 261 | 0,78 | ||||
| 2025-11-21 | 13F/A | CIBC Bancorp USA Inc. | 32.405 | 374 | ||||||
| 2026-01-23 | 13F | Sage Mountain Advisors LLC | 10.267 | 0,00 | 129 | 9,32 | ||||
| 2026-02-13 | 13F | Stifel Financial Corp | 494.317 | -5,37 | 6.223 | 3,15 | ||||
| 2026-01-14 | 13F | Jfs Wealth Advisors, Llc | 225 | 35,54 | 3 | 100,00 | ||||
| 2026-02-13 | 13F | Squarepoint Ops LLC | 0 | -100,00 | 0 | -100,00 | ||||
| 2026-02-17 | 13F | XTX Topco Ltd | 248.787 | 273,12 | 3.132 | 306,75 | ||||
| 2025-10-24 | 13F | Avion Wealth | 0 | -100,00 | 0 | |||||
| 2026-01-23 | 13F | Sage Investment Counsel LLC | 41.400 | -37,74 | 521 | -32,07 | ||||
| 2026-02-09 | 13F | Hartland & Co., LLC | 843 | 225,48 | 11 | 400,00 | ||||
| 2026-02-12 | 13F | Cloud Capital Management, LLC | 0 | -100,00 | 0 | |||||
| 2026-02-06 | 13F | Tortoise Investment Management, LLC | 0 | -100,00 | 0 | |||||
| 2025-11-14 | 13F | Teza Capital Management LLC | 0 | -100,00 | 0 | |||||
| 2026-01-28 | 13F | N.E.W. Advisory Services LLC | 83 | 0,00 | 1 | |||||
| 2026-02-17 | 13F | Parallax Volatility Advisers, L.P. | 0 | -100,00 | 0 | |||||
| 2026-02-02 | 13F | Principal Financial Group Inc | 648.623 | -3,87 | 8.166 | 4,79 | ||||
| 2025-11-17 | 13F | Financial Engines Advisors L.L.C. | 0 | -100,00 | 0 | |||||
| 2026-01-28 | 13F | Arizona State Retirement System | 87.825 | -4,66 | 1.106 | 3,95 | ||||
| 2026-01-27 | 13F | Bayforest Capital Ltd | 0 | -100,00 | 0 | -100,00 | ||||
| 2026-01-30 | 13F | Sigma Planning Corp | 14.056 | -13,90 | 177 | -6,38 | ||||
| 2026-01-06 | 13F | Advance Capital Management, Inc. | 12.479 | 0,00 | 157 | 9,03 | ||||
| 2026-02-11 | 13F | Cerity Partners LLC | 1.794.782 | -1,87 | 22.596 | 6,97 | ||||
| 2025-11-14 | 13F | Empower Advisory Group, LLC | 0 | -100,00 | 0 | |||||
| 2026-01-23 | 13F | Private Wealth Management Group, LLC | 226 | 0,00 | 3 | 0,00 | ||||
| 2026-02-11 | 13F | Parallel Advisors, LLC | 835 | -38,38 | 11 | -33,33 | ||||
| 2026-02-12 | 13F | Pinnacle Holdings, LLC | 108.245 | 0,00 | 1.363 | 8,96 | ||||
| 2026-02-10 | 13F | Mutual Of America Capital Management Llc | 124.579 | -9,85 | 1.568 | -1,63 | ||||
| 2026-02-11 | 13F | Rise Advisors, LLC | 0 | -100,00 | 0 | -100,00 | ||||
| 2026-02-17 | 13F | Sessa Capital IM, L.P. | 32.119 | 0,00 | 404 | 9,19 | ||||
| 2025-11-17 | 13F | PharVision Advisers, LLC | 0 | -100,00 | 0 | -100,00 | ||||
| 2026-01-16 | 13F | Louisiana State Employees Retirement System | 82.800 | -0,60 | 1.042 | 8,32 | ||||
| 2026-02-13 | 13F | Bayview Asset Management, Llc | 0 | -100,00 | 0 | |||||
| 2026-01-16 | 13F | Ronald Blue Trust, Inc. | 50 | 0,00 | 1 | |||||
| 2026-02-10 | 13F | Root Financial Partners, LLC | 677 | 71,39 | 9 | 100,00 | ||||
| 2026-02-09 | 13F | New Age Alpha Advisors, LLC | 42.633 | 0,19 | 537 | 9,16 | ||||
| 2026-02-11 | 13F | Los Angeles Capital Management Llc | 1.363 | 15 | ||||||
| 2026-02-17 | 13F | Creative Planning | 75.718 | -32,64 | 953 | -26,58 | ||||
| 2026-02-17 | 13F | Parallax Volatility Advisers, L.P. | Put | 100.000 | 0,00 | 1.259 | 9,00 | |||
| 2026-02-17 | 13F | Capital Fund Management S.a. | Put | 207.800 | -8,50 | 2.616 | -0,27 | |||
| 2026-02-17 | 13F | Parallax Volatility Advisers, L.P. | Call | 351.600 | 0,00 | 4.427 | 9,01 | |||
| 2026-02-17 | 13F | Capital Fund Management S.a. | Call | 167.261 | -22,19 | 2.106 | -15,19 | |||
| 2026-02-13 | 13F | American Century Companies Inc | 74.811 | 7,42 | 942 | 17,04 | ||||
| 2026-02-13 | 13F | Financial Freedom, LLC | 2.932 | 0,07 | 37 | 9,09 | ||||
| 2026-02-06 | 13F | ProShare Advisors LLC | 67.415 | -47,91 | 849 | -43,24 | ||||
| 2026-02-02 | 13F | Addison Capital Co | 45.093 | 0,00 | 568 | 9,04 | ||||
| 2026-02-17 | 13F | Raymond James Financial Inc | 68.963 | -32,88 | 868 | -26,81 | ||||
| 2026-02-13 | 13F | Parkside Financial Bank & Trust | 222 | -3,06 | 3 | 0,00 | ||||
| 2026-02-02 | 13F | Strs Ohio | 12.700 | 0,00 | 160 | 8,90 | ||||
| 2026-02-05 | 13F | HFM Investment Advisors, LLC | 9 | 0,00 | 0 | |||||
| 2026-02-12 | 13F | California Public Employees Retirement System | 404.609 | -0,07 | 5.094 | 8,94 | ||||
| 2026-02-19 | 13F | CI Private Wealth, LLC | 49.175 | 4,54 | 593 | 9,02 | ||||
| 2026-02-04 | 13F | Oregon Public Employees Retirement Fund | 59.493 | -1,33 | 749 | 7,61 | ||||
| 2026-02-17 | 13F | Freestone Grove Partners LP | 0 | -100,00 | 0 | -100,00 | ||||
| 2026-02-11 | 13F | Allianz Asset Management GmbH | 0 | -100,00 | 0 | |||||
| 2026-02-12 | 13F | Commonwealth Equity Services, Llc | 70.614 | -4,70 | 889 | |||||
| 2025-11-14 | 13F | Wolverine Trading, Llc | 0 | -100,00 | 0 | -100,00 | ||||
| 2025-11-14 | 13F | Shelton Capital Management | 0 | -100,00 | 0 | |||||
| 2026-01-14 | 13F | Hourglass Capital, Llc | 127.000 | 13,39 | 1.599 | 23,59 | ||||
| 2026-01-22 | 13F | Bfsg, Llc | 24.516 | 0,62 | 309 | 9,61 | ||||
| 2026-02-09 | 13F | Geode Capital Management, Llc | 7.487.034 | 6,65 | 94.277 | 16,26 | ||||
| 2026-04-08 | 13F | Thompson Investment Management, Inc. | 521.937 | 4,15 | 6.874 | 8,94 | ||||
| 2025-11-13 | 13F | Quinn Opportunity Partners LLC | 0 | -100,00 | 0 | |||||
| 2026-02-11 | 13F | Janney Montgomery Scott LLC | 44.527 | -11,09 | 1 | |||||
| 2026-02-17 | 13F | Fwl Investment Management, Llc | 0 | -100,00 | 0 | |||||
| 2026-01-14 | 13F | Spire Wealth Management | 2.100 | -76,53 | 26 | -74,76 | ||||
| 2026-01-20 | 13F | Harbor Capital Advisors, Inc. | 2.633 | -1,68 | 0 | |||||
| 2026-02-13 | 13F | Umb Bank N A/mo | 3.766 | 23,60 | 47 | 34,29 | ||||
| 2026-02-09 | 13F | Huntington National Bank | 333 | -8,77 | 4 | 0,00 | ||||
| 2026-02-17 | 13F | Citadel Advisors Llc | Put | 1.071.497 | -6,49 | 13.490 | 1,93 | |||
| 2025-11-14 | 13F | Texas Permanent School Fund | 0 | -100,00 | 0 | -100,00 | ||||
| 2026-02-17 | 13F | Citadel Advisors Llc | Call | 1.609.666 | 10,87 | 20.266 | 20,86 | |||
| 2026-02-17 | 13F | Citadel Advisors Llc | 4.639.262 | 272,26 | 58.408 | 305,78 | ||||
| 2026-02-13 | 13F | Walleye Trading LLC | Put | 715.200 | 28,73 | 9.004 | 40,31 | |||
| 2026-02-13 | 13F | Walleye Trading LLC | Call | 216.900 | -30,10 | 2.731 | -23,81 | |||
| 2026-02-13 | 13F | Walleye Trading LLC | 231.008 | 20,02 | 2.908 | 30,81 | ||||
| 2026-01-26 | 13F | Private Trust Co Na | 100 | 0,00 | 1 | 0,00 | ||||
| 2026-02-12 | 13F | Federated Hermes, Inc. | 1.009.349 | 17,53 | 12.708 | 28,12 | ||||
| 2026-02-17 | 13F | Engineers Gate Manager LP | 0 | -100,00 | 0 | |||||
| 2026-02-13 | 13F | Neuberger Berman Group LLC | 20.375 | -4,23 | 257 | 4,49 | ||||
| 2026-02-03 | 13F | Farmers & Merchants Investments Inc | 226 | 0,00 | 3 | 0,00 | ||||
| 2025-11-06 | 13F | Whipplewood Advisors, LLC | 0 | -100,00 | 0 | |||||
| 2026-01-26 | 13F | Paradigm Financial Partners, Llc | 10.517 | -95,66 | 132 | -95,29 | ||||
| 2026-02-03 | 13F | Sequoia Financial Advisors, LLC | 13.256 | 167 | ||||||
| 2026-02-05 | 13F | Elyxium Wealth, LLC | 834 | 10 | ||||||
| 2026-02-02 | 13F | Cornerstone Planning Group LLC | 44 | 0,00 | 1 | |||||
| 2026-01-27 | 13F | TD Waterhouse Canada Inc. | 23.586 | 2,39 | 297 | 9,63 | ||||
| 2026-02-04 | 13F | Ameritas Advisory Services, LLC | 0 | -100,00 | 0 | |||||
| 2026-02-10 | 13F | New Mexico Educational Retirement Board | 62.466 | 0,00 | 1 | |||||
| 2026-02-10 | 13F | Nomura Asset Management Co Ltd | 5.900 | 0,00 | 74 | 8,82 | ||||
| 2026-02-13 | 13F | Inspire Advisors, LLC | 16.858 | -3,09 | 212 | 6,00 | ||||
| 2026-02-12 | 13F | Principal Securities, Inc. | 0 | -100,00 | 0 | -100,00 | ||||
| 2026-01-08 | 13F | True Wealth Design, LLC | 0 | -100,00 | 0 | |||||
| 2026-02-10 | 13F | Td Asset Management Inc | 174.810 | 12,72 | 2.201 | 22,84 | ||||
| 2026-02-17 | 13F | RMB Capital Management, LLC | 299.802 | -0,01 | 3.775 | 9,01 | ||||
| 2026-02-10 | 13F | Bank of New York Mellon Corp | 2.245.437 | 7,40 | 28.270 | 17,07 | ||||
| 2026-02-17 | 13F | Two Sigma Advisers, Lp | 294.876 | -26,87 | 3.712 | -20,27 | ||||
| 2026-02-13 | 13F | Charles Schwab Investment Management Inc | 3.941.119 | -0,34 | 49.619 | 8,64 | ||||
| 2026-02-12 | 13F | Hm Payson & Co | 0 | -100,00 | 0 | |||||
| 2026-02-09 | 13F | Atlantic Trust, LLC | 271 | 24,88 | 3 | 50,00 | ||||
| 2026-02-17 | 13F | California State Teachers Retirement System | 295.169 | 2,68 | 3.716 | 11,93 | ||||
| 2026-02-10 | 13F | Natixis Advisors, L.p. | 20.788 | -43,83 | 0 | |||||
| 2026-02-12 | 13F | Voya Investment Management Llc | 56.147 | -1,88 | 707 | 6,97 | ||||
| 2026-04-07 | 13F | CoreCap Advisors, LLC | 21 | 0,00 | 0 | |||||
| 2026-02-06 | 13F | Global Retirement Partners, LLC | Put | 0 | -100,00 | 0 | -100,00 | |||
| 2026-02-09 | 13F | Harbour Investments, Inc. | 2.086 | 16,67 | 26 | 30,00 | ||||
| 2025-11-13 | 13F | Css Llc/il | Put | 0 | -100,00 | 0 | ||||
| 2026-01-27 | 13F | Friedenthal Financial | 170 | 0,00 | 2 | 100,00 | ||||
| 2026-04-03 | 13F | Investors Research Corp | 20.534 | -6,52 | 270 | -2,17 | ||||
| 2026-02-12 | 13F | Steward Partners Investment Advisory, Llc | 5.926 | -52,29 | 75 | -48,25 | ||||
| 2026-02-17 | 13F | Royal Bank Of Canada | 326.879 | -87,37 | 4.116 | -86,23 | ||||
| 2026-01-28 | 13F | Geneos Wealth Management Inc. | 3.778 | 0,00 | 48 | 9,30 | ||||
| 2026-02-17 | 13F | Nomura Holdings Inc | Put | 200.000 | 2.518 | |||||
| 2026-02-17 | 13F | Blair William & Co/il | 52.541 | 7,52 | 661 | 17,20 | ||||
| 2025-11-13 | 13F | Css Llc/il | Call | 0 | -100,00 | 0 | ||||
| 2026-01-28 | 13F | WPG Advisers, LLC | 625 | 0,00 | 8 | 0,00 | ||||
| 2026-01-07 | 13F | Harbor Investment Advisory, Llc | 633 | 0,00 | 8 | 0,00 | ||||
| 2026-02-11 | 13F | LPL Financial LLC | 103.232 | -39,70 | 1.300 | -34,29 | ||||
| 2026-01-28 | 13F | Southern Capital Advisors, Llc | 18.664 | 0,03 | 235 | 8,84 | ||||
| 2026-01-20 | 13F | Wall Street Access Asset Management, LLC | 894 | 0,00 | 11 | 10,00 | ||||
| 2026-01-28 | 13F | Klp Kapitalforvaltning As | 66.313 | 0,00 | 835 | 9,02 | ||||
| 2026-02-11 | 13F | Hughes Financial Services, LLC | 3 | 0 | ||||||
| 2026-01-26 | 13F | Main Street Group, LTD | 0 | -100,00 | 0 | |||||
| 2026-01-28 | 13F | M&t Bank Corp | 0 | -100,00 | 0 | |||||
| 2026-02-17 | 13F | Quantinno Capital Management LP | 14.281 | -22,70 | 180 | -15,96 | ||||
| 2026-02-17 | 13F | Jump Financial, LLC | 0 | -100,00 | 0 | -100,00 | ||||
| 2026-02-17 | 13F | AYAL Capital Advisors Ltd | Call | 0 | -100,00 | 0 | ||||
| 2026-02-17 | 13F | Quadrature Capital Ltd | 0 | -100,00 | 0 | |||||
| 2026-01-27 | 13F | Hennessy Advisors Inc | 270.000 | -0,74 | 3.399 | 8,21 | ||||
| 2026-04-07 | 13F | Farther Finance Advisors, LLC | 15.956 | 701,00 | 213 | 752,00 | ||||
| 2026-04-08 | 13F | Wealth Enhancement Trust Services, Inc. | 3.575 | 0,00 | 47 | 4,44 | ||||
| 2026-02-13 | 13F | Pathstone Holdings, LLC | 77.887 | 26,13 | 981 | 37,45 | ||||
| 2026-02-02 | 13F | Salzhauer Michael | Call | 0 | -100,00 | 0 | ||||
| 2026-02-10 | 13F | Goldman Sachs Group Inc | 4.626.146 | 60,90 | 58.243 | 75,38 | ||||
| 2026-02-17 | 13F | Janus Henderson Group Plc | 138.222 | 0,00 | 1.740 | 8,89 | ||||
| 2026-02-17 | 13F | Fmr Llc | 26.862 | 74,35 | 338 | 90,96 | ||||
| 2025-11-14 | 13F | Squarepoint Ops LLC | Put | 0 | -100,00 | 0 | -100,00 |