Grundlæggende statistik
| Institutionelle aktier (lange) | 97.382.310 - 100,01% (ex 13D/G) - change of -8,81MM shares -8,30% MRQ |
| Institutionel værdi (lang) | $ 3.324.967 USD ($1000) |
Institutionelt ejerskab og aktionærer
First Interstate BancSystem, Inc. (US:FIBK) har 279 institutionelle ejere og aktionærer, der har indsendt 13D/G- eller 13F-formularer til Securities Exchange Commission (SEC). Disse institutioner har i alt 97,382,310 aktier. Største aktionærer omfatter BlackRock, Inc., Vanguard Group Inc, Wellington Management Group Llp, State Street Corp, Dimensional Fund Advisors Lp, Fmr Llc, First Interstate Bank, HoldCo Asset Management, L.P., Capital International Investors, and Franklin Resources Inc .
First Interstate BancSystem, Inc. (NasdaqGS:FIBK) institutionel ejerskabsstruktur viser aktuelle positioner i virksomheden efter institutioner og fonde, samt seneste ændringer i positionsstørrelse. Større aktionærer kan omfatte individuelle investorer, investeringsforeninger, hedgefonde eller institutioner. Skema 13D angiver, at investoren besidder (eller besidder) mere end 5 % af virksomheden og har til hensigt (eller har til hensigt at) aktivt at forfølge en ændring i forretningsstrategi. Skema 13G indikerer en passiv investering på over 5%.
The share price as of April 30, 2026 is 35,49 / share. Previously, on May 2, 2025, the share price was 27,05 / share. This represents an increase of 31,20% over that period.

Fondens stemningsscore
Fund Sentiment Score (fka Ownership Accumulation Score) finder de aktier, der bliver mest købt af fonde. Det er resultatet af en sofistikeret, multi-faktor kvantitativ model, der identificerer virksomheder med de højeste niveauer af institutionel akkumulering. Scoringsmodellen bruger en kombination af den samlede stigning i oplyste ejere, ændringerne i porteføljeallokeringer i disse ejere og andre målinger. Tallet går fra 0 til 100, hvor højere tal indikerer et højere niveau af akkumulering for sine jævnaldrende, og 50 er gennemsnittet.
Opdateringsfrekvens: Dagligt
Se Ownership Explorer, som giver en liste over højest rangerende virksomheder.
AI+ Ask Fintel’s AI assistant about First Interstate BancSystem, Inc..
Select a question to share a public post with an AI-crafted answer.
Thinking of good questions…
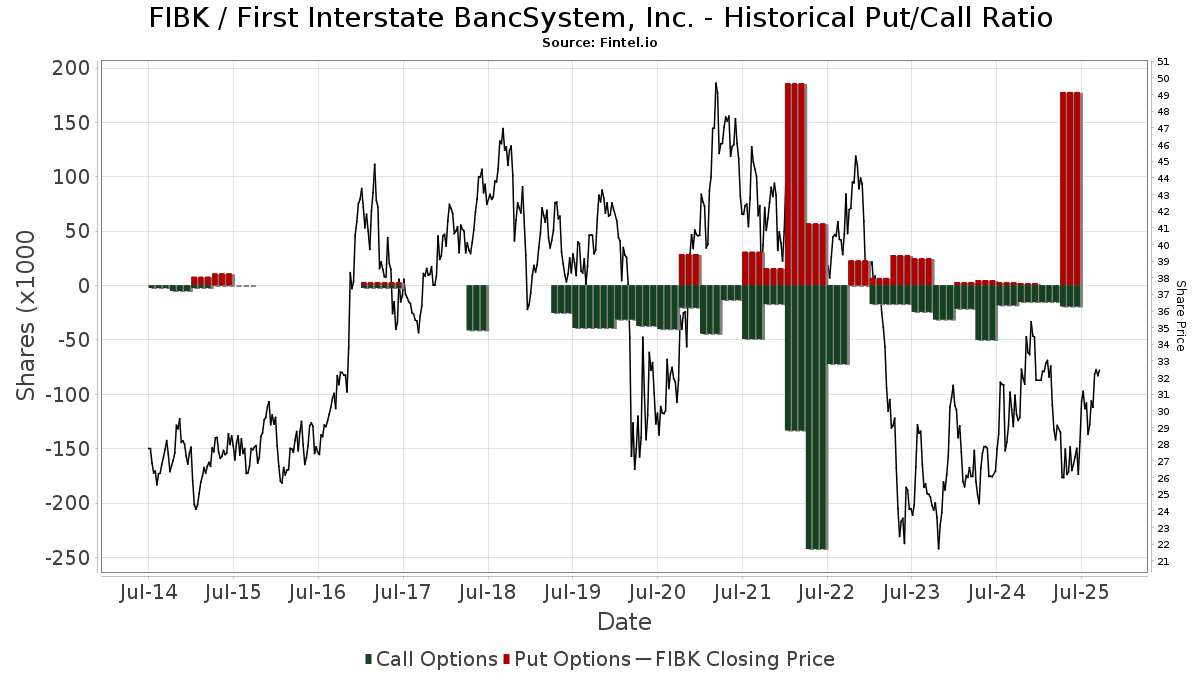
Institutionel Put/Call-forhold
Ud over at indberette standardaktie- og gældsudstedelser skal institutter med mere end 100 mill. aktiver under forvaltning også oplyse deres put- og call-optionsbeholdninger. Da salgsoptioner generelt indikerer negativ stemning, og købsoptioner indikerer positiv stemning, kan vi få en fornemmelse af den overordnede institutionelle stemning ved at plotte forholdet mellem put og kald. Diagrammet til højre viser det historiske put/call-forhold for dette instrument.
Brug af Put/Call Ratio som en indikator for investorernes stemning overvinder en af de vigtigste mangler ved at bruge totalt institutionelt ejerskab, som er, at en betydelig mængde af aktiver under forvaltning investeres passivt for at spore indekser. Passivt forvaltede fonde køber typisk ikke optioner, så indikatoren for put/call-forholdet følger mere nøje følelsen af aktivt forvaltede fonde.
13D/G-arkivering
Vi præsenterer 13D/G ansøgninger separat fra 13F ansøgninger på grund af den forskellige behandling af SEC. 13D/G-ansøgninger kan indgives af grupper af investorer (med én ledende), hvorimod 13F-ansøgninger ikke kan. Dette resulterer i situationer, hvor en investor kan indsende en 13D/G, der rapporterer én værdi for de samlede aktier (der repræsenterer alle de aktier, der ejes af investorgruppen), men derefter indsender en 13F, der rapporterer en anden værdi for de samlede aktier (der udelukkende repræsenterer deres egne) ejendomsret). Det betyder, at aktieejerskab af 13D/G-arkiver og 13F-arkiveringer ofte ikke er direkte sammenlignelige, så vi præsenterer dem separat.
Bemærk: Fra den 16. maj 2021 viser vi ikke længere ejere, der ikke har indsendt en 13D/G inden for det seneste år. Tidligere viste vi den fulde historie af 13D/G-arkiver. Generelt skal enheder, der er forpligtet til at indgive 13D/G-ansøgninger, indgive mindst årligt, før de indsender en afsluttende ansøgning. Dog forlader fonde nogle gange positioner uden at indsende en afsluttende ansøgning (dvs. de afvikler), så visning af den fulde historie resulterede nogle gange i forvirring om det nuværende ejerskab. For at undgå forvirring viser vi nu kun 'aktuelle' ejere - det vil sige - ejere, der har anmeldt inden for det seneste år.
Upgrade to unlock premium data.
| Fil dato | Form | Investor | Forrige Aktier |
Seneste Aktier |
Δ Aktier (Procent) |
Ejendomsret (Procent) |
Δ Ejerskab (Procent) |
|
|---|---|---|---|---|---|---|---|---|
| 2026-04-29 | VANGUARD PORTFOLIO MANAGEMENT LLC | 5,523,702 | 5.46 | |||||
| 2026-03-26 | VANGUARD GROUP INC | 10,119,518 | 0 | -100.00 | 0.00 | -100.00 | ||
| 2026-02-09 | STATE STREET CORP | 5,482,245 | 5.30 | |||||
| 2026-01-08 | BlackRock, Inc. | 6,594,993 | 13,290,004 | 101.52 | 12.90 | 104.76 | ||
| 2025-11-12 | WELLINGTON MANAGEMENT GROUP LLP | 5,915,425 | 5.60 | |||||
| 2025-11-04 | FRANKLIN MUTUAL ADVISERS LLC | 5,384,069 | 4,222,302 | -21.58 | 4.00 | -21.57 | ||
| 2025-08-06 | FMR LLC | 6,786,334 | 5,210,135 | -23.23 | 5.00 | -23.08 | ||
| 2025-07-15 | DIMENSIONAL FUND ADVISORS LP | 1,818,699 | 5,416,568 | 197.83 | 5.20 | 9.01 |
13F og NPORT arkivering
Detaljer om 13F-arkivering er gratis. Detaljer om NP-ansøgninger kræver et premium-medlemskab. Grønne rækker angiver nye positioner. Røde rækker angiver lukkede positioner. Klik på linket ikon for at se den fulde transaktionshistorik.
Opgrader
for at låse premium-data op og eksportere til Excel ![]() .
.
| Fil dato | Kilde | Investor | Type | Gennemsnitlig pris (Øst) |
Aktier | Δ Aktier (%) |
Rapporteret Værdi ($1000) |
Δ Værdi (%) |
Port Alloc (%) |
|
|---|---|---|---|---|---|---|---|---|---|---|
| 2026-02-17 | 13F | Quantinno Capital Management LP | 16.815 | 56,80 | 582 | 70,38 | ||||
| 2026-02-12 | 13F | Johnson Financial Group, Inc. | 74 | 0,00 | 3 | 0,00 | ||||
| 2026-02-06 | 13F | EverSource Wealth Advisors, LLC | 1.784 | 16,22 | 62 | 27,08 | ||||
| 2026-02-17 | 13F | XTX Topco Ltd | 48.083 | 1.664 | ||||||
| 2026-02-12 | 13F | Wealthspire Advisors, LLC | 0 | -100,00 | 0 | |||||
| 2026-04-30 | 13F | ARGA Investment Management, LP | 12.411 | 415 | ||||||
| 2026-02-17 | 13F | Cambria Investment Management, L.P. | 245.436 | -13,88 | 8.492 | -6,50 | ||||
| 2026-02-12 | 13F | CIBC Private Wealth Group, LLC | 20 | -98,76 | 1 | -100,00 | ||||
| 2026-02-12 | 13F | JPL Wealth Management, LLC | 0 | -100,00 | 0 | |||||
| 2026-02-17 | 13F | Price T Rowe Associates Inc /md/ | 80.087 | 3,87 | 3 | 0,00 | ||||
| 2026-04-27 | 13F | Allied Investment Advisors, LLC | 14.078 | -9,76 | 470 | -12,80 | ||||
| 2026-02-17 | 13F | Citadel Advisors Llc | Put | 0 | -100,00 | 0 | ||||
| 2026-02-05 | 13F | Gabelli Funds Llc | 15.698 | 0,00 | 543 | 8,60 | ||||
| 2026-02-17 | 13F | Aqr Capital Management Llc | 168.281 | 10,20 | 5.823 | 19,65 | ||||
| 2026-02-12 | 13F | Commonwealth Equity Services, Llc | 46.809 | -17,60 | 1.620 | 161.800,00 | ||||
| 2026-02-12 | 13F | Ensign Peak Advisors, Inc | 7.968 | -70,01 | 276 | -67,49 | ||||
| 2026-02-17 | 13F | Balyasny Asset Management Llc | 17.147 | -98,73 | 593 | -98,62 | ||||
| 2026-01-29 | 13F | D.a. Davidson & Co. | 28.186 | -10,79 | 975 | -3,08 | ||||
| 2026-02-17 | 13F | Creative Planning | 109.661 | 67,54 | 3.794 | 81,88 | ||||
| 2026-02-17 | 13F | Kemnay Advisory Services Inc. | 210 | 7 | ||||||
| 2026-02-02 | 13F | VELA Investment Management, LLC | 11.501 | 0,00 | 398 | 8,47 | ||||
| 2026-02-09 | 13F | Jefferies Financial Group Inc. | 7.239 | 250 | ||||||
| 2026-02-17 | 13F | Citadel Advisors Llc | 200.815 | 938,66 | 6.948 | 1.027,92 | ||||
| 2026-02-17 | 13F | Man Group plc | 61.591 | 2.131 | ||||||
| 2026-02-17 | 13F | Maryland State Retirement & Pension System | 13.044 | 451 | ||||||
| 2025-11-14 | 13F | Walleye Capital LLC | 0 | -100,00 | 0 | |||||
| 2026-02-17 | 13F | Raymond James Financial Inc | 328.021 | 2,45 | 11.526 | 12,97 | ||||
| 2026-02-17 | 13F | Voloridge Investment Management, Llc | 0 | -100,00 | 0 | |||||
| 2026-02-13 | 13F | Cladis Investment Advisory, LLC | 87.850 | -0,78 | 3.040 | 7,73 | ||||
| 2025-11-14 | 13F | Mount Yale Investment Advisors, LLC | 0 | -100,00 | 0 | |||||
| 2026-04-29 | 13F | Oregon Public Employees Retirement Fund | 20.100 | -1,95 | 671 | -5,36 | ||||
| 2026-01-29 | 13F | Dunhill Financial, LLC | 2 | 0 | ||||||
| 2026-02-13 | 13F | Manufacturers Life Insurance Company, The | 0 | -100,00 | 0 | |||||
| 2026-02-13 | 13F | Brown Advisory Inc | 719.667 | -22,60 | 24.900 | -15,97 | ||||
| 2026-01-23 | 13F | Assetmark, Inc | 100 | 0,00 | 3 | 0,00 | ||||
| 2026-02-17 | 13F | MIRAE ASSET GLOBAL ETFS HOLDINGS Ltd. | 41.550 | 0,11 | 1.438 | 8,70 | ||||
| 2026-04-17 | 13F | Vermillion Wealth Management, Inc. | 8 | 0 | ||||||
| 2026-04-30 | 13F | Granite Investment Partners, LLC | 172.335 | 3,06 | 5.756 | -0,54 | ||||
| 2026-02-14 | 13F | American Trust | 28.570 | 0,00 | 989 | 8,57 | ||||
| 2026-04-30 | 13F | Private Trust Co Na | 41 | 0,00 | 1 | 0,00 | ||||
| 2026-02-13 | 13F | Prudential Financial Inc | 83.985 | 624,70 | 2.906 | 687,26 | ||||
| 2026-04-21 | 13F | Davidson Investment Advisors | 402.384 | -16,44 | 11.528 | -30,81 | ||||
| 2026-02-10 | 13F | Bnp Paribas Arbitrage, Sa | 20.600 | -33,42 | 713 | -27,79 | ||||
| 2026-04-06 | 13F | GAMMA Investing LLC | 1.896 | 21,85 | 63 | 18,87 | ||||
| 2026-02-17 | 13F | Numerai GP LLC | 17.421 | -38,15 | 603 | -32,89 | ||||
| 2026-02-17 | 13F | Amundi | 13.256 | 459 | ||||||
| 2026-02-17 | 13F | Susquehanna International Group, Llp | 55.865 | -68,29 | 1.933 | -65,59 | ||||
| 2026-02-17 | 13F | Susquehanna International Group, Llp | Call | 13.900 | 8,59 | 481 | 17,94 | |||
| 2026-04-27 | 13F | New York State Teachers Retirement System | 16.789 | -14,90 | 1 | |||||
| 2026-02-13 | 13F | Smartleaf Asset Management LLC | 315 | 9,76 | 11 | 22,22 | ||||
| 2026-04-23 | 13F | CWM Advisors, LLC | 15.181 | -16,83 | 507 | -19,65 | ||||
| 2026-02-05 | 13F | Plante Moran Financial Advisors, LLC | 335 | 12 | ||||||
| 2026-04-28 | 13F | BW Gestao de Investimentos Ltda. | 0 | -100,00 | 0 | |||||
| 2026-02-17 | 13F | Fmr Llc | 4.736.691 | -2,81 | 163.890 | 5,51 | ||||
| 2026-02-17 | 13F | Northern Trust Corp | 871.651 | -0,53 | 30.159 | 7,99 | ||||
| 2026-04-07 | 13F | Signaturefd, Llc | 6.864 | 0,15 | 229 | -3,38 | ||||
| 2026-04-29 | 13F | Police & Firemen's Retirement System of New Jersey | 23.723 | 0,00 | 792 | -3,41 | ||||
| 2026-02-13 | 13F | Public Employees Retirement Association Of Colorado | 14.478 | 0,00 | 1 | |||||
| 2026-04-30 | 13F | Hsbc Holdings Plc | 67.624 | 10,71 | 2.289 | 7,57 | ||||
| 2026-02-10 | 13F | Goldman Sachs Group Inc | 759.629 | 39,83 | 26.283 | 51,81 | ||||
| 2026-02-18 | 13F | State of Tennessee, Treasury Department | 19.865 | 705 | ||||||
| 2026-02-13 | 13F | Sei Investments Co | 433.462 | 19,31 | 14.998 | 29,53 | ||||
| 2026-04-28 | 13F | SBI Securities Co., Ltd. | 15 | 87,50 | 1 | |||||
| 2026-04-07 | 13F | Farther Finance Advisors, LLC | 564 | 20,00 | 19 | 12,50 | ||||
| 2025-11-14 | 13F | Wood Tarver Financial Group, LLC | 0 | -100,00 | 0 | |||||
| 2026-02-13 | 13F | Rhumbline Advisers | 249.535 | 82,56 | 8.634 | 98,19 | ||||
| 2026-02-13 | 13F | Baird Financial Group, Inc. | 8.374 | -19,07 | 290 | -12,16 | ||||
| 2026-02-11 | 13F | Simplex Trading, Llc | 0 | -100,00 | 0 | |||||
| 2026-02-13 | 13F | Stifel Financial Corp | 125.054 | 0,62 | 4.327 | 9,21 | ||||
| 2026-02-13 | 13F | Rafferty Asset Management, LLC | 119.534 | -17,56 | 4.136 | -10,50 | ||||
| 2026-04-16 | 13F | Telos Capital Management, Inc. | 6.563 | 0,00 | 219 | -3,52 | ||||
| 2026-02-17 | 13F | Advisory Services Network, LLC | 0 | -100,00 | 0 | |||||
| 2026-02-10 | 13F | Norges Bank | 1.099.110 | 38.029 | ||||||
| 2026-04-23 | 13F | Private Wealth Management Group, LLC | 31 | 0,00 | 1 | 0,00 | ||||
| 2026-02-11 | 13F | Deutsche Bank Ag\ | 78.493 | -45,31 | 2.716 | -40,63 | ||||
| 2026-04-30 | 13F | Villere St Denis J & Co Llc | 627.031 | 15,07 | 20.943 | 11,07 | ||||
| 2026-02-17 | 13F | ExodusPoint Capital Management, LP | 0 | -100,00 | 0 | -100,00 | ||||
| 2026-01-29 | 13F | Ashton Thomas Private Wealth, LLC | 79.321 | 0,67 | 2.745 | 9,28 | ||||
| 2026-02-10 | 13F | Basepoint Wealth LLC | 168 | 6 | ||||||
| 2025-11-21 | 13F/A | CIBC Bancorp USA Inc. | 9.541 | 304 | ||||||
| 2026-02-12 | 13F | Quadrant Capital Group Llc | 5.234 | -1,60 | 181 | 7,10 | ||||
| 2026-02-13 | 13F | Mariner, LLC | 6.737 | 233 | ||||||
| 2026-04-20 | 13F | State of Alaska, Department of Revenue | 47.724 | -4,28 | 2 | 0,00 | ||||
| 2026-02-05 | 13F | Bessemer Group Inc | 91.088 | 16.194,81 | 3 | |||||
| 2026-04-29 | 13F | Klp Kapitalforvaltning As | 19.045 | 0,00 | 636 | -3,34 | ||||
| 2026-02-13 | 13F | SRS Capital Advisors, Inc. | 43 | -98,95 | 1 | -99,23 | ||||
| 2026-02-13 | 13F | Macquarie Group Ltd | 0 | -100,00 | 0 | |||||
| 2026-03-04 | 13F/A | Savant Capital, LLC | 0 | -100,00 | 0 | |||||
| 2026-04-13 | 13F | True Wealth Design, LLC | 22 | 0,00 | 1 | |||||
| 2026-02-17 | 13F | California State Teachers Retirement System | 82.937 | 0,01 | 2.870 | 8,59 | ||||
| 2026-02-13 | 13F | Kennedy Capital Management, Inc. | 189.437 | -0,35 | 6.555 | 8,19 | ||||
| 2026-04-28 | 13F | Stephens Inc /ar/ | 0 | -100,00 | 0 | |||||
| 2026-02-09 | 13F | Kestra Investment Management, LLC | 38.645 | -0,78 | 1.337 | 7,74 | ||||
| 2026-02-12 | 13F | ROSS\JOHNSON & Associates LLC | 24 | -4,00 | 1 | |||||
| 2026-02-13 | 13F | Ubs Asset Management Americas Inc | 179.560 | 3,54 | 6.213 | 12,39 | ||||
| 2025-11-14 | 13F | Tudor Investment Corp Et Al | 0 | -100,00 | 0 | |||||
| 2026-02-05 | 13F | Allworth Financial LP | 1.447 | -0,55 | 50 | 8,70 | ||||
| 2026-02-12 | 13F | Cibc World Markets Corp | 5.921 | -45,45 | 205 | -34,62 | ||||
| 2026-04-20 | 13F | Davidson Trust Co | 6.004 | 201 | ||||||
| 2026-02-17 | 13F | Two Sigma Investments, Lp | 117.714 | -68,30 | 4.073 | -65,58 | ||||
| 2026-01-26 | 13F | KBC Group NV | 2.726 | 0,00 | 0 | |||||
| 2026-02-20 | 13F | Capstone Wealth Management, Inc. | 22.245 | 776 | ||||||
| 2026-04-15 | 13F | Curran Financial Partners, LLC | 8.625 | -13,75 | 288 | -16,76 | ||||
| 2026-02-12 | 13F | Xponance, Inc. | 7.079 | 0,38 | 245 | 8,93 | ||||
| 2026-02-11 | 13F | LPL Financial LLC | 58.336 | 9,90 | 2.018 | 19,34 | ||||
| 2026-02-13 | 13F | Public Sector Pension Investment Board | 309.849 | 10.721 | ||||||
| 2026-02-11 | 13F | Capital International Investors | 2.673.512 | 92.504 | ||||||
| 2026-02-13 | 13F | MAI Capital Management | 85 | -8,60 | 3 | 0,00 | ||||
| 2026-04-23 | 13F | Farmers & Merchants Investments Inc | 50 | 2 | ||||||
| 2026-02-17 | 13F | Ameriprise Financial Inc | 206.544 | 288,01 | 7.146 | 321,34 | ||||
| 2026-04-21 | 13F | GHP Investment Advisors, Inc. | 6 | 0 | ||||||
| 2026-04-13 | 13F | Stockman Wealth Management, Inc. | 22.019 | -77,16 | 735 | -77,96 | ||||
| 2026-02-13 | 13F | FORA Capital, LLC | 12.293 | 425 | ||||||
| 2026-02-17 | 13F | Mirabella Financial Services Llp | 8.586 | 297 | ||||||
| 2026-02-09 | 13F | Huntington National Bank | 1 | 0,00 | 0 | |||||
| 2026-02-09 | 13F | Legal & General Group Plc | 217.978 | 134,36 | 7.542 | 154,45 | ||||
| 2026-02-10 | 13F | Commonwealth Of Pennsylvania Public School Empls Retrmt Sys | 22.161 | 767 | ||||||
| 2026-02-17 | 13F | Odyssean, LLC | 9.841 | 340 | ||||||
| 2026-02-12 | 13F | Triumph Capital Management | 300 | 0,00 | 10 | 11,11 | ||||
| 2026-02-12 | 13F | New York State Common Retirement Fund | 27.866 | 0,00 | 964 | 8,56 | ||||
| 2026-02-11 | 13F | Ameritas Investment Partners, Inc. | 7.477 | 259 | ||||||
| 2026-02-11 | 13F | Simplex Trading, Llc | Put | 0 | -100,00 | 0 | -100,00 | |||
| 2026-05-01 | 13F | Thrivent Financial For Lutherans | 58.713 | -4,54 | 2 | -50,00 | ||||
| 2026-02-17 | 13F | Two Sigma Advisers, Lp | 0 | -100,00 | 0 | -100,00 | ||||
| 2026-02-03 | 13F | Northern Capital Management, Inc. | 52.100 | 0,53 | 1.803 | 9,15 | ||||
| 2026-02-05 | 13F | HFM Investment Advisors, LLC | 6 | 0,00 | 0 | |||||
| 2026-01-28 | 13F | Universal- Beteiligungs- und Servicegesellschaft mbH | 119.608 | 0,95 | 4.138 | 9,62 | ||||
| 2026-02-12 | 13F | Swiss National Bank | 175.846 | 1,74 | 6.084 | 10,46 | ||||
| 2026-02-13 | 13F | Ieq Capital, Llc | 18.278 | 21,80 | 632 | 32,22 | ||||
| 2026-02-17 | 13F | Jones Financial Companies Lllp | 2.070 | 29,29 | 72 | 36,54 | ||||
| 2026-02-17 | 13F | Advisor Group Holdings, Inc. | 14.807 | -20,33 | 512 | -15,37 | ||||
| 2026-02-17 | 13F | Cetera Investment Advisers | 7.171 | 248 | ||||||
| 2026-04-23 | 13F | Oppenheimer Asset Management Inc. | 6.667 | -6,38 | 223 | -9,76 | ||||
| 2026-02-13 | 13F | BNP Paribas Asset Management Holding S.A. | 1.682 | 41,58 | 0 | |||||
| 2026-02-12 | 13F | DRW Securities, LLC | 13.017 | 450 | ||||||
| 2026-02-17 | 13F | Interval Partners, LP | 0 | -100,00 | 0 | |||||
| 2026-02-10 | 13F | Envestnet Asset Management Inc | 27.557 | -5,49 | 953 | 2,58 | ||||
| 2026-02-17 | 13F | Aristotle Capital Boston, LLC | 483.036 | -9,27 | 16.713 | -1,50 | ||||
| 2026-02-06 | 13F | HighTower Advisors, LLC | 14.177 | 2,72 | 491 | 11,62 | ||||
| 2026-02-09 | 13F | Hantz Financial Services, Inc. | 55.216 | -37,80 | 2 | -50,00 | ||||
| 2026-02-17 | 13F | Engineers Gate Manager LP | 8.236 | 285 | ||||||
| 2026-02-19 | 13F | Invesco Ltd. | 370.064 | 21,72 | 12.804 | 32,15 | ||||
| 2026-02-17 | 13F | Canada Pension Plan Investment Board | 15.600 | 540 | ||||||
| 2026-01-28 | 13F | Financial Perspectives, Inc | 100 | 0,00 | 3 | 0,00 | ||||
| 2026-02-12 | 13F | MetLife Investment Management, LLC | 49.733 | -5,41 | 1.721 | 2,69 | ||||
| 2026-02-17 | 13F | Bank Of America Corp /de/ | 1.753.844 | -5,14 | 60.683 | 2,99 | ||||
| 2026-04-15 | 13F | Fortitude Family Office, LLC | 69 | 146,43 | 2 | |||||
| 2026-04-16 | 13F | SG Americas Securities, LLC | 108.497 | 43,55 | 4 | 50,00 | ||||
| 2026-02-13 | 13F | Great West Life Assurance Co /can/ | 86.236 | 243,54 | 3 | |||||
| 2026-04-29 | 13F | First Interstate Bank | 4.653.119 | -0,26 | 155.414 | -3,72 | ||||
| 2026-02-12 | 13F | Bank Of Montreal /can/ | 7.878 | 273 | ||||||
| 2026-04-24 | 13F | Profund Advisors Llc | 7.671 | -46,50 | 256 | -48,39 | ||||
| 2026-01-27 | 13F | Evergreen Capital Management Llc | 24.067 | 12,22 | 833 | 21,82 | ||||
| 2026-02-10 | 13F | Intech Investment Management Llc | 34.894 | 0,00 | 1.207 | 8,54 | ||||
| 2026-02-05 | 13F | Amalgamated Bank | 26.016 | 856,12 | 1 | |||||
| 2026-02-17 | 13F | State Of Wisconsin Investment Board | 0 | -100,00 | 0 | |||||
| 2026-04-21 | 13F | Financial Consulate, Inc | 16 | 0,00 | 1 | |||||
| 2026-02-06 | 13F | Larson Financial Group LLC | 22 | 0,00 | 1 | |||||
| 2026-02-13 | 13F | JustInvest LLC | 11.043 | -8,02 | 382 | 0,00 | ||||
| 2026-02-12 | 13F | South Dakota Investment Council | 14.027 | -12,48 | 0 | |||||
| 2026-04-03 | 13F | Global Wealth Strategies & Associates | 240 | 0,00 | 8 | 0,00 | ||||
| 2026-02-10 | 13F | CIBC Asset Management Inc | 9.309 | 322 | ||||||
| 2025-11-13 | 13F | Marshall Wace, Llp | 0 | -100,00 | 0 | -100,00 | ||||
| 2026-02-17 | 13F | Royal Bank Of Canada | 24.224 | -25,66 | 839 | -19,17 | ||||
| 2026-02-17 | 13F | Farringdon Capital, Ltd. | 7.066 | 244 | ||||||
| 2026-02-12 | 13F | State Board Of Administration Of Florida Retirement System | 23.600 | 0,00 | 817 | 8,51 | ||||
| 2026-02-10 | 13F | IFG Advisory, LLC | 6.536 | 226 | ||||||
| 2026-02-17 | 13F | Aquatic Capital Management LLC | 9.816 | 340 | ||||||
| 2026-04-24 | 13F | Root Financial Partners, LLC | 624 | 82,46 | 21 | 81,82 | ||||
| 2026-02-11 | 13F | Parallel Advisors, LLC | 255 | 0,00 | 9 | 0,00 | ||||
| 2026-02-02 | 13F | Principal Financial Group Inc | 426.632 | 14.761 | ||||||
| 2026-02-17 | 13F | nVerses Capital, LLC | 9.667 | 334 | ||||||
| 2026-02-17 | 13F | Captrust Financial Advisors | 11.781 | 8,63 | 408 | 17,97 | ||||
| 2026-02-09 | 13F | Fisher Asset Management, LLC | 265.894 | -0,01 | 9.200 | 8,56 | ||||
| 2026-04-20 | 13F | Jfs Wealth Advisors, Llc | 60 | 15,38 | 2 | 100,00 | ||||
| 2026-02-13 | 13F | Cramer Rosenthal Mcglynn Llc | 1.053.685 | 14,29 | 36.458 | 24,09 | ||||
| 2026-04-21 | 13F | Vise Technologies, Inc. | 7.192 | 0,00 | 249 | 0,00 | ||||
| 2026-01-30 | 13F | State of New Jersey Common Pension Fund D | 71.943 | 1,57 | 2.489 | 10,28 | ||||
| 2026-02-13 | 13F | Citigroup Inc | 154.397 | 2,59 | 5.342 | 11,38 | ||||
| 2026-04-23 | 13F | CBOE Vest Financial, LLC | 54.773 | 1.829 | ||||||
| 2026-01-30 | 13F | NJ State Employees Deferred Compensation Plan | 0 | -100,00 | 0 | -100,00 | ||||
| 2026-02-17 | 13F | Mercer Global Advisors Inc /adv | 19.865 | 32,12 | 687 | 43,42 | ||||
| 2026-01-29 | 13F | UBS Group AG | 1.870.942 | 6,66 | 64.735 | 15,80 | ||||
| 2026-04-24 | 13F | Keybank National Association/oh | 10.424 | -24,73 | 348 | -27,35 | ||||
| 2026-02-09 | 13F | Quest Partners LLC | 20.927 | -64,16 | 724 | -61,08 | ||||
| 2026-02-10 | 13F | Mutual Of America Capital Management Llc | 10.231 | 354 | ||||||
| 2026-04-22 | 13F | Sterling Capital Management LLC | 2.859 | -44,73 | 95 | -46,63 | ||||
| 2026-02-17 | 13F | Qube Research & Technologies Ltd | 0 | -100,00 | 0 | |||||
| 2026-04-30 | 13F | First Horizon Corp | 980 | -22,71 | 33 | -25,58 | ||||
| 2026-04-17 | 13F | AdvisorNet Financial, Inc | 4.345 | 210,36 | 145 | 202,08 | ||||
| 2026-02-17 | 13F | Lighthouse Investment Partners, LLC | 18.321 | 634 | ||||||
| 2026-02-10 | 13F/A | Northwestern Mutual Wealth Management Co | 387 | -79,63 | 13 | -78,33 | ||||
| 2026-02-10 | 13F | Rothschild Investment Llc | 159 | 32,50 | 6 | 66,67 | ||||
| 2026-02-09 | 13F | Cypress Capital Management LLC (WY) | 67.795 | -0,23 | 2.346 | 8,31 | ||||
| 2026-02-11 | 13F | Jpmorgan Chase & Co | 1.575.118 | -11,84 | 54.499 | -4,28 | ||||
| 2026-02-12 | 13F | BlackRock, Inc. | 13.614.268 | 83,56 | 471.054 | 99,28 | ||||
| 2026-02-11 | 13F | Franklin Resources Inc | 2.599.643 | -39,01 | 89.948 | -33,78 | ||||
| 2026-02-13 | 13F | American Century Companies Inc | 78.182 | 81,02 | 2.705 | 96,58 | ||||
| 2026-02-18 | 13F | Caitlin John, LLC | 590 | -0,17 | 20 | 11,11 | ||||
| 2026-04-27 | 13F | Altus Wealth Group LLC | 26.952 | -1,06 | 900 | -4,46 | ||||
| 2026-01-27 | 13F | Zurcher Kantonalbank (Zurich Cantonalbank) | 29.556 | 25,26 | 1.023 | 36,09 | ||||
| 2026-02-13 | 13F | Charles Schwab Investment Management Inc | 1.174.698 | 0,34 | 40.645 | 8,94 | ||||
| 2026-02-06 | 13F | Vestmark Advisory Solutions, Inc. | 68.924 | 145,32 | 2.385 | 166,37 | ||||
| 2026-02-17 | 13F | Tower Research Capital LLC (TRC) | 8.316 | 49,68 | 288 | 62,15 | ||||
| 2026-02-09 | 13F | New Age Alpha Advisors, LLC | 12.742 | 441 | ||||||
| 2026-02-13 | 13F | Wells Fargo & Company/mn | 190.319 | 11,34 | 6.585 | 20,89 | ||||
| 2026-04-22 | 13F | Pictet Asset Management Holding SA | 13.298 | -1,03 | 444 | -4,31 | ||||
| 2026-02-17 | 13F | Dark Forest Capital Management Lp | 0 | -100,00 | 0 | |||||
| 2026-02-17 | 13F | Jain Global LLC | 0 | -100,00 | 0 | |||||
| 2026-04-29 | 13F | Hughes Financial Services, LLC | 19 | 0,00 | 1 | |||||
| 2026-02-12 | 13F | Great Lakes Advisors, Llc | 143.878 | 0,00 | 4.978 | 8,57 | ||||
| 2026-01-22 | 13F | Massachusetts Financial Services Co /ma/ | 1.340.686 | -3,46 | 46.388 | 4,81 | ||||
| 2026-02-02 | 13F | Fifth Third Bancorp | 56 | 3,70 | 2 | 0,00 | ||||
| 2026-02-13 | 13F | Pinnacle Wealth Planning Services, Inc. | 1.240 | 43 | ||||||
| 2026-02-12 | 13F | Brown Brothers Harriman & Co | 157 | 5 | ||||||
| 2026-04-08 | 13F | Wealth Enhancement Advisory Services, Llc | 16.744 | -9,51 | 561 | -18,37 | ||||
| 2026-04-20 | 13F | Louisiana State Employees Retirement System | 39.000 | -4,88 | 1.303 | -8,18 | ||||
| 2026-02-13 | 13F | Bridgewater Associates, LP | 199.396 | 6.899 | ||||||
| 2026-02-17 | 13F | Optiver Holding B.V. | 179 | 6 | ||||||
| 2026-02-02 | 13F | Danske Bank A/s | 1.800 | 0,00 | 62 | 8,77 | ||||
| 2026-01-15 | 13F | Allspring Global Investments Holdings, LLC | 92.931 | -43,64 | 3.360 | -35,82 | ||||
| 2026-02-13 | 13F | Barclays Plc | 195.766 | 21,26 | 6.774 | 31,64 | ||||
| 2026-02-11 | 13F | Meeder Asset Management Inc | 12.525 | 433 | ||||||
| 2026-02-17 | 13F | Russell Investments Group, Ltd. | 52.064 | 5,00 | 1.801 | 13,99 | ||||
| 2026-02-17 | 13F | Two Sigma Securities, Llc | 10.960 | 45,88 | 379 | 58,58 | ||||
| 2026-04-13 | 13F | IFP Advisors, Inc | 87 | 0,00 | 3 | -33,33 | ||||
| 2026-02-17 | 13F | Delaware Management Holdings, Inc. | 1.941.566 | 67.186 | ||||||
| 2026-04-15 | 13F | Bayforest Capital Ltd | 5.463 | 44,03 | 182 | 38,93 | ||||
| 2026-04-29 | 13F | Skopos Labs, Inc. | 10.927 | 365 | ||||||
| 2026-01-12 | 13F | Rialto Wealth Management, LLC | 42 | 0,00 | 1 | 0,00 | ||||
| 2026-02-06 | 13F | Pnc Financial Services Group, Inc. | 3.324 | 6,06 | 115 | 16,16 | ||||
| 2026-02-11 | 13F | Los Angeles Capital Management Llc | 446 | 14 | ||||||
| 2026-02-13 | 13F | Umb Bank N A/mo | 339 | 140,43 | 12 | 175,00 | ||||
| 2026-02-03 | 13F | McIlrath & Eck, LLC | 8.502 | 294 | ||||||
| 2026-02-17 | 13F | Millennium Management Llc | 0 | -100,00 | 0 | |||||
| 2026-02-10 | 13F | Eurizon Capital SGR S.p.A. | 736 | 25 | ||||||
| 2026-01-30 | 13F | Jennison Associates Llc | 1.356.333 | -16,74 | 46.929 | -9,61 | ||||
| 2026-02-13 | 13F | Cullen Capital Management, LLC | 18.714 | 0,00 | 648 | 8,56 | ||||
| 2026-02-17 | 13F | Weiss Asset Management LP | 21.846 | 756 | ||||||
| 2026-04-24 | 13F | ProShare Advisors LLC | 13.443 | -22,72 | 449 | -25,46 | ||||
| 2025-11-14 | 13F | Verition Fund Management LLC | 0 | -100,00 | 0 | |||||
| 2026-04-21 | 13F | Gilpin Wealth Management, Llc | 0 | -100,00 | 0 | |||||
| 2026-01-29 | 13F | Comerica Bank | 36.716 | 113,86 | 1.270 | 132,18 | ||||
| 2026-01-28 | 13F | Teacher Retirement System Of Texas | 0 | -100,00 | 0 | |||||
| 2026-02-17 | 13F | North Reef Capital Management LP | 1.974.999 | 132,35 | 68.335 | 152,26 | ||||
| 2026-01-29 | 13F | Vanguard Group Inc | 10.048.419 | 13,75 | 347.675 | 23,49 | ||||
| 2026-04-17 | 13F | Bell Investment Advisors, Inc | 23 | 0,00 | 1 | |||||
| 2026-02-12 | 13F | Voya Investment Management Llc | 15.498 | -1,65 | 536 | 6,77 | ||||
| 2026-01-28 | 13F | Arizona State Retirement System | 24.741 | -6,17 | 856 | 1,90 | ||||
| 2026-02-09 | 13F | Hartland & Co., LLC | 100 | -87,20 | 3 | -87,50 | ||||
| 2026-02-09 | 13F | Geode Capital Management, Llc | 2.233.930 | -1,40 | 77.305 | 7,05 | ||||
| 2026-02-13 | 13F | First Trust Advisors Lp | 380.322 | 8,74 | 13.159 | 18,06 | ||||
| 2026-02-17 | 13F | Punch & Associates Investment Management, Inc. | 723.818 | -0,05 | 25.044 | 8,52 | ||||
| 2026-04-24 | 13F | Strs Ohio | 0 | -100,00 | 0 | |||||
| 2026-02-06 | 13F | Covestor Ltd | 1.839 | -15,49 | 0 | |||||
| 2026-02-12 | 13F | HoldCo Asset Management, L.P. | 3.950.107 | 0,00 | 136.674 | 8,57 | ||||
| 2026-02-13 | 13F | Wbi Investments, Inc. | 15.661 | -0,55 | 542 | 7,98 | ||||
| 2026-04-28 | 13F | Golden State Wealth Management, LLC | 0 | -100,00 | 0 | |||||
| 2025-11-13 | 13F | Jump Financial, LLC | 0 | -100,00 | 0 | |||||
| 2026-04-28 | 13F | Handelsbanken Fonder AB | 23.153 | 0,00 | 1 | |||||
| 2025-11-20 | 13F/A | BRYN MAWR TRUST Co | 0 | -100,00 | 0 | -100,00 | ||||
| 2026-04-15 | 13F | Third View Private Wealth, LLC | 6.664 | -33,65 | 223 | -36,02 | ||||
| 2026-04-30 | 13F | Kestra Advisory Services, LLC | 0 | -100,00 | 0 | |||||
| 2026-04-08 | 13F | DiNuzzo Private Wealth, Inc. | 17 | 0,00 | 1 | |||||
| 2026-02-13 | 13F | Victory Capital Management Inc | 2.076.339 | 4,38 | 71.841 | 13,32 | ||||
| 2026-04-30 | 13F | Nisa Investment Advisors, Llc | 4.480 | 2,24 | 150 | -1,32 | ||||
| 2026-02-13 | 13F | Rice Hall James & Associates, Llc | 106.808 | 25,44 | 3.696 | 36,20 | ||||
| 2026-04-17 | 13F | Leeward Investments, LLC - MA | 631.978 | -2,67 | 21.108 | -6,04 | ||||
| 2026-02-10 | 13F | Natixis Advisors, L.p. | 12.515 | -73,48 | 0 | -100,00 | ||||
| 2026-04-13 | 13F | Wedge Capital Management L L P/nc | 73.281 | -5,11 | 2.448 | -8,42 | ||||
| 2026-02-17 | 13F | Azora Capital LP | 0 | -100,00 | 0 | |||||
| 2026-02-12 | 13F | Cloud Capital Management, LLC | 0 | -100,00 | 0 | |||||
| 2026-02-13 | 13F | Parkside Financial Bank & Trust | 27 | 35,00 | 1 | |||||
| 2026-04-23 | 13F | Peregrine Capital Management Llc | 0 | -100,00 | 0 | |||||
| 2026-02-11 | 13F | Simplex Trading, Llc | Call | 2.200 | -67,65 | 76 | ||||
| 2025-11-12 | 13F | Steward Partners Investment Advisory, Llc | 0 | -100,00 | 0 | |||||
| 2026-04-24 | 13F | Yousif Capital Management, Llc | 23.565 | -1,72 | 787 | -9,02 | ||||
| 2026-02-02 | 13F | Pittenger & Anderson Inc | 294 | 10 | ||||||
| 2026-02-10 | 13F | Bank of New York Mellon Corp | 1.007.344 | 31,01 | 34.854 | 42,24 | ||||
| 2026-02-11 | 13F | Erste Asset Management GmbH | 0 | 0 | ||||||
| 2026-02-13 | 13F | State Street Corp | 5.482.245 | 29,67 | 189.686 | 40,78 | ||||
| 2026-04-06 | 13F | Versant Capital Management, Inc | 2.560 | 71,01 | 86 | 66,67 | ||||
| 2025-11-13 | 13F | Renaissance Technologies Llc | 0 | -100,00 | 0 | |||||
| 2026-02-12 | 13F | Principal Securities, Inc. | 0 | -100,00 | 0 | |||||
| 2026-02-09 | 13F | Keating Financial Advisory Services, Inc. | 49 | 2 | ||||||
| 2026-04-29 | 13F | CVA Family Office, LLC | 63 | 2 | ||||||
| 2026-02-17 | 13F | Susquehanna International Group, Llp | Put | 0 | -100,00 | 0 | ||||
| 2026-01-26 | 13F | Cwm, Llc | 34.174 | 0,59 | 1 | 0,00 | ||||
| 2026-01-28 | 13F | Salomon & Ludwin, LLC | 264 | 10 | ||||||
| 2026-02-10 | 13F | Axq Capital, Lp | 15.335 | 531 | ||||||
| 2026-02-17 | 13F | Schonfeld Strategic Advisors LLC | 0 | -100,00 | 0 | |||||
| 2026-02-17 | 13F | Public Employees Retirement System Of Ohio | 1.510 | 0,94 | 52 | 10,64 | ||||
| 2026-02-13 | 13F | Caitong International Asset Management Co., Ltd | 0 | -100,00 | 0 | |||||
| 2026-02-17 | 13F | SummitTX Capital, L.P. | 0 | -100,00 | 0 | |||||
| 2026-02-13 | 13F | Headlands Technologies LLC | 0 | -100,00 | 0 | |||||
| 2025-11-05 | 13F | SOUTH STATE Corp | 0 | -100,00 | 0 | |||||
| 2026-02-17 | 13F | Hotchkis & Wiley Capital Management Llc | 318.450 | -0,81 | 11.018 | 7,68 | ||||
| 2026-04-28 | 13F | Harbor Capital Advisors, Inc. | 200.193 | 81,49 | 7 | 100,00 | ||||
| 2026-04-29 | 13F | WPG Advisers, LLC | 137 | 69,14 | 5 | 100,00 | ||||
| 2026-02-12 | 13F | SWAN Capital LLC | 91 | 0,00 | 3 | 50,00 | ||||
| 2026-02-14 | 13F | Rockefeller Capital Management L.P. | 1.781 | 8,14 | 62 | 17,31 | ||||
| 2025-11-12 | 13F | Quantbot Technologies LP | 0 | -100,00 | 0 | -100,00 | ||||
| 2026-02-06 | 13F | Global Retirement Partners, LLC | 2.433 | 412,21 | 84 | 460,00 | ||||
| 2026-02-03 | 13F | Tweedy, Browne Co LLC | 31.775 | 16,65 | 1.099 | 26,61 | ||||
| 2026-04-30 | 13F | Nuveen, LLC | 299.683 | -2,80 | 10.009 | -6,17 | ||||
| 2026-04-22 | 13F | Hoese & Co LLP | 3.000 | 0,00 | 100 | -2,91 | ||||
| 2025-11-13 | 13F | Guggenheim Capital Llc | 0 | -100,00 | 0 | |||||
| 2026-04-20 | 13F | Moody Aldrich Partners Llc | 170.347 | 5.690 | ||||||
| 2026-02-17 | 13F | Alliancebernstein L.p. | 102.019 | -6,06 | 3.530 | 1,96 | ||||
| 2026-02-13 | 13F | Inspire Advisors, LLC | 7.700 | 266 | ||||||
| 2026-02-13 | 13F | Morgan Stanley | 1.578.719 | 25,94 | 54.624 | 36,73 | ||||
| 2026-04-30 | 13F | Cedar Mountain Advisors, LLC | 675 | 5.092,31 | 23 | |||||
| 2026-04-14 | 13F | Bay Harbor Wealth Management, LLC | 12 | 50,00 | 0 | |||||
| 2026-01-30 | 13F | Us Bancorp \de\ | 12.400 | 0,11 | 429 | 8,88 | ||||
| 2026-02-10 | 13F | Nomura Asset Management Co Ltd | 980 | 0,00 | 34 | 6,45 | ||||
| 2026-04-23 | 13F | SJS Investment Consulting Inc. | 2.077 | 15.876,92 | 69 | |||||
| 2026-01-29 | 13F | Teachers Retirement System Of The State Of Kentucky | 99.986 | 50,67 | 3 | 50,00 | ||||
| 2026-02-13 | 13F | Pathstone Holdings, LLC | 50.122 | 3,57 | 1.734 | 12,45 | ||||
| 2026-02-12 | 13F | Jane Street Group, Llc | 0 | -100,00 | 0 | |||||
| 2026-02-13 | 13F | Nfj Investment Group, Llc | 79.147 | -13,94 | 2.738 | -6,55 | ||||
| 2026-01-14 | 13F | Hennion & Walsh Asset Management, Inc. | 17.451 | -22,74 | 604 | -16,13 | ||||
| 2026-04-30 | 13F | Torren Management, LLC | 70 | -96,05 | 2 | -96,72 | ||||
| 2026-02-17 | 13F | Janus Henderson Group Plc | 37.395 | 0,00 | 1.294 | 8,47 | ||||
| 2026-02-11 | 13F | Fox Run Management, L.l.c. | 0 | -100,00 | 0 | |||||
| 2025-11-14 | 13F | D. E. Shaw & Co., Inc. | 0 | -100,00 | 0 | |||||
| 2026-02-12 | 13F | Dimensional Fund Advisors Lp | 5.399.384 | -1,75 | 186.823 | 6,67 | ||||
| 2026-04-22 | 13F | Janney Montgomery Scott LLC | 0 | -100,00 | 0 | |||||
| 2026-02-13 | 13F | Neuberger Berman Group LLC | 56.711 | -6,21 | 1.962 | 1,82 | ||||
| 2026-04-15 | 13F | Exchange Traded Concepts, Llc | 49.370 | 55,37 | 1.649 | 49,95 | ||||
| 2026-02-17 | 13F | Wellington Management Group Llp | 5.794.226 | -2,05 | 200.480 | 6,34 | ||||
| 2026-04-20 | 13F | Naples Global Advisors, Llc | 9.660 | 3,21 | 323 | -0,31 |
Other Listings
| DE:4FB | 30,40 € |