Grundlæggende statistik
| Institutionelle ejere | 127 total, 123 long only, 1 short only, 3 long/short - change of 1,59% MRQ |
| Gennemsnitlig porteføljeallokering | 0.2807 % - change of 7,88% MRQ |
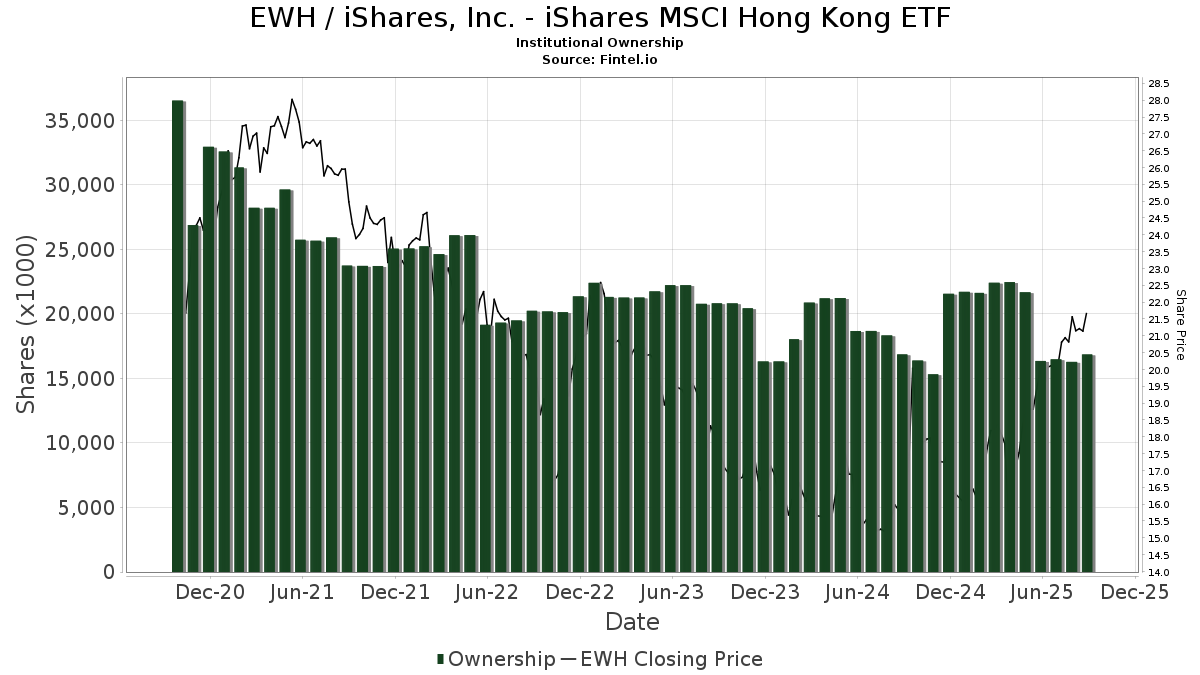
| Institutionelle aktier (lange) | 16.862.291 (ex 13D/G) - change of 0,36MM shares 2,16% MRQ |
| Institutionel værdi (lang) | $ 299.577 USD ($1000) |
Institutionelt ejerskab og aktionærer
iShares, Inc. - iShares MSCI Hong Kong ETF (US:EWH) har 127 institutionelle ejere og aktionærer, der har indsendt 13D/G- eller 13F-formularer til Securities Exchange Commission (SEC). Disse institutioner har i alt 16,862,291 aktier. Største aktionærer omfatter Wright Fund Managment, LLC, Morgan Stanley, Bank Julius Baer & Co. Ltd, Zurich, SG Americas Securities, LLC, D. E. Shaw & Co., Inc., Catalyst Capital Advisors LLC, MBXAX - Catalyst/Millburn Hedge Strategy Fund Class A, Millburn Ridgefield Corp, Northern Lights Fund Trust - Sierra Tactical Risk Spectrum 50 Fund Investor Class, and Quadrature Capital Ltd .
iShares, Inc. - iShares MSCI Hong Kong ETF (ARCA:EWH) institutionel ejerskabsstruktur viser aktuelle positioner i virksomheden efter institutioner og fonde, samt seneste ændringer i positionsstørrelse. Større aktionærer kan omfatte individuelle investorer, investeringsforeninger, hedgefonde eller institutioner. Skema 13D angiver, at investoren besidder (eller besidder) mere end 5 % af virksomheden og har til hensigt (eller har til hensigt at) aktivt at forfølge en ændring i forretningsstrategi. Skema 13G indikerer en passiv investering på over 5%.
The share price as of September 8, 2025 is 21,40 / share. Previously, on September 9, 2024, the share price was 15,92 / share. This represents an increase of 34,42% over that period.
Fondens stemningsscore
Fund Sentiment Score (fka Ownership Accumulation Score) finder de aktier, der bliver mest købt af fonde. Det er resultatet af en sofistikeret, multi-faktor kvantitativ model, der identificerer virksomheder med de højeste niveauer af institutionel akkumulering. Scoringsmodellen bruger en kombination af den samlede stigning i oplyste ejere, ændringerne i porteføljeallokeringer i disse ejere og andre målinger. Tallet går fra 0 til 100, hvor højere tal indikerer et højere niveau af akkumulering for sine jævnaldrende, og 50 er gennemsnittet.
Opdateringsfrekvens: Dagligt
Se Ownership Explorer, som giver en liste over højest rangerende virksomheder.
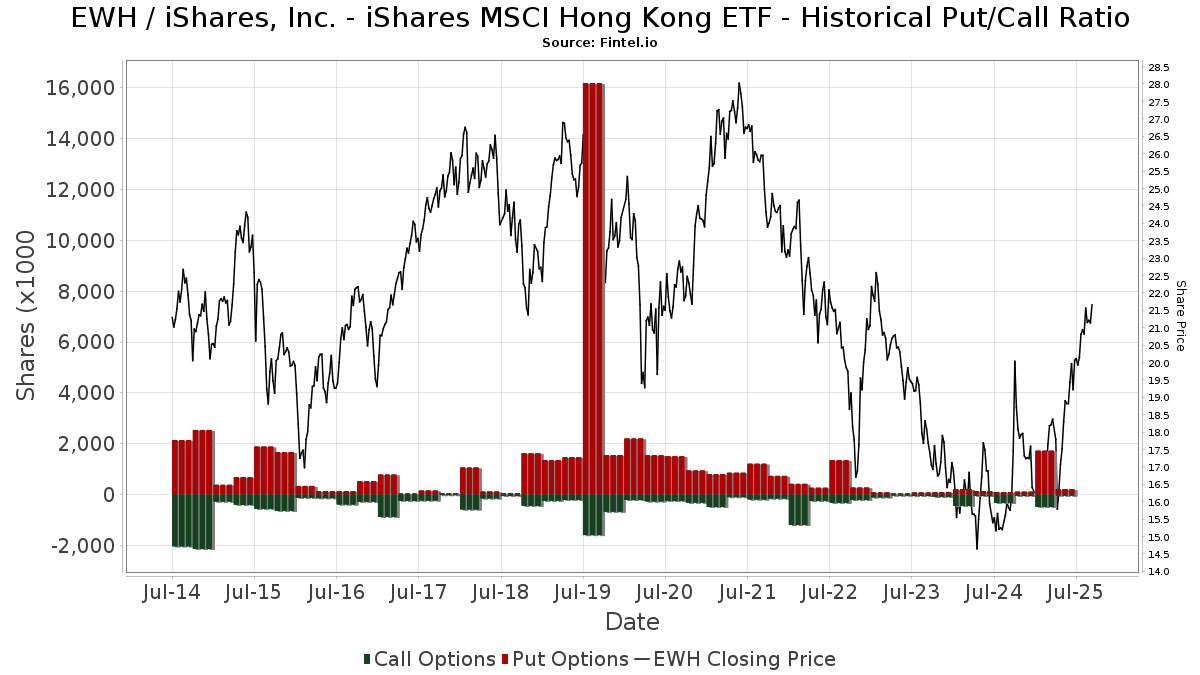
Institutionel Put/Call-forhold
Ud over at indberette standardaktie- og gældsudstedelser skal institutter med mere end 100 mill. aktiver under forvaltning også oplyse deres put- og call-optionsbeholdninger. Da salgsoptioner generelt indikerer negativ stemning, og købsoptioner indikerer positiv stemning, kan vi få en fornemmelse af den overordnede institutionelle stemning ved at plotte forholdet mellem put og kald. Diagrammet til højre viser det historiske put/call-forhold for dette instrument.
Brug af Put/Call Ratio som en indikator for investorernes stemning overvinder en af de vigtigste mangler ved at bruge totalt institutionelt ejerskab, som er, at en betydelig mængde af aktiver under forvaltning investeres passivt for at spore indekser. Passivt forvaltede fonde køber typisk ikke optioner, så indikatoren for put/call-forholdet følger mere nøje følelsen af aktivt forvaltede fonde.
13F og NPORT arkivering
Detaljer om 13F-arkivering er gratis. Detaljer om NP-ansøgninger kræver et premium-medlemskab. Grønne rækker angiver nye positioner. Røde rækker angiver lukkede positioner. Klik på linket ikon for at se den fulde transaktionshistorik.
Opgrader
for at låse premium-data op og eksportere til Excel ![]() .
.
| Fil dato | Kilde | Investor | Type | Gennemsnitlig pris (Øst) |
Aktier | Δ Aktier (%) |
Rapporteret Værdi ($1000) |
Δ Værdi (%) |
Port Alloc (%) |
|
|---|---|---|---|---|---|---|---|---|---|---|
| 2025-08-12 | 13F | MAI Capital Management | 208 | 1,96 | 4 | 33,33 | ||||
| 2025-07-08 | 13F | Parallel Advisors, LLC | 500 | 0,00 | 10 | 12,50 | ||||
| 2025-08-14 | 13F | SummitTX Capital, L.P. | 11.200 | 222 | ||||||
| 2025-08-14 | 13F | Wellington Management Group Llp | 54.028 | 243,62 | 1.073 | 289,82 | ||||
| 2025-08-13 | 13F | Barclays Plc | Put | 0 | -100,00 | 0 | ||||
| 2025-07-23 | 13F | Viewpoint Capital Management LLC | 6.241 | 0,00 | 124 | 12,84 | ||||
| 2025-08-14 | 13F | Ameriprise Financial Inc | 76.862 | -60,42 | 4.229 | 24,38 | ||||
| 2025-04-16 | 13F | Wealth Enhancement Advisory Services, Llc | Put | 0 | -100,00 | 0 | ||||
| 2025-08-12 | 13F | Zacks Investment Management | 21.664 | 430 | ||||||
| 2025-08-11 | 13F | Rahlfs Capital, Llc | 11.050 | 219 | ||||||
| 2025-07-10 | 13F | Wealth Enhancement Advisory Services, Llc | 15.937 | 0,31 | 321 | 15,47 | ||||
| 2025-08-14 | 13F | Fmr Llc | 5.916 | 8,91 | 117 | 23,16 | ||||
| 2025-08-13 | 13F | Scotia Capital Inc. | 16.352 | 325 | ||||||
| 2025-08-14 | 13F | Quantitative Investment Management, LLC | 59.004 | 1 | ||||||
| 2025-08-04 | 13F | JDM Financial Group LLC | 550 | 0,00 | 11 | 11,11 | ||||
| 2025-08-06 | 13F | Pekin Hardy Strauss, Inc. | 0 | -100,00 | 0 | |||||
| 2025-03-26 | NP | MNERX - MainStay Conservative ETF Allocation Fund Class R3 | 61.191 | 9,50 | 1.010 | 1,10 | ||||
| 2025-05-29 | NP | Northern Lights Fund Trust - Sierra Tactical Risk Spectrum 70 Fund Investor Class | 152.100 | 2.663 | ||||||
| 2025-08-13 | 13F | Korea Investment CORP | 132.000 | 0,00 | 2.622 | 13,41 | ||||
| 2025-07-21 | 13F | J. Safra Sarasin Holding AG | 0 | -100,00 | 0 | |||||
| 2025-07-31 | 13F | Wright Fund Managment, LLC | 1.407.375 | 0,00 | 24.643 | 0,00 | ||||
| 2025-08-12 | 13F | Elo Mutual Pension Insurance Co | 504.498 | 0,00 | 10.019 | 13,43 | ||||
| 2025-08-05 | 13F | Huntington National Bank | 0 | |||||||
| 2025-05-29 | NP | SIRAX - Sierra Tactical All Asset Fund Class A | 517.500 | 9.061 | ||||||
| 2025-07-29 | 13F | Tradewinds Capital Management, LLC | 102 | 0,00 | 2 | 100,00 | ||||
| 2025-07-31 | 13F | Glass Jacobson Investment Advisors llc | 1.925 | 0,00 | 38 | 18,75 | ||||
| 2025-08-14 | 13F/A | Bank Julius Baer & Co. Ltd, Zurich | 1.210.055 | 24.032 | ||||||
| 2025-07-22 | 13F | Chung Wu Investment Group, LLC | 8.500 | 169 | ||||||
| 2025-07-08 | 13F/A | Salem Investment Counselors Inc | 400 | 0,00 | 8 | 0,00 | ||||
| 2025-07-31 | 13F | Sharper & Granite LLC | 82.575 | -1,19 | 1.661 | 13,47 | ||||
| 2025-08-05 | 13F | Advisors Preferred, LLC | 1.411 | 28 | ||||||
| 2025-05-14 | 13F | Flow Traders U.s. Llc | 0 | -100,00 | 0 | |||||
| 2025-08-12 | 13F | CIBC Private Wealth Group, LLC | 0 | -100,00 | 0 | |||||
| 2025-08-14 | 13F | Federation des caisses Desjardins du Quebec | 144.176 | 3.780,92 | 2.863 | 4.373,44 | ||||
| 2025-08-13 | 13F | Mount Yale Investment Advisors, LLC | 138 | 3 | ||||||
| 2025-03-26 | NP | MWFQX - MainStay Equity ETF Allocation Fund Class R3 | 129.177 | 14,38 | 2.131 | 5,60 | ||||
| 2025-05-13 | 13F | HighTower Advisors, LLC | 0 | -100,00 | 0 | |||||
| 2025-05-02 | 13F | Whittier Trust Co | 0 | -100,00 | 0 | |||||
| 2025-08-14 | 13F | UBS Group AG | 428.667 | -45,34 | 8.513 | -38,01 | ||||
| 2025-07-07 | 13F | Upper Left Wealth Management, LLC | 14.066 | 2,55 | 279 | 16,25 | ||||
| 2025-04-22 | 13F | Cambridge Investment Research Advisors, Inc. | 0 | -100,00 | 0 | |||||
| 2025-07-30 | 13F | Exencial Wealth Advisors, Llc | 46.936 | 6,80 | 932 | 21,20 | ||||
| 2025-08-13 | 13F | Provida Pension Fund Administrator | 0 | -100,00 | 0 | -100,00 | ||||
| 2025-07-31 | 13F | Catalyst Capital Advisors LLC | 646.987 | -12,03 | 12.849 | -0,23 | ||||
| 2025-08-29 | NP | MBXAX - Catalyst/Millburn Hedge Strategy Fund Class A | 646.987 | -12,03 | 12.849 | -0,23 | ||||
| 2025-08-29 | NP | CGHIX - Timber Point Global Allocations Fund Institutional Class Shares | 10.000 | -50,00 | 199 | -43,43 | ||||
| 2025-08-15 | 13F | Morgan Stanley | 1.212.315 | -14,04 | 24.077 | -2,51 | ||||
| 2025-08-12 | 13F | Picton Mahoney Asset Management | 5.970 | -21,24 | 0 | |||||
| 2025-08-14 | 13F | Royal Bank Of Canada | 117.644 | 85,41 | 2.335 | 110,17 | ||||
| 2025-07-31 | 13F | United Community Bank | 0 | -100,00 | 0 | |||||
| 2025-08-12 | 13F | BlackRock, Inc. | 42.251 | -95,07 | 839 | -94,41 | ||||
| 2025-08-13 | 13F | Hsbc Holdings Plc | 12.720 | -4,68 | 253 | 8,15 | ||||
| 2025-08-13 | 13F | National Bank Of Canada /fi/ | 0 | -100,00 | 0 | |||||
| 2025-08-12 | 13F | LPL Financial LLC | 30.307 | -55,28 | 602 | -49,33 | ||||
| 2025-08-14 | 13F | Kovitz Investment Group Partners, LLC | 94.548 | 62,56 | 1.878 | 84,38 | ||||
| 2025-06-26 | NP | SSXU - Day Hagan/Ned Davis Research Smart Sector International ETF | 128.246 | 2.247 | ||||||
| 2025-07-11 | 13F | Farther Finance Advisors, LLC | 3.600 | 0,00 | 71 | 12,70 | ||||
| 2025-09-04 | 13F/A | Advisor Group Holdings, Inc. | 16.234 | 20,02 | 323 | 36,44 | ||||
| 2025-04-22 | 13F | Moisand Fitzgerald Tamayo, LLC | 0 | -100,00 | 0 | |||||
| 2025-08-12 | 13F | Prudential Plc | 199.443 | 3.961 | ||||||
| 2025-08-13 | 13F | Walleye Trading LLC | Put | 0 | -100,00 | 0 | ||||
| 2025-08-14 | 13F | D. E. Shaw & Co., Inc. | 742.520 | 284,26 | 14.746 | 335,89 | ||||
| 2025-08-08 | 13F | Larson Financial Group LLC | 0 | -100,00 | 0 | |||||
| 2025-08-11 | 13F | Aptus Capital Advisors, LLC | 268 | 5 | ||||||
| 2025-08-13 | 13F | Jones Financial Companies Lllp | 214 | -38,86 | 4 | -33,33 | ||||
| 2025-08-13 | 13F | Quadrature Capital Ltd | 564.759 | -13,02 | 11.219 | -1,39 | ||||
| 2025-08-14 | 13F | Prelude Capital Management, Llc | 0 | -100,00 | 0 | |||||
| 2025-08-14 | 13F | Citadel Advisors Llc | Put | 20.400 | 29,94 | 405 | 47,81 | |||
| 2025-05-08 | 13F | New York Life Investment Management Llc | 0 | -100,00 | 0 | |||||
| 2025-07-24 | 13F | Blair William & Co/il | 2.896 | -22,21 | 58 | -12,31 | ||||
| 2025-07-21 | 13F | Mirae Asset Global Investments Co., Ltd. | 27.834 | 316,74 | 553 | 371,79 | ||||
| 2025-07-10 | 13F | Contravisory Investment Management, Inc. | 25.720 | 511 | ||||||
| 2025-08-14 | 13F | Citadel Advisors Llc | Call | 16.800 | -93,32 | 334 | -92,44 | |||
| 2025-08-14 | 13F | Susquehanna International Group, Llp | Call | 0 | -100,00 | 0 | ||||
| 2025-08-28 | NP | TFAFX - Tactical Growth Allocation Fund Class I | 1.600 | 32 | ||||||
| 2025-08-05 | 13F | Harel Insurance Investments & Financial Services Ltd. | 5.000 | 108,33 | 0 | |||||
| 2025-08-14 | 13F | Raymond James Financial Inc | 322.199 | -16,08 | 6.399 | -4,82 | ||||
| 2025-07-16 | 13F | Banque Pictet & Cie Sa | 215.913 | 0,00 | 4.288 | 13,44 | ||||
| 2025-07-28 | 13F | Harbour Investments, Inc. | 556 | 0,00 | 11 | 22,22 | ||||
| 2025-08-06 | 13F | Golden State Wealth Management, LLC | 115 | 0,00 | 2 | 0,00 | ||||
| 2025-05-14 | 13F | Walleye Trading LLC | 0 | -100,00 | 0 | -100,00 | ||||
| 2025-08-12 | 13F | O'shaughnessy Asset Management, Llc | 220 | -37,85 | 4 | -33,33 | ||||
| 2025-08-06 | 13F | Commonwealth Equity Services, Llc | 26.525 | 12,75 | 1 | |||||
| 2025-08-08 | 13F | Foundations Investment Advisors, LLC | 0 | -100,00 | 0 | |||||
| 2025-06-26 | NP | BlackRock ETF Trust - iShares International Country Rotation Active ETF | 2.415 | -27,24 | 42 | -22,22 | ||||
| 2025-08-14 | 13F | CIBC World Markets Inc. | 476.469 | -1,35 | 9.463 | 11,88 | ||||
| 2025-08-28 | NP | ICCIX - Dynamic International Opportunity Fund Class I | 29.101 | -19,19 | 578 | -8,41 | ||||
| 2025-08-13 | 13F | Invesco Ltd. | 10.233 | -7,18 | 203 | 5,18 | ||||
| 2025-04-25 | 13F | Mmbg Investment Advisors Co. | 0 | -100,00 | 0 | |||||
| 2025-03-26 | NP | MDAKX - MainStay Moderate ETF Allocation Fund Class C | 194.616 | 11,09 | 3.211 | 2,59 | ||||
| 2025-08-18 | 13F | Wolverine Trading, Llc | Call | 0 | -100,00 | 0 | ||||
| 2025-07-23 | 13F | Vontobel Holding Ltd. | 333.736 | -1,18 | 6.628 | 12,08 | ||||
| 2025-07-28 | 13F | Twin Tree Management, LP | 0 | -100,00 | 0 | |||||
| 2025-08-06 | 13F | Texas Yale Capital Corp. | 0 | -100,00 | 0 | |||||
| 2025-08-12 | 13F | Rhumbline Advisers | 1.431 | 0,00 | 28 | 12,00 | ||||
| 2025-08-13 | 13F | Taikang Asset Management (Hong Kong) Co Ltd | 55.029 | 0,00 | 1.093 | 13,40 | ||||
| 2025-08-13 | 13F | Capital Fund Management S.a. | 33.788 | 49,29 | 671 | 69,44 | ||||
| 2025-08-05 | 13F | Sigma Planning Corp | 24.004 | 33,87 | 477 | 52,08 | ||||
| 2025-05-15 | 13F | Optiver Holding B.V. | 0 | -100,00 | 0 | -100,00 | ||||
| 2025-08-14 | 13F | Glen Eagle Advisors, LLC | 58 | 1 | ||||||
| 2025-08-11 | 13F | TD Waterhouse Canada Inc. | 1.455 | 0,00 | 29 | 12,00 | ||||
| 2025-08-12 | 13F | Steward Partners Investment Advisory, Llc | 616 | 0,00 | 12 | 20,00 | ||||
| 2025-07-22 | 13F | 4Thought Financial Group Inc. | 184 | 3,37 | 4 | 0,00 | ||||
| 2025-08-08 | 13F | Creative Planning | 10.553 | -0,01 | 210 | 13,59 | ||||
| 2025-08-14 | 13F | Susquehanna International Group, Llp | Put | 10.100 | -79,72 | 201 | -77,04 | |||
| 2025-08-05 | 13F | Castlekeep Investment Advisors Llc | 20.757 | -3,42 | 412 | 9,57 | ||||
| 2025-08-14 | 13F | Susquehanna International Group, Llp | 12.229 | -92,56 | 243 | -91,59 | ||||
| 2025-08-14 | 13F | Tudor Investment Corp Et Al | 0 | -100,00 | 0 | |||||
| 2025-08-13 | 13F | Capital Fund Management S.a. | Call | 14.400 | -54,29 | 286 | -48,28 | |||
| 2025-05-15 | 13F | Dai-ichi Life Holdings, Inc. | 0 | -100,00 | 0 | |||||
| 2025-08-14 | 13F | Hrt Financial Lp | 179.958 | 4 | ||||||
| 2025-08-08 | 13F | SG Americas Securities, LLC | 1.195.271 | 738,32 | 24 | 1.050,00 | ||||
| 2025-08-13 | 13F | Marshall Wace, Llp | 43.000 | 854 | ||||||
| 2025-07-14 | 13F | Legacy Capital Group California, Inc. | 25.470 | 506 | ||||||
| 2025-08-14 | 13F | Bnp Paribas Arbitrage, Sa | 63.032 | -49,05 | 1.252 | -42,24 | ||||
| 2025-08-11 | 13F | Covestor Ltd | 7 | 0,00 | 0 | |||||
| 2025-08-14 | 13F | Evergreen Capital Management Llc | 124.720 | 6,09 | 2.477 | 20,31 | ||||
| 2025-08-06 | 13F | Prospera Financial Services Inc | 0 | -100,00 | 0 | |||||
| 2025-08-12 | 13F | Barings Llc | 208.539 | -8,67 | 4.142 | 3,58 | ||||
| 2025-07-29 | 13F | Millburn Ridgefield Corp | 646.987 | -12,03 | 12.849 | -0,23 | ||||
| 2025-08-13 | 13F | Baker Avenue Asset Management, LP | Put | 150.000 | -55,88 | 8 | -97,92 | |||
| 2025-05-07 | 13F | Drive Wealth Management, Llc | 0 | -100,00 | 0 | |||||
| 2025-08-14 | 13F | Citadel Advisors Llc | 0 | -100,00 | 0 | |||||
| 2025-08-05 | 13F | Bank Of Montreal /can/ | 81.957 | 0,28 | 1.628 | 13,70 | ||||
| 2025-08-13 | 13F | Cresset Asset Management, LLC | 29.020 | 8,78 | 576 | 23,34 | ||||
| 2025-08-06 | 13F | Innealta Capital, Llc | 29.101 | -19,19 | 578 | -8,41 | ||||
| 2025-08-14 | 13F | Jane Street Group, Llc | 544.097 | -22,59 | 10.806 | -12,21 | ||||
| 2025-08-14 | 13F | Gotham Asset Management, LLC | 10.426 | 0,00 | 207 | 13,74 | ||||
| 2025-08-13 | 13F | Idaho Trust Bank | 29.514 | 25,87 | 586 | 42,93 | ||||
| 2025-08-14 | 13F | Group One Trading, L.p. | 9.036 | 179 | ||||||
| 2025-08-27 | 13F/A | Squarepoint Ops LLC | 48.311 | 29,52 | 959 | 46,86 | ||||
| 2025-08-14 | 13F | Old Mission Capital Llc | 0 | -100,00 | 0 | |||||
| 2025-08-15 | 13F | Tower Research Capital LLC (TRC) | 1.837 | -37,81 | 36 | -41,94 | ||||
| 2025-08-12 | 13F | Jpmorgan Chase & Co | 192.022 | -3,68 | 3.814 | 9,26 | ||||
| 2025-07-31 | 13F | GenTrust, LLC | 20.561 | 6,03 | 408 | 20,35 | ||||
| 2025-08-14 | 13F | Comerica Bank | 1.112 | 11,87 | 22 | 29,41 | ||||
| 2025-08-05 | 13F | Tsfg, Llc | 500 | 0,00 | 0 | |||||
| 2025-08-12 | 13F | Proequities, Inc. | 0 | 0 | ||||||
| 2025-08-13 | 13F | Walleye Trading LLC | Call | 0 | -100,00 | 0 | ||||
| 2025-08-08 | 13F | Abc Arbitrage Sa | 17.827 | -80,52 | 354 | -77,90 | ||||
| 2025-07-29 | NP | HFND - Unlimited HFND Multi-Strategy Return Tracker ETF | 2.959 | 866,99 | 56 | 1.020,00 | ||||
| 2025-08-14 | 13F | Qube Research & Technologies Ltd | 927 | -98,35 | 18 | -98,17 | ||||
| 2025-07-17 | 13F | Albion Financial Group /ut | 63.000 | 0,00 | 1.251 | 13,42 | ||||
| 2025-08-13 | 13F | Renaissance Technologies Llc | 434.900 | 76,22 | 8.637 | 99,88 | ||||
| 2025-08-11 | 13F | Citigroup Inc | 26.239 | -72,07 | 521 | -68,33 | ||||
| 2025-07-18 | 13F | USA Financial Portformulas Corp | 7.706 | -38,75 | 153 | -30,45 | ||||
| 2025-08-11 | 13F | Principal Securities, Inc. | 29 | 1 | ||||||
| 2025-03-26 | NP | MOEAX - MainStay Growth ETF Allocation Fund Class A | 163.359 | 11,17 | 2.695 | 2,67 | ||||
| 2025-08-05 | 13F | Gould Asset Management Llc /ca/ | 39.511 | -3,26 | 785 | 9,65 | ||||
| 2025-08-07 | 13F | Allworth Financial LP | 20 | 0,00 | 0 | |||||
| 2025-08-14 | 13F | Two Sigma Securities, Llc | 17.106 | -68,19 | 340 | -63,97 | ||||
| 2025-05-29 | NP | Northern Lights Fund Trust - Sierra Tactical Core Growth Fund Investor Class Shares | 26.075 | 457 | ||||||
| 2025-05-29 | NP | Northern Lights Fund Trust - Sierra Tactical Risk Spectrum 50 Fund Investor Class | 568.800 | 9.960 | ||||||
| 2025-08-14 | 13F | Jane Street Group, Llc | Put | 33.500 | 665 | |||||
| 2025-07-24 | 13F | Cyndeo Wealth Partners, LLC | 15.626 | -2,78 | 310 | 10,32 | ||||
| 2025-08-14 | 13F | Wells Fargo & Company/mn | 165.021 | 382,84 | 3.277 | 447,99 | ||||
| 2025-05-15 | 13F | Barclays Plc | 0 | -100,00 | 0 | |||||
| 2025-08-14 | 13F | Integrated Wealth Concepts LLC | 54.406 | -41,23 | 1.080 | -33,33 | ||||
| 2025-05-01 | 13F | Cwm, Llc | 0 | -100,00 | 0 | |||||
| 2025-08-12 | 13F | BlackRock, Inc. | Put | 0 | -100,00 | 0 | -100,00 | |||
| 2025-08-14 | 13F | Horizon Investments, LLC | 27 | 107,69 | 1 | |||||
| 2025-08-14 | 13F | Goldman Sachs Group Inc | 87.564 | -46,51 | 1.739 | -39,32 | ||||
| 2025-05-29 | NP | Northern Lights Fund Trust - Sierra Tactical Risk Spectrum 30 Fund Instl Class | 142.900 | 2.502 | ||||||
| 2025-08-08 | NP | QALTX - Quantified Alternative Investment Fund Investor Class Shares | 1.411 | 28 | ||||||
| 2025-08-13 | 13F | Amundi | 23.414 | 7,90 | 471 | 24,01 | ||||
| 2025-08-12 | 13F | Atlas Capital Advisors Llc | 0 | -100,00 | 0 | |||||
| 2025-08-14 | 13F | Bank Of America Corp /de/ | 70.005 | -21,62 | 1.390 | -11,07 | ||||
| 2025-08-12 | 13F | XTX Topco Ltd | 15.828 | 314 | ||||||
| 2025-08-14 | 13F | Headlands Technologies LLC | 0 | -100,00 | 0 | -100,00 | ||||
| 2025-04-28 | 13F | Pictet North America Advisors SA | 0 | -100,00 | 0 | |||||
| 2025-07-16 | 13F/A | CX Institutional | 584 | -32,56 | 0 | |||||
| 2025-05-15 | 13F | Crestline Management, LP | 0 | -100,00 | 0 |