Grundlæggende statistik
| Institutionelle ejere | 194 total, 194 long only, 0 short only, 0 long/short - change of -1,02% MRQ |
| Gennemsnitlig porteføljeallokering | 0.1976 % - change of 2,76% MRQ |
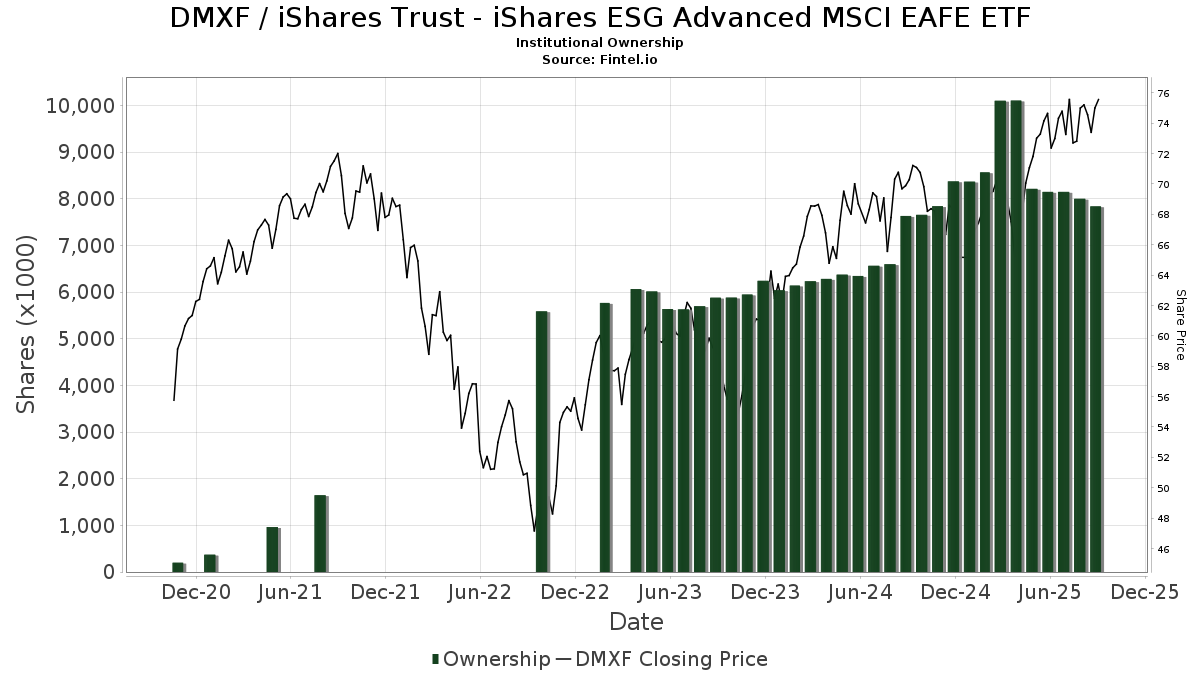
| Institutionelle aktier (lange) | 5.391.350 (ex 13D/G) - change of -0,05MM shares -0,92% MRQ |
| Institutionel værdi (lang) | $ 386.107 USD ($1000) |
Institutionelt ejerskab og aktionærer
iShares Trust - iShares ESG Advanced MSCI EAFE ETF (US:DMXF) har 194 institutionelle ejere og aktionærer, der har indsendt 13D/G- eller 13F-formularer til Securities Exchange Commission (SEC). Disse institutioner har i alt 5,391,350 aktier. Største aktionærer omfatter BlackRock, Inc., IMA Wealth, Inc., Sei Investments Co, Sbe Llc Dba Cedar Cove Wealth Partners, SigFig Wealth Management, LLC, Allworth Financial LP, Adviser Investments LLC, Values Added Financial LLC, Bailard, Inc., and LPL Financial LLC .
iShares Trust - iShares ESG Advanced MSCI EAFE ETF (NasdaqGM:DMXF) institutionel ejerskabsstruktur viser aktuelle positioner i virksomheden efter institutioner og fonde, samt seneste ændringer i positionsstørrelse. Større aktionærer kan omfatte individuelle investorer, investeringsforeninger, hedgefonde eller institutioner. Skema 13D angiver, at investoren besidder (eller besidder) mere end 5 % af virksomheden og har til hensigt (eller har til hensigt at) aktivt at forfølge en ændring i forretningsstrategi. Skema 13G indikerer en passiv investering på over 5%.
The share price as of April 2, 2026 is 75,98 / share. Previously, on April 7, 2025, the share price was 60,05 / share. This represents an increase of 26,53% over that period.
Fondens stemningsscore
Fund Sentiment Score (fka Ownership Accumulation Score) finder de aktier, der bliver mest købt af fonde. Det er resultatet af en sofistikeret, multi-faktor kvantitativ model, der identificerer virksomheder med de højeste niveauer af institutionel akkumulering. Scoringsmodellen bruger en kombination af den samlede stigning i oplyste ejere, ændringerne i porteføljeallokeringer i disse ejere og andre målinger. Tallet går fra 0 til 100, hvor højere tal indikerer et højere niveau af akkumulering for sine jævnaldrende, og 50 er gennemsnittet.
Opdateringsfrekvens: Dagligt
Se Ownership Explorer, som giver en liste over højest rangerende virksomheder.
AI+ Ask Fintel’s AI assistant about iShares Trust - iShares ESG Advanced MSCI EAFE ETF.
Select a question to share a public post with an AI-crafted answer.
Thinking of good questions…
Institutionel Put/Call-forhold
Ud over at indberette standardaktie- og gældsudstedelser skal institutter med mere end 100 mill. aktiver under forvaltning også oplyse deres put- og call-optionsbeholdninger. Da salgsoptioner generelt indikerer negativ stemning, og købsoptioner indikerer positiv stemning, kan vi få en fornemmelse af den overordnede institutionelle stemning ved at plotte forholdet mellem put og kald. Diagrammet til højre viser det historiske put/call-forhold for dette instrument.
Brug af Put/Call Ratio som en indikator for investorernes stemning overvinder en af de vigtigste mangler ved at bruge totalt institutionelt ejerskab, som er, at en betydelig mængde af aktiver under forvaltning investeres passivt for at spore indekser. Passivt forvaltede fonde køber typisk ikke optioner, så indikatoren for put/call-forholdet følger mere nøje følelsen af aktivt forvaltede fonde.
13D/G-arkivering
Vi præsenterer 13D/G ansøgninger separat fra 13F ansøgninger på grund af den forskellige behandling af SEC. 13D/G-ansøgninger kan indgives af grupper af investorer (med én ledende), hvorimod 13F-ansøgninger ikke kan. Dette resulterer i situationer, hvor en investor kan indsende en 13D/G, der rapporterer én værdi for de samlede aktier (der repræsenterer alle de aktier, der ejes af investorgruppen), men derefter indsender en 13F, der rapporterer en anden værdi for de samlede aktier (der udelukkende repræsenterer deres egne) ejendomsret). Det betyder, at aktieejerskab af 13D/G-arkiver og 13F-arkiveringer ofte ikke er direkte sammenlignelige, så vi præsenterer dem separat.
Bemærk: Fra den 16. maj 2021 viser vi ikke længere ejere, der ikke har indsendt en 13D/G inden for det seneste år. Tidligere viste vi den fulde historie af 13D/G-arkiver. Generelt skal enheder, der er forpligtet til at indgive 13D/G-ansøgninger, indgive mindst årligt, før de indsender en afsluttende ansøgning. Dog forlader fonde nogle gange positioner uden at indsende en afsluttende ansøgning (dvs. de afvikler), så visning af den fulde historie resulterede nogle gange i forvirring om det nuværende ejerskab. For at undgå forvirring viser vi nu kun 'aktuelle' ejere - det vil sige - ejere, der har anmeldt inden for det seneste år.
Upgrade to unlock premium data.
| Fil dato | Form | Investor | Forrige Aktier |
Seneste Aktier |
Δ Aktier (Procent) |
Ejendomsret (Procent) |
Δ Ejerskab (Procent) |
|
|---|---|---|---|---|---|---|---|---|
| 2026-01-21 | BlackRock Portfolio Management LLC | 909,043 | 844,783 | -7.07 | 9.80 | 19.51 | ||
| 2025-04-22 | BlackRock, Inc. | 884,491 | 0 | -100.00 | 0.00 | -100.00 |
13F og NPORT arkivering
Detaljer om 13F-arkivering er gratis. Detaljer om NP-ansøgninger kræver et premium-medlemskab. Grønne rækker angiver nye positioner. Røde rækker angiver lukkede positioner. Klik på linket ikon for at se den fulde transaktionshistorik.
Opgrader
for at låse premium-data op og eksportere til Excel ![]() .
.
| Fil dato | Kilde | Investor | Type | Gennemsnitlig pris (Øst) |
Aktier | Δ Aktier (%) |
Rapporteret Værdi ($1000) |
Δ Værdi (%) |
Port Alloc (%) |
|
|---|---|---|---|---|---|---|---|---|---|---|
| 2025-11-13 | 13F | Regal Investment Advisors LLC | 0 | -100,00 | 0 | |||||
| 2026-02-10 | 13F | B&l Asset Management Llc | 3.776 | 284 | ||||||
| 2025-11-14 | 13F | Mount Yale Investment Advisors, LLC | 0 | -100,00 | 0 | -100,00 | ||||
| 2026-01-08 | 13F | Wealth Enhancement Advisory Services, Llc | 3.292 | -30,91 | 255 | -30,41 | ||||
| 2026-01-14 | 13F | Leonard Rickey Investment Advisors P.L.L.C. | 8.216 | -15,36 | 618 | -16,05 | ||||
| 2026-02-27 | 13F | Financially in Tune, LLC | 5.760 | 433 | ||||||
| 2026-01-21 | 13F | Walkner Condon Financial Advisors LLC | 47.802 | 8,93 | 3.593 | 8,10 | ||||
| 2025-11-14 | 13F | Wiley Bros.-aintree Capital, Llc | 0 | -100,00 | 0 | |||||
| 2026-03-04 | 13F | SHP Wealth Management | 478 | 36 | ||||||
| 2026-02-13 | 13F | Transamerica Financial Advisors, Inc. | 28 | 2 | ||||||
| 2025-11-06 | 13F | Tempus Wealth Planning, LLC | 0 | -100,00 | 0 | |||||
| 2026-02-17 | 13F | Agf Management Ltd | 4.300 | 16,22 | 323 | 15,36 | ||||
| 2025-10-31 | 13F | Emerald Investment Partners, Llc | 0 | -100,00 | 0 | |||||
| 2026-02-12 | 13F | Federation des caisses Desjardins du Quebec | 35 | 0,00 | 3 | 0,00 | ||||
| 2026-02-04 | 13F | Urban Financial Advisory Corp | 10.606 | 3,34 | 797 | 2,57 | ||||
| 2026-02-17 | 13F | Cetera Investment Advisers | 40.072 | 1,91 | 3.012 | 1,11 | ||||
| 2025-10-17 | 13F | Austin Private Wealth, LLC | 0 | -100,00 | 0 | |||||
| 2026-02-11 | 13F | Atlantic Private Wealth, LLC | 42.022 | 0,04 | 3.158 | -0,72 | ||||
| 2026-02-12 | 13F | Hrt Financial Lp | 0 | -100,00 | 0 | |||||
| 2026-01-30 | 13F | Strategic Blueprint, LLC | 0 | -100,00 | 0 | |||||
| 2026-02-12 | 13F | Commonwealth Equity Services, Llc | 20.298 | -27,47 | 1.526 | 76.150,00 | ||||
| 2026-01-20 | 13F | SOA Wealth Advisors, LLC. | 3.429 | 0,38 | 258 | -0,39 | ||||
| 2026-01-23 | 13F | Nbt Bank N A /ny | 1.572 | 36,93 | 136 | 29,52 | ||||
| 2026-01-15 | 13F | RCS Financial Planning, LLC | 0 | -100,00 | 0 | |||||
| 2026-01-21 | 13F | Westfuller Advisors, LLC | 32.379 | 3,35 | 2.434 | 2,57 | ||||
| 2026-02-17 | 13F | Advisor Group Holdings, Inc. | 29.860 | -9,82 | 2.245 | -9,95 | ||||
| 2026-01-27 | 13F | TD Waterhouse Canada Inc. | 43.715 | 0,00 | 3.279 | -1,80 | ||||
| 2025-10-15 | 13F | Pensionmark Financial Group, Llc | 0 | -100,00 | 0 | |||||
| 2026-02-12 | 13F | Keystone Financial Services | 0 | -100,00 | 0 | |||||
| 2026-02-11 | 13F | Janney Montgomery Scott LLC | 6.404 | -0,03 | 0 | |||||
| 2026-02-17 | 13F | Bank Of America Corp /de/ | 23.788 | 3,90 | 1.788 | 3,06 | ||||
| 2026-02-18 | 13F | GWM Advisors LLC | 25.196 | 1,14 | 1.894 | 0,37 | ||||
| 2026-04-02 | 13F | Noble Wealth Management PBC | 166 | 0,00 | 13 | 0,00 | ||||
| 2026-02-05 | 13F | Plancorp, LLC | 18.163 | 0,00 | 1.365 | -0,73 | ||||
| 2026-01-07 | 13F | Magnus Financial Group LLC | 10.679 | 2,68 | 803 | 1,91 | ||||
| 2026-02-17 | 13F | Private Advisor Group, LLC | 5.204 | 2,66 | 391 | 2,09 | ||||
| 2026-02-13 | 13F | Ubs Asset Management Americas Inc | 660 | -0,60 | 50 | -2,00 | ||||
| 2026-02-13 | 13F | Mml Investors Services, Llc | 10.847 | 5,41 | 815 | 4,62 | ||||
| 2025-10-30 | 13F | Wbh Advisory Inc | 0 | -100,00 | 0 | -100,00 | ||||
| 2026-01-16 | 13F | Values Added Financial LLC | 95.967 | 7,78 | 7.213 | 6,96 | ||||
| 2026-02-11 | 13F | Prudential Plc | 5.700 | -18,57 | 428 | -19,25 | ||||
| 2025-10-30 | 13F | Envestnet Portfolio Solutions, Inc. | 0 | -100,00 | 0 | |||||
| 2026-02-04 | 13F | Biltmore Family Office, LLC | 2.500 | 0,00 | 188 | -1,06 | ||||
| 2026-02-06 | 13F | Tortoise Investment Management, LLC | 0 | -100,00 | 0 | |||||
| 2026-01-12 | 13F | Skyline Advisors, Inc. | 10.181 | -9,60 | 765 | -10,32 | ||||
| 2026-02-17 | 13F | Citadel Advisors Llc | 0 | -100,00 | 0 | |||||
| 2025-11-03 | 13F | Investor's Fiduciary Advisor Network, LLC | 0 | -100,00 | 0 | |||||
| 2026-02-03 | 13F | MA Private Wealth | 7.997 | 0,45 | 601 | -0,17 | ||||
| 2026-02-13 | 13F | Clarity Asset Management, Inc. | 532 | 3,30 | 40 | 0,00 | ||||
| 2026-02-13 | 13F | Kestra Advisory Services, LLC | 0 | -100,00 | 0 | |||||
| 2026-01-30 | 13F | Sofi Wealth, Llc | 27.270 | 21,59 | 2.050 | 20,67 | ||||
| 2025-10-28 | 13F | Copperleaf Capital, LLC | 0 | -100,00 | 0 | |||||
| 2025-11-13 | 13F | Maia Wealth LLC | 0 | -100,00 | 0 | |||||
| 2026-02-12 | 13F | Principal Securities, Inc. | 0 | -100,00 | 0 | -100,00 | ||||
| 2026-02-05 | 13F | Arjuna Capital | 29.238 | 0,00 | 2.198 | -0,77 | ||||
| 2026-01-21 | 13F | Figure 8 Investment Strategies Llc | 16.351 | 59,97 | 1.229 | 58,66 | ||||
| 2026-02-17 | 13F | Modern Wealth Management, LLC | 28.841 | 42,04 | 2.168 | 40,99 | ||||
| 2026-02-12 | 13F | Jane Street Group, Llc | 19.744 | -70,81 | 1.484 | -71,05 | ||||
| 2026-01-23 | 13F | Farther Finance Advisors, LLC | 13.183 | 14,52 | 991 | 13,66 | ||||
| 2026-01-16 | 13F | First Pacific Financial | 19.329 | -3,70 | 1.453 | -4,47 | ||||
| 2025-11-10 | 13F | Jfs Wealth Advisors, Llc | 0 | -100,00 | 0 | |||||
| 2026-02-02 | 13F | Robertson Stephens Wealth Management, LLC | 14.012 | 0,00 | 1.053 | -0,75 | ||||
| 2026-02-04 | 13F | Summit Wealth Group Llc / Co | 13.307 | 1.000 | ||||||
| 2026-02-04 | 13F | Birchbrook, Inc. | 304 | 23,08 | 23 | 22,22 | ||||
| 2026-02-17 | 13F | Cdkv Holdings Llc | 1.485 | 112 | ||||||
| 2026-02-13 | 13F | Change Path, LLC | 3.749 | 0,40 | 282 | -0,35 | ||||
| 2026-02-17 | 13F | Zacks Investment Management | 2.763 | 0,00 | 208 | -0,96 | ||||
| 2026-02-05 | 13F | Cambridge Investment Research Advisors, Inc. | 8.789 | -16,10 | 1 | |||||
| 2026-02-06 | 13F | IFP Advisors, Inc | 20 | 5,26 | 2 | 0,00 | ||||
| 2026-01-13 | 13F | CoreCap Advisors, LLC | 4.706 | 3,98 | 354 | 3,22 | ||||
| 2025-10-31 | 13F | Sagespring Wealth Partners, Llc | 0 | -100,00 | 0 | |||||
| 2026-02-13 | 13F | Haverford Trust Co | 6.054 | 0,00 | 455 | -0,66 | ||||
| 2026-02-17 | 13F | Main Street Financial Solutions, LLC | 4.581 | -27,95 | 344 | -28,48 | ||||
| 2026-01-26 | 13F | West Wealth Group, LLC | 3.085 | 1,18 | 232 | -0,86 | ||||
| 2026-01-29 | 13F | UMA Financial Services, Inc. | 2.355 | -9,87 | 177 | -10,66 | ||||
| 2026-02-05 | 13F | Thrivent Financial For Lutherans | 29.560 | 982,78 | 2 | |||||
| 2026-02-13 | 13F | Gould Asset Management Llc /ca/ | 19.450 | 0,00 | 1.462 | -0,81 | ||||
| 2025-11-13 | 13F | LifePlan Investment Advisors, Inc. | 0 | -100,00 | 0 | -100,00 | ||||
| 2026-01-29 | 13F | Kestra Private Wealth Services, Llc | 5.712 | 2,33 | 429 | 1,66 | ||||
| 2026-01-26 | 13F | PFG Investments, LLC | 2.909 | 219 | ||||||
| 2026-02-12 | 13F | Connecticut Wealth Management, LLC | 0 | -100,00 | 0 | |||||
| 2026-02-10 | 13F | Savant Capital, LLC | 6.969 | 3,35 | 524 | 2,55 | ||||
| 2026-02-12 | 13F | Litman Gregory Asset Management LLC | 1.816 | 136 | ||||||
| 2026-01-20 | 13F | Stratos Wealth Partners, LTD. | 10.840 | 9,55 | 815 | 8,68 | ||||
| 2026-02-13 | 13F | Aire Advisors, Llc | 2.692 | 0,60 | 202 | 0,00 | ||||
| 2025-11-14 | 13F | Strategic Wealth Partners, Ltd. | 16 | 1 | ||||||
| 2026-02-06 | 13F | GPS Wealth Strategies Group, LLC | 0 | -100,00 | 0 | |||||
| 2026-01-16 | 13F | Perigon Wealth Management, LLC | 10.979 | -9,58 | 825 | -10,23 | ||||
| 2026-02-17 | 13F | GeoWealth Management, LLC | 0 | -100,00 | 0 | |||||
| 2026-01-29 | 13F | Golden State Equity Partners | 2.911 | 219 | ||||||
| 2026-02-10 | 13F | Moors & Cabot, Inc. | 12.716 | 4,80 | 956 | 3,92 | ||||
| 2026-02-04 | 13F | Ameritas Advisory Services, LLC | 5.395 | 405 | ||||||
| 2026-02-04 | 13F | Raelipskie Partnership | 1.354 | -5,91 | 102 | -6,48 | ||||
| 2026-02-13 | 13F | J. Mark Nickell & Co. | 2.775 | 209 | ||||||
| 2026-02-17 | 13F | Creative Planning | 17.010 | 7,33 | 1.278 | 6,50 | ||||
| 2025-11-10 | 13F | EverSource Wealth Advisors, LLC | 0 | -100,00 | 0 | |||||
| 2026-01-21 | 13F | Flagship Harbor Advisors, Llc | 3.969 | 5,70 | 298 | 4,93 | ||||
| 2026-01-07 | 13F | VERITY Wealth Advisors | 13.266 | 0,00 | 997 | -0,70 | ||||
| 2026-02-10 | 13F | Envestnet Asset Management Inc | 13.940 | -40,43 | 1.048 | -40,91 | ||||
| 2026-01-16 | 13F | Oregon Pacific Wealth Management, LLC | 0 | -100,00 | 0 | -100,00 | ||||
| 2026-02-13 | 13F | Mariner, LLC | 6.331 | 102,14 | 476 | 100,42 | ||||
| 2026-02-05 | 13F | Sage Financial Management Group, Inc. | 4.830 | 0,54 | 363 | 0,00 | ||||
| 2026-02-10 | 13F | JMG Financial Group, Ltd. | 9.190 | -0,50 | 691 | -1,29 | ||||
| 2026-02-12 | 13F | Rossby Financial, LCC | 678 | 0,00 | 51 | -1,96 | ||||
| 2026-01-22 | 13F | Bfsg, Llc | 88 | 0,00 | 7 | 0,00 | ||||
| 2026-02-02 | 13F | Miracle Mile Advisors, LLC | 4.105 | 0,88 | 309 | 0,00 | ||||
| 2025-11-07 | 13F | Financial Advisors, LLC | 13.395 | 0,00 | 1.015 | 1,71 | ||||
| 2026-02-05 | 13F | Armor Investment Advisors, LLC | 991 | 74 | ||||||
| 2026-01-26 | 13F | Cwm, Llc | 48.562 | 4,76 | 4 | 0,00 | ||||
| 2026-01-30 | 13F | Urban Wealth Management, LLC | 0 | -100,00 | 0 | |||||
| 2026-02-10 | 13F | Spectrum Planning & Advisory Services Inc. | 2.687 | 0,07 | 202 | -0,99 | ||||
| 2026-02-13 | 13F | National Bank Of Canada /fi/ | 679 | 0,00 | 51 | -1,96 | ||||
| 2026-01-15 | 13F | Stewardship Advisors, LLC | 6.980 | 5,31 | 525 | 4,38 | ||||
| 2026-01-09 | 13F | Diversified Trust Co | 12.276 | 12,77 | 923 | 11,89 | ||||
| 2026-01-20 | 13F | Ascent Group, LLC | 4.143 | -1,12 | 311 | -1,89 | ||||
| 2026-02-13 | 13F | Cornerstone Financial Management LLC | 15.801 | 1.188 | ||||||
| 2026-02-13 | 13F | Pathstone Holdings, LLC | 27.479 | -2,99 | 2.065 | -3,73 | ||||
| 2026-01-16 | 13F | Empirical Financial Services, LLC d.b.a. Empirical Wealth Management | 9.155 | 0,00 | 688 | -0,72 | ||||
| 2026-02-12 | 13F | Betterment LLC | 8.889 | -3,89 | 1 | |||||
| 2026-01-12 | 13F | Lifelong Wealth Advisors, Inc. | 0 | -100,00 | 0 | |||||
| 2025-11-12 | 13F | Transce3nd, LLC | 0 | -100,00 | 0 | |||||
| 2025-11-14 | 13F | WealthTrak Capital Management LLC | 0 | -100,00 | 0 | |||||
| 2026-02-11 | 13F | Franklin Resources Inc | 9.063 | 0,00 | 681 | -0,73 | ||||
| 2026-01-26 | 13F | Decker Retirement Planning Inc. | 31.168 | 9,86 | 2.343 | 9,03 | ||||
| 2026-02-11 | 13F | Avise Financial Cooperative, Inc. | 6.750 | 507 | ||||||
| 2025-10-14 | 13F | Dohj, Llc | 0 | -100,00 | 0 | |||||
| 2026-02-17 | 13F | Jones Financial Companies Lllp | 363 | 5,52 | 27 | 8,00 | ||||
| 2025-11-05 | 13F | Buttonwood Financial Group, LLC | 0 | -100,00 | 0 | |||||
| 2026-01-30 | 13F | Us Bancorp \de\ | 1.964 | 67,15 | 148 | 67,05 | ||||
| 2026-02-11 | 13F | Milestone Investment Advisors LLC | 2.335 | -0,68 | 175 | -1,69 | ||||
| 2025-11-06 | 13F | Atria Investments Llc | 0 | -100,00 | 0 | |||||
| 2026-02-13 | 13F | Sei Investments Co | 357.561 | 9,19 | 26.874 | 8,36 | ||||
| 2025-10-27 | 13F | Hoxton Planning & Management, LLC | 0 | -100,00 | 0 | |||||
| 2026-01-20 | 13F | Pine Harbor Wealth Management, LLC | 3.460 | 0,00 | 260 | -0,76 | ||||
| 2026-02-17 | 13F | Captrust Financial Advisors | 0 | -100,00 | 0 | |||||
| 2025-11-12 | 13F | First Trust Advisors Lp | 0 | -100,00 | 0 | |||||
| 2026-02-17 | 13F | Susquehanna International Group, Llp | 53.382 | -7,53 | 4.012 | -8,23 | ||||
| 2026-02-06 | 13F | Eqis Capital Management, Inc. | 0 | -100,00 | 0 | |||||
| 2026-02-10 | 13F | Godfrey Financial Associates, Inc. | 2.411 | 181 | ||||||
| 2026-02-11 | 13F | Commonwealth Retirement Investments LLC | 116 | 9 | ||||||
| 2026-02-05 | 13F | Allworth Financial LP | 176.920 | -1,21 | 13.297 | -1,96 | ||||
| 2026-01-23 | 13F | Halbert Hargrove Global Advisors, Llc | 7.592 | 4,23 | 571 | 3,45 | ||||
| 2026-02-02 | 13F | One Wealth Advisors, LLC | 14.310 | -15,47 | 1.076 | -16,15 | ||||
| 2026-01-22 | 13F | Venturi Wealth Management, LLC | 3.049 | -0,13 | 229 | -0,87 | ||||
| 2025-11-04 | 13F | Wealthgarden F.s. Llc | 0 | -100,00 | 0 | |||||
| 2026-01-27 | 13F | Optas, LLC | 4.671 | -0,55 | 351 | -1,13 | ||||
| 2026-02-09 | 13F | Harbour Investments, Inc. | 1.134 | -27,45 | 85 | -27,97 | ||||
| 2025-11-07 | 13F | Pnc Financial Services Group, Inc. | 0 | -100,00 | 0 | |||||
| 2026-02-11 | 13F | Parallel Advisors, LLC | 11 | 0,00 | 1 | |||||
| 2025-11-12 | 13F | One Wealth Capital Management, Llc | 0 | -100,00 | 0 | |||||
| 2026-02-13 | 13F | Balanced Rock Investment Advisor | 62.024 | 0,58 | 4.662 | -0,19 | ||||
| 2026-02-13 | 13F | Ally Invest Advisors Inc. | 12.344 | -7,96 | 928 | -8,67 | ||||
| 2026-02-13 | 13F | Kilter Group LLC | 10 | 0,00 | 1 | |||||
| 2026-02-12 | 13F | BlackRock, Inc. | 844.783 | 2,77 | 63.494 | 1,98 | ||||
| 2026-01-27 | 13F | Old Second National Bank Of Aurora | 3.280 | 247 | ||||||
| 2026-02-02 | 13F | Opes Wealth Management LLC | 19.970 | 0,76 | 1.501 | -0,07 | ||||
| 2025-10-24 | 13F | We Are One Seven, LLC | 0 | -100,00 | 0 | -100,00 | ||||
| 2026-01-26 | 13F | Valmark Advisers, Inc. | 2.991 | 0,00 | 225 | -0,88 | ||||
| 2026-01-27 | 13F | Klaas Financial Asset Advisors, LLC | 45.614 | -4,27 | 3.428 | -4,99 | ||||
| 2026-01-14 | 13F | Pathway Financial Advisors LLC | 5.934 | 6,29 | 460 | 8,77 | ||||
| 2026-01-29 | 13F | Dunhill Financial, LLC | 831 | 225,88 | 62 | 226,32 | ||||
| 2026-01-29 | 13F | Equita Financial Network, Inc. | 38.422 | 2,88 | 2.888 | 2,09 | ||||
| 2026-01-14 | 13F | Wolff Wiese Magana Llc | 58 | 18,37 | 4 | 33,33 | ||||
| 2026-02-04 | 13F | Bailard, Inc. | 89.862 | 14,60 | 6.754 | 13,72 | ||||
| 2026-03-31 | 13F | Sankala Group LLC | 84 | -58,62 | 6 | -62,50 | ||||
| 2026-02-12 | 13F | CIBC Private Wealth Group, LLC | 446 | 34 | ||||||
| 2025-11-12 | 13F | Brinker Capital Investments, LLC | 0 | -100,00 | 0 | |||||
| 2026-02-18 | 13F | Beacon Pointe Advisors, LLC | 14.962 | 9,36 | 1.125 | 8,49 | ||||
| 2026-02-11 | 13F | Cerity Partners LLC | 8.622 | 0,00 | 648 | -0,77 | ||||
| 2026-01-23 | 13F | Assetmark, Inc | 2.036 | -9,63 | 153 | -10,00 | ||||
| 2026-02-13 | 13F | Ariadne Wealth Management, LP | 6.259 | 0,76 | 508 | 6,95 | ||||
| 2026-02-13 | 13F | Flow Traders U.s. Llc | 58.319 | -73,39 | 4 | -75,00 | ||||
| 2026-02-11 | 13F | Fiera Capital Corp | 30.315 | 21,19 | 2.278 | 20,27 | ||||
| 2026-01-23 | 13F | Financial Connections Group, Inc. | 77.169 | 1,01 | 6 | 0,00 | ||||
| 2025-10-10 | 13F | Sharkey, Howes & Javer | 0 | -100,00 | 0 | |||||
| 2026-02-05 | 13F | Rossmore Private Capital | 2.218 | 0,00 | 167 | -0,60 | ||||
| 2025-11-07 | 13F | Wealth Alliance | 0 | -100,00 | 0 | |||||
| 2026-02-11 | 13F | IMA Wealth, Inc. | 732.980 | 0,22 | 55.036 | -0,55 | ||||
| 2025-10-30 | 13F | Twin Peaks Wealth Advisors, LLC | 0 | -100,00 | 0 | |||||
| 2026-01-05 | 13F | Park Avenue Securities Llc | 0 | -100,00 | 0 | |||||
| 2026-01-21 | 13F | Albion Financial Group /ut | 38.445 | -3,02 | 2.890 | -3,76 | ||||
| 2026-02-13 | 13F | Morgan Stanley | 6.918 | -92,35 | 520 | -92,41 | ||||
| 2026-02-05 | 13F | Bessemer Group Inc | 180 | 0 | ||||||
| 2025-11-14 | 13F | Capital Analysts, Inc. | 0 | -100,00 | 0 | |||||
| 2026-01-07 | 13F | Central Pacific Bank - Trust Division | 5.853 | 11,72 | 440 | 10,86 | ||||
| 2026-02-11 | 13F | Jpmorgan Chase & Co | 62.796 | -9,02 | 4.720 | -9,72 | ||||
| 2026-02-19 | 13F | CI Private Wealth, LLC | 32.026 | -6,60 | 2.407 | -7,32 | ||||
| 2026-01-23 | 13F | Invera Wealth Advisors, LLC | 65.321 | -2,04 | 4.910 | -2,79 | ||||
| 2026-02-06 | 13F | Global Retirement Partners, LLC | 172 | -82,57 | 13 | -83,78 | ||||
| 2026-02-06 | 13F | Creative Financial Designs Inc /adv | 51 | -76,82 | 4 | -81,25 | ||||
| 2025-11-14 | 13F | Equitable Holdings, Inc. | 0 | -100,00 | 0 | |||||
| 2026-02-13 | 13F | MAI Capital Management | 7.967 | 3,12 | 599 | 2,22 | ||||
| 2025-11-03 | 13F | Bank of New York Mellon Corp | 0 | -100,00 | 0 | |||||
| 2026-02-17 | 13F | Lazard Asset Management Llc | 13.209 | 0,00 | 993 | -0,80 | ||||
| 2026-01-30 | 13F | Mogy Joel R Investment Counsel Inc | 1.265 | 0,00 | 95 | 0,00 | ||||
| 2026-02-06 | 13F | Larson Financial Group LLC | 13 | 1 | ||||||
| 2025-11-14 | 13F | United Capital Financial Advisers, Llc | 0 | -100,00 | 0 | -100,00 | ||||
| 2026-01-21 | 13F | MBE Wealth Management, LLC | 2.883 | -19,72 | 217 | -20,30 | ||||
| 2026-01-29 | 13F | Sanctuary Advisors, LLC | 7.616 | 1,48 | 572 | 0,70 | ||||
| 2026-01-23 | 13F | Atwater Malick LLC | 32.273 | 1,43 | 2.426 | 0,66 | ||||
| 2026-02-14 | 13F | Rockefeller Capital Management L.P. | 1.098 | -33,97 | 83 | -34,92 | ||||
| 2025-11-14 | 13F | Snowden Capital Advisors LLC | 0 | -100,00 | 0 | |||||
| 2026-02-11 | 13F | LPL Financial LLC | 85.031 | 41,33 | 6.391 | 40,25 | ||||
| 2026-02-13 | 13F | 1 North Wealth Services Llc | 130 | 0,00 | 10 | 0,00 | ||||
| 2026-02-13 | 13F | Golden State Wealth Management, LLC | 6.002 | 0,70 | 451 | 0,00 | ||||
| 2026-02-05 | 13F | Accredited Investors Inc. | 83.409 | 4,66 | 6.269 | 3,86 | ||||
| 2026-01-12 | 13F | CVA Family Office, LLC | 197 | 0,00 | 15 | 0,00 | ||||
| 2026-02-13 | 13F | Aptus Capital Advisors, LLC | 5.979 | 1,18 | 449 | 0,45 | ||||
| 2026-02-13 | 13F | Integrated Wealth Concepts LLC | 5.463 | -76,73 | 411 | -76,93 | ||||
| 2026-02-03 | 13F | RFG Advisory, LLC | 2.882 | -64,54 | 217 | -64,88 | ||||
| 2026-02-13 | 13F | Wells Fargo & Company/mn | 20.819 | 9,64 | 1.565 | 8,76 | ||||
| 2026-02-17 | 13F | Royal Bank Of Canada | 39.844 | -8,47 | 2.995 | -9,13 | ||||
| 2026-02-17 | 13F | NorthRock Partners, LLC | 28.307 | 952,70 | 2.128 | 947,78 | ||||
| 2026-01-21 | 13F | Warner Financial, Inc | 15.319 | 9,37 | 1 | 0,00 | ||||
| 2026-02-17 | 13F | Raymond James Financial Inc | 6.360 | -32,88 | 478 | -33,33 | ||||
| 2026-02-13 | 13F | Resources Investment Advisors, LLC. | 11.746 | -13,70 | 883 | -14,37 | ||||
| 2026-02-13 | 13F | SRS Capital Advisors, Inc. | 2.667 | 200 | ||||||
| 2026-01-23 | 13F | Keener Financial Planning LLC | 0 | -100,00 | 0 | |||||
| 2026-02-11 | 13F | Aufman Associates Inc | 2.819 | 3,34 | 212 | 2,43 | ||||
| 2026-02-11 | 13F | O'shaughnessy Asset Management, Llc | 3.635 | 0,00 | 273 | -0,73 | ||||
| 2026-01-27 | 13F | Human Investing LLC | 3.634 | -0,74 | 273 | -1,44 | ||||
| 2025-11-14 | 13F | Comerica Bank | 0 | -100,00 | 0 | |||||
| 2025-11-12 | 13F | Ameriflex Group, Inc. | 0 | -100,00 | 0 | |||||
| 2026-02-10 | 13F | Eq Llc | 0 | -100,00 | 0 | |||||
| 2026-02-13 | 13F | Smartleaf Asset Management LLC | 5 | -61,54 | 0 | |||||
| 2026-02-17 | 13F | Two Sigma Securities, Llc | 0 | -100,00 | 0 | |||||
| 2026-02-12 | 13F | Steward Partners Investment Advisory, Llc | 4.528 | -20,88 | 340 | -21,48 | ||||
| 2026-02-12 | 13F | Bank Of Montreal /can/ | 33.009 | 3.551,44 | 2.481 | 3.547,06 | ||||
| 2026-01-12 | 13F | National Wealth Management Group, LLC | 3.529 | 0,66 | 265 | 0,00 | ||||
| 2026-01-26 | 13F | XY Planning Network, Inc. | 24.019 | 15,27 | 1.805 | 16,38 | ||||
| 2026-02-12 | 13F | Adviser Investments LLC | 145.106 | 11,22 | 10.906 | 10,37 | ||||
| 2026-01-28 | 13F | Morton Brown Family Wealth, LLC | 60 | 0,00 | 5 | 0,00 | ||||
| 2026-02-17 | 13F | Fmr Llc | 40.698 | -8,58 | 3.059 | -9,29 | ||||
| 2026-02-12 | 13F | Sbe Llc Dba Cedar Cove Wealth Partners | 235.791 | 17.722 | ||||||
| 2026-01-12 | 13F | Shotwell Rutter Baer Inc | 19.618 | 1,41 | 1.511 | 1,48 | ||||
| 2026-01-20 | 13F | Hanson & Doremus Investment Management | 769 | 1,72 | 0 | |||||
| 2026-02-12 | 13F | RKL Wealth Management LLC | 2.833 | 3,36 | 213 | 2,42 | ||||
| 2025-10-20 | 13F | Merit Financial Group, LLC | 0 | -100,00 | 0 | |||||
| 2026-01-13 | 13F | Regatta Capital Group, Llc | 54.272 | 9,36 | 4.079 | 8,54 | ||||
| 2026-01-29 | 13F | UBS Group AG | 55.410 | 1,00 | 4.165 | 0,22 | ||||
| 2026-02-03 | 13F | International Assets Investment Management, Llc | 16 | 1 | ||||||
| 2026-01-16 | 13F | SigFig Wealth Management, LLC | 233.148 | 2,84 | 17.523 | 2,44 | ||||
| 2025-11-12 | 13F | Armis Advisers, LLC | 0 | -100,00 | 0 | |||||
| 2026-01-26 | 13F | AE Wealth Management LLC | 7 | 0,00 | 1 | |||||
| 2026-02-17 | 13F | Humankind Investments LLC | 4.298 | 2,11 | 323 | 1,25 | ||||
| 2026-02-05 | 13F | Tucker Asset Management Llc | 12 | 1 | ||||||
| 2026-02-10 | 13F | Evolution Wealth Management Inc. | 419 | 64,96 | 31 | 63,16 | ||||
| 2026-02-11 | 13F | Portfolio Design Labs, LLC | 3.766 | 0,00 | 283 | -0,70 | ||||
| 2026-01-20 | 13F | Savvy Advisors, Inc. | 4.046 | 2,59 | 304 | 2,01 | ||||
| 2026-02-17 | 13F | Quantinno Capital Management LP | 2.973 | 0,00 | 223 | -0,89 | ||||
| 2026-02-06 | 13F | HighTower Advisors, LLC | 62.447 | -9,05 | 4.694 | -9,75 | ||||
| 2025-11-14 | 13F | Gen-Wealth Partners Inc | 0 | -100,00 | 0 | |||||
| 2026-01-23 | 13F | Baillie Gifford & Co | 0 | -100,00 | 0 | |||||
| 2026-01-20 | 13F | Revolve Wealth Partners, LLC | 18.242 | 5,76 | 1.371 | 4,98 | ||||
| 2025-10-29 | 13F | Theory Financial Llc | 0 | -100,00 | 0 | |||||
| 2025-10-16 | 13F | Horst & Graben Wealth Management LLC | 0 | -100,00 | 0 | |||||
| 2026-02-10 | 13F/A | Northwestern Mutual Wealth Management Co | 22.879 | 4,78 | 1.720 | 3,99 |