Grundlæggende statistik
| Institutionelle aktier (lange) | 26.933.087 - 88,86% (ex 13D/G) - change of -7,90MM shares -22,63% MRQ |
| Institutionel værdi (lang) | $ 3.206.905 USD ($1000) |
Institutionelt ejerskab og aktionærer
Copa Holdings, S.A. (US:CPA) har 297 institutionelle ejere og aktionærer, der har indsendt 13D/G- eller 13F-formularer til Securities Exchange Commission (SEC). Disse institutioner har i alt 26,933,087 aktier. Største aktionærer omfatter Capital World Investors, Baillie Gifford & Co, Sprucegrove Investment Management Ltd, Jpmorgan Chase & Co, Dimensional Fund Advisors Lp, Fmr Llc, Renaissance Technologies Llc, Driehaus Capital Management Llc, Captrust Financial Advisors, and Brandes Investment Partners, Lp .
Copa Holdings, S.A. (NYSE:CPA) institutionel ejerskabsstruktur viser aktuelle positioner i virksomheden efter institutioner og fonde, samt seneste ændringer i positionsstørrelse. Større aktionærer kan omfatte individuelle investorer, investeringsforeninger, hedgefonde eller institutioner. Skema 13D angiver, at investoren besidder (eller besidder) mere end 5 % af virksomheden og har til hensigt (eller har til hensigt at) aktivt at forfølge en ændring i forretningsstrategi. Skema 13G indikerer en passiv investering på over 5%.
The share price as of April 21, 2026 is 121,00 / share. Previously, on April 22, 2025, the share price was 87,03 / share. This represents an increase of 39,03% over that period.

Fondens stemningsscore
Fund Sentiment Score (fka Ownership Accumulation Score) finder de aktier, der bliver mest købt af fonde. Det er resultatet af en sofistikeret, multi-faktor kvantitativ model, der identificerer virksomheder med de højeste niveauer af institutionel akkumulering. Scoringsmodellen bruger en kombination af den samlede stigning i oplyste ejere, ændringerne i porteføljeallokeringer i disse ejere og andre målinger. Tallet går fra 0 til 100, hvor højere tal indikerer et højere niveau af akkumulering for sine jævnaldrende, og 50 er gennemsnittet.
Opdateringsfrekvens: Dagligt
Se Ownership Explorer, som giver en liste over højest rangerende virksomheder.
AI+ Ask Fintel’s AI assistant about Copa Holdings, S.A..
Select a question to share a public post with an AI-crafted answer.
Thinking of good questions…
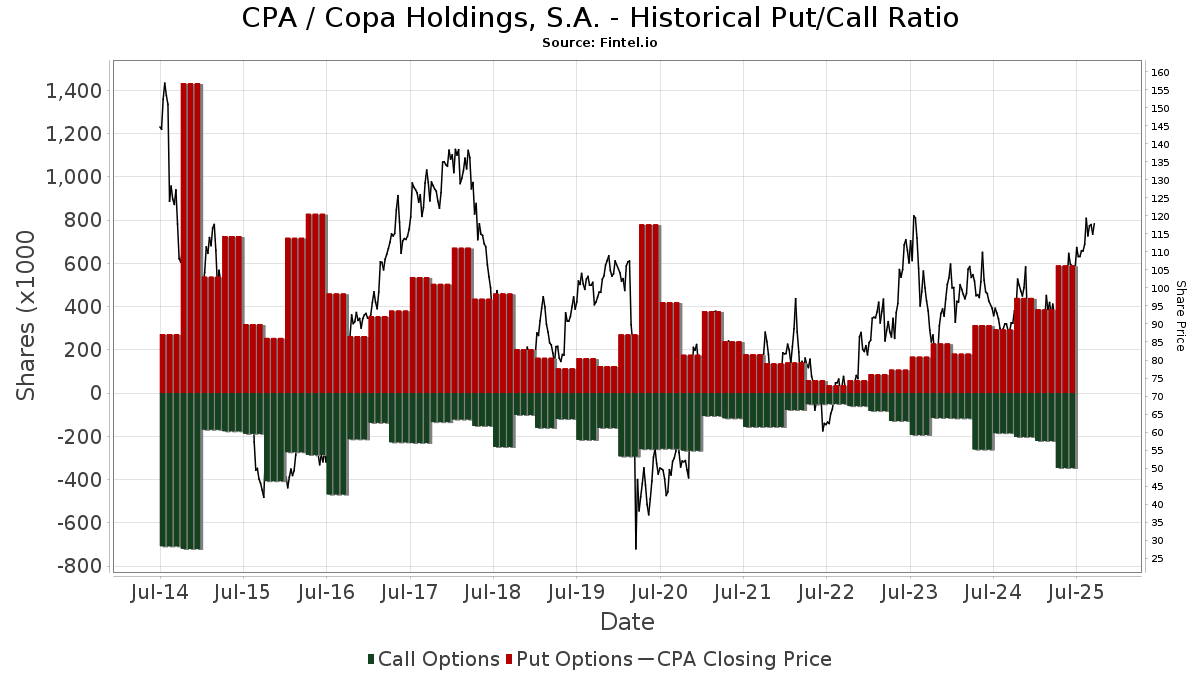
Institutionel Put/Call-forhold
Ud over at indberette standardaktie- og gældsudstedelser skal institutter med mere end 100 mill. aktiver under forvaltning også oplyse deres put- og call-optionsbeholdninger. Da salgsoptioner generelt indikerer negativ stemning, og købsoptioner indikerer positiv stemning, kan vi få en fornemmelse af den overordnede institutionelle stemning ved at plotte forholdet mellem put og kald. Diagrammet til højre viser det historiske put/call-forhold for dette instrument.
Brug af Put/Call Ratio som en indikator for investorernes stemning overvinder en af de vigtigste mangler ved at bruge totalt institutionelt ejerskab, som er, at en betydelig mængde af aktiver under forvaltning investeres passivt for at spore indekser. Passivt forvaltede fonde køber typisk ikke optioner, så indikatoren for put/call-forholdet følger mere nøje følelsen af aktivt forvaltede fonde.
13D/G-arkivering
Vi præsenterer 13D/G ansøgninger separat fra 13F ansøgninger på grund af den forskellige behandling af SEC. 13D/G-ansøgninger kan indgives af grupper af investorer (med én ledende), hvorimod 13F-ansøgninger ikke kan. Dette resulterer i situationer, hvor en investor kan indsende en 13D/G, der rapporterer én værdi for de samlede aktier (der repræsenterer alle de aktier, der ejes af investorgruppen), men derefter indsender en 13F, der rapporterer en anden værdi for de samlede aktier (der udelukkende repræsenterer deres egne) ejendomsret). Det betyder, at aktieejerskab af 13D/G-arkiver og 13F-arkiveringer ofte ikke er direkte sammenlignelige, så vi præsenterer dem separat.
Bemærk: Fra den 16. maj 2021 viser vi ikke længere ejere, der ikke har indsendt en 13D/G inden for det seneste år. Tidligere viste vi den fulde historie af 13D/G-arkiver. Generelt skal enheder, der er forpligtet til at indgive 13D/G-ansøgninger, indgive mindst årligt, før de indsender en afsluttende ansøgning. Dog forlader fonde nogle gange positioner uden at indsende en afsluttende ansøgning (dvs. de afvikler), så visning af den fulde historie resulterede nogle gange i forvirring om det nuværende ejerskab. For at undgå forvirring viser vi nu kun 'aktuelle' ejere - det vil sige - ejere, der har anmeldt inden for det seneste år.
Upgrade to unlock premium data.
| Fil dato | Form | Investor | Forrige Aktier |
Seneste Aktier |
Δ Aktier (Procent) |
Ejendomsret (Procent) |
Δ Ejerskab (Procent) |
|
|---|---|---|---|---|---|---|---|---|
| 2026-02-03 | SPRUCEGROVE INVESTMENT MANAGEMENT LTD | 2,301,884 | 1,911,095 | -16.98 | 6.01 | -16.99 | ||
| 2025-10-24 | JPMORGAN CHASE & CO | 2,552,478 | 1,602,945 | -37.20 | 5.30 | -36.14 |
13F og NPORT arkivering
Detaljer om 13F-arkivering er gratis. Detaljer om NP-ansøgninger kræver et premium-medlemskab. Grønne rækker angiver nye positioner. Røde rækker angiver lukkede positioner. Klik på linket ikon for at se den fulde transaktionshistorik.
Opgrader
for at låse premium-data op og eksportere til Excel ![]() .
.
| Fil dato | Kilde | Investor | Type | Gennemsnitlig pris (Øst) |
Aktier | Δ Aktier (%) |
Rapporteret Værdi ($1000) |
Δ Værdi (%) |
Port Alloc (%) |
|
|---|---|---|---|---|---|---|---|---|---|---|
| 2026-04-14 | 13F | Nbc Securities, Inc. | 13 | 0,00 | 1 | 0,00 | ||||
| 2026-02-13 | 13F | SRS Capital Advisors, Inc. | 32 | 77,78 | 4 | 50,00 | ||||
| 2026-02-04 | 13F | Twin Lakes Capital Management, LLC | 1 | 0,00 | 0 | |||||
| 2026-02-06 | 13F | Csenge Advisory Group | 1.828 | -0,49 | 220 | 0,92 | ||||
| 2026-04-20 | 13F | Kestra Private Wealth Services, Llc | 5.264 | -8,07 | 598 | -13,48 | ||||
| 2026-02-17 | 13F | Delaware Management Holdings, Inc. | 28.836 | 3.478 | ||||||
| 2026-02-03 | 13F | Virtus Family Office LLC | 40.220 | -0,35 | 4.851 | 1,15 | ||||
| 2026-01-12 | 13F | Rialto Wealth Management, LLC | 4 | 33,33 | 0 | |||||
| 2026-02-10 | 13F | Connor, Clark & Lunn Investment Management Ltd. | 20.322 | 895,69 | 2.451 | 912,81 | ||||
| 2026-02-10 | 13F | Globeflex Capital L P | 87.283 | 5,79 | 10.527 | 7,39 | ||||
| 2026-02-13 | 13F | Hudson Bay Capital Management LP | 0 | -100,00 | 0 | |||||
| 2026-02-17 | 13F/A | RBF Capital, LLC | 5.000 | -27,05 | 603 | -25,92 | ||||
| 2026-02-17 | 13F | XTX Topco Ltd | 4.321 | 521 | ||||||
| 2026-02-17 | 13F | Ameriprise Financial Inc | 192.481 | 447,51 | 23.203 | 455,47 | ||||
| 2026-02-17 | 13F | Driehaus Capital Management Llc | 670.657 | 2,49 | 80.888 | 4,03 | ||||
| 2026-02-13 | 13F | Mariner, LLC | 5.696 | -15,48 | 687 | -14,25 | ||||
| 2026-02-11 | 13F | Total Wealth Planning & Management, Inc. | 4.095 | -1,25 | 494 | 8,11 | ||||
| 2025-11-14 | 13F | Point72 Europe (London) LLP | 313 | 37 | ||||||
| 2026-04-07 | 13F | Park Avenue Securities Llc | 9.327 | -35,13 | 1 | 0,00 | ||||
| 2026-02-05 | 13F | IMG Wealth Management, Inc. | 0 | -100,00 | 0 | |||||
| 2026-02-05 | 13F | 1620 Investment Advisors, Inc. | 25 | 0,00 | 3 | 50,00 | ||||
| 2026-02-05 | 13F | Td Private Client Wealth Llc | 10 | 0,00 | 1 | 0,00 | ||||
| 2026-01-26 | 13F | Mirae Asset Global Investments Co., Ltd. | 575 | -23,33 | 69 | -22,47 | ||||
| 2026-02-17 | 13F | Raymond James Financial Inc | 467.285 | -11,04 | 56.359 | -9,70 | ||||
| 2026-01-15 | 13F | Nisa Investment Advisors, Llc | 6.200 | 0,00 | 748 | 1,49 | ||||
| 2026-02-13 | 13F | Transamerica Financial Advisors, Inc. | 1.656 | 12,12 | 200 | 13,71 | ||||
| 2026-02-11 | 13F | Winton Capital Group Ltd | 4.400 | 531 | ||||||
| 2026-04-15 | 13F | Merit Financial Group, LLC | 1.804 | -3,99 | 205 | -9,73 | ||||
| 2026-02-13 | 13F | Formula Growth Ltd | 15.500 | 0,00 | 1.869 | 1,52 | ||||
| 2026-02-13 | 13F | Neuberger Berman Group LLC | 6.442 | 9,91 | 777 | 11,49 | ||||
| 2025-11-14 | 13F | Strategic Wealth Partners, Ltd. | 82 | 10 | ||||||
| 2026-01-08 | 13F | Signet Financial Management, Llc | 2.908 | 5,98 | 351 | 7,36 | ||||
| 2026-02-18 | 13F | Mackenzie Financial Corp | 0 | -100,00 | 0 | |||||
| 2026-02-05 | 13F | Elyxium Wealth, LLC | 53 | 6 | ||||||
| 2026-02-10 | 13F | 1492 Capital Management LLC | 60.829 | 1,83 | 7.337 | 3,37 | ||||
| 2026-04-16 | 13F | Diversified Trust Co | 11.527 | 1.310 | ||||||
| 2026-02-12 | 13F | Wealthspire Advisors, LLC | 0 | -100,00 | 0 | |||||
| 2026-02-13 | 13F | Wells Fargo & Company/mn | 34.300 | 80,44 | 4.137 | 83,17 | ||||
| 2026-04-08 | 13F | DiNuzzo Private Wealth, Inc. | 6 | 0,00 | 1 | |||||
| 2026-02-17 | 13F | Advisor Group Holdings, Inc. | 13.365 | -69,25 | 1.612 | -68,77 | ||||
| 2025-11-14 | 13F | Skopos Labs, Inc. | 0 | -100,00 | 0 | |||||
| 2026-01-26 | 13F | Private Trust Co Na | 130 | 34,02 | 16 | 36,36 | ||||
| 2026-02-03 | 13F | SBI Securities Co., Ltd. | 710 | 9,06 | 86 | 10,39 | ||||
| 2026-02-06 | 13F | Harvest Portfolios Group Inc. | 4.380 | -5,81 | 528 | -4,35 | ||||
| 2026-04-22 | 13F | Pictet Asset Management Holding SA | 28.263 | -73,14 | 3.211 | -74,70 | ||||
| 2026-02-09 | 13F | Legal & General Group Plc | 330 | 0,00 | 40 | 0,00 | ||||
| 2026-02-13 | 13F | Cape Ann Asset Management Ltd | 219.800 | 0,83 | 26.510 | 2,35 | ||||
| 2026-02-02 | 13F | VELA Investment Management, LLC | 37.393 | 6,00 | 4.510 | 7,59 | ||||
| 2026-02-05 | 13F | Park Square Financial Group, LLC | 0 | -100,00 | 0 | -100,00 | ||||
| 2026-04-21 | 13F | Wasatch Advisors Inc | 217.648 | -52,14 | 24.727 | -54,92 | ||||
| 2026-02-11 | 13F | Brandes Investment Partners, Lp | 654.255 | 3,50 | 78.910 | 5,06 | ||||
| 2026-02-13 | 13F | Colony Group, LLC | 2.265 | 273 | ||||||
| 2026-02-17 | 13F | Captrust Financial Advisors | 654.830 | 1,88 | 78.979 | 3,41 | ||||
| 2026-02-13 | 13F | Walleye Capital LLC | Put | 2.200 | -37,14 | 265 | -36,14 | |||
| 2026-02-03 | 13F | Sumitomo Mitsui DS Asset Management Company, Ltd | 3.939 | 0,00 | 475 | 1,50 | ||||
| 2026-02-13 | 13F | Walleye Capital LLC | 3.099 | 31,65 | 374 | 33,69 | ||||
| 2026-02-13 | 13F | Walleye Capital LLC | Call | 12.700 | 309,68 | 1.532 | 316,03 | |||
| 2026-02-09 | 13F | Knights of Columbus Asset Advisors LLC | 76.170 | 1,32 | 9.187 | 2,84 | ||||
| 2025-11-14 | 13F | Petrus Trust Company, LTA | 0 | -100,00 | 0 | |||||
| 2025-11-14 | 13F | Wolverine Trading, Llc | 11.359 | 233,40 | 1.354 | 267,93 | ||||
| 2025-11-14 | 13F | Wolverine Trading, Llc | Call | 10.700 | -69,25 | 1.276 | -66,08 | |||
| 2026-01-30 | 13F | Torren Management, LLC | 90 | 11 | ||||||
| 2026-02-06 | 13F | HighTower Advisors, LLC | 5.496 | -3,19 | 663 | -1,78 | ||||
| 2025-11-14 | 13F | Wolverine Trading, Llc | Put | 10.000 | 31,58 | 1.192 | 45,19 | |||
| 2026-04-16 | 13F | Toth Financial Advisory Corp | 300 | -31,03 | 34 | -34,62 | ||||
| 2026-01-29 | 13F | Marathon Capital Management | 51.553 | -27,77 | 6.218 | -26,69 | ||||
| 2026-02-03 | 13F | Strengthening Families & Communities, LLC | 15 | 2 | ||||||
| 2026-02-17 | 13F | Northern Trust Corp | 4.864 | -0,27 | 587 | 1,21 | ||||
| 2026-04-17 | 13F | Bell Investment Advisors, Inc | 409 | -7,88 | 46 | -13,21 | ||||
| 2026-04-01 | 13F | Confluence Investment Management Llc | 1.960 | 4,26 | 223 | -1,77 | ||||
| 2026-02-02 | 13F | Cornerstone Planning Group LLC | 55 | 0,00 | 7 | 16,67 | ||||
| 2026-02-09 | 13F | Keating Financial Advisory Services, Inc. | 17 | 2 | ||||||
| 2026-02-12 | 13F | Wishbone Management, LP | 472.500 | 0,00 | 56.988 | 1,51 | ||||
| 2026-04-13 | 13F | Mather Group, Llc. | 18 | 2 | ||||||
| 2026-02-17 | 13F | Jones Financial Companies Lllp | 424 | 16,48 | 51 | 21,43 | ||||
| 2026-02-12 | 13F | Rossby Financial, LCC | 32 | 0,00 | 4 | 0,00 | ||||
| 2026-02-13 | 13F | Thomist Capital Management, LP | 11.660 | 139,18 | 1.410 | 142,51 | ||||
| 2026-02-04 | 13F | Ameritas Advisory Services, LLC | 1.678 | 202 | ||||||
| 2026-04-10 | 13F | Novem Group | 8.413 | 4,28 | 956 | -1,85 | ||||
| 2026-02-05 | 13F | AlphaCore Capital LLC | 2.533 | 306 | ||||||
| 2026-02-12 | 13F | Empirical Finance, LLC | 38.850 | 0,00 | 4.686 | 1,49 | ||||
| 2025-11-19 | 13F | Sunbelt Securities, Inc. | 0 | -100,00 | 0 | -100,00 | ||||
| 2026-02-13 | 13F | Mml Investors Services, Llc | 11.360 | 44,03 | 1.370 | 46,21 | ||||
| 2026-01-21 | 13F | SJS Investment Consulting Inc. | 76 | -52,20 | 9 | -50,00 | ||||
| 2026-02-12 | 13F | Hyperion Capital Advisors LP | 8.400 | 0,00 | 1.013 | 1,50 | ||||
| 2026-02-11 | 13F | Jpmorgan Chase & Co | 1.647.779 | 2,80 | 198.739 | 4,35 | ||||
| 2026-04-14 | 13F | Bay Harbor Wealth Management, LLC | 6 | 100,00 | 1 | |||||
| 2026-02-13 | 13F | Pinnacle Wealth Planning Services, Inc. | 87 | 10 | ||||||
| 2026-02-11 | 13F | Group One Trading, L.p. | Call | 4.000 | 900,00 | 482 | 925,53 | |||
| 2026-02-17 | 13F | Shellback Capital, LP | 50.036 | 0,00 | 6.035 | 1,50 | ||||
| 2026-02-11 | 13F | Group One Trading, L.p. | Put | 600 | -83,78 | 72 | -83,60 | |||
| 2026-04-20 | 13F | Assenagon Asset Management S.A. | 0 | -100,00 | 0 | |||||
| 2026-02-11 | 13F | Group One Trading, L.p. | 45 | -86,15 | 5 | -86,84 | ||||
| 2025-11-13 | 13F | BW Gestao de Investimentos Ltda. | 0 | -100,00 | 0 | -100,00 | ||||
| 2026-02-13 | 13F | Stifel Financial Corp | 7.899 | 55,00 | 954 | 57,52 | ||||
| 2026-02-09 | 13F | Huntington National Bank | 1 | 0,00 | 0 | |||||
| 2026-02-13 | 13F | Walleye Trading LLC | 0 | -100,00 | 0 | -100,00 | ||||
| 2026-02-17 | 13F | Cetera Investment Advisers | 26.843 | 14,73 | 3.238 | 16,48 | ||||
| 2026-02-06 | 13F | Handelsbanken Fonder AB | 7.900 | 0,00 | 1 | |||||
| 2026-02-17 | 13F | Trexquant Investment LP | 28.996 | 3.497 | ||||||
| 2026-01-22 | 13F | Richardson Financial Services Inc. | 537 | 11,88 | 65 | 12,28 | ||||
| 2026-02-13 | 13F | MAI Capital Management | 68 | 277,78 | 8 | 300,00 | ||||
| 2026-02-17 | 13F | Two Sigma Investments, Lp | 284.691 | 24,28 | 34.337 | 26,15 | ||||
| 2026-02-13 | 13F | Aptus Capital Advisors, LLC | 65.822 | 0,43 | 7.939 | 1,94 | ||||
| 2026-01-14 | 13F | Klein Pavlis & Peasley Financial, Inc. | 7.152 | -2,68 | 863 | -1,26 | ||||
| 2026-01-30 | 13F | Us Bancorp \de\ | 269 | 6,32 | 32 | 6,67 | ||||
| 2026-03-03 | 13F/A | Caitong International Asset Management Co., Ltd | 450 | 196,05 | 54 | 200,00 | ||||
| 2025-11-12 | 13F | Victory Capital Management Inc | 0 | -100,00 | 0 | |||||
| 2026-02-10 | 13F | Envestnet Asset Management Inc | 111.655 | 6,67 | 13.467 | 8,27 | ||||
| 2026-02-06 | 13F | Marathon Asset Mgmt Ltd | 409.572 | 9,34 | 49.398 | 10,99 | ||||
| 2026-04-16 | 13F | Everstar Asset Management, LLC | 8.607 | 1,64 | 978 | -4,31 | ||||
| 2026-02-17 | 13F | Voloridge Investment Management, Llc | 0 | -100,00 | 0 | |||||
| 2026-02-13 | 13F | Marshall Wace, Llp | 163.349 | 19.702 | ||||||
| 2026-02-17 | 13F | Mirabella Financial Services Llp | 0 | -100,00 | 0 | |||||
| 2026-02-12 | 13F | Jane Street Group, Llc | 3.477 | 88,76 | 419 | 92,20 | ||||
| 2026-04-22 | 13F | Sterling Capital Management LLC | 1.842 | -36,55 | 209 | -40,29 | ||||
| 2026-02-12 | 13F | Jane Street Group, Llc | Put | 24.100 | -57,72 | 2.907 | -57,09 | |||
| 2026-02-02 | 13F | Core Alternative Capital | 100 | 0,00 | 12 | 9,09 | ||||
| 2026-02-12 | 13F | Jane Street Group, Llc | Call | 15.800 | -69,62 | 1.906 | -69,16 | |||
| 2026-02-13 | 13F | Atlas Capital Advisors Llc | 7.385 | -4,15 | 891 | 5,08 | ||||
| 2026-01-27 | 13F | TD Waterhouse Canada Inc. | 9.321 | 4,55 | 1.124 | 7,25 | ||||
| 2026-02-09 | 13F | Severin Investments, LLC | 4.846 | 187,60 | 585 | 192,00 | ||||
| 2026-02-17 | 13F | Fmr Llc | 1.320.334 | -1,13 | 159.245 | 0,36 | ||||
| 2026-02-17 | 13F | Public Employees Retirement System Of Ohio | 92.907 | 0,00 | 11.206 | 1,50 | ||||
| 2026-02-10 | 13F | Bnp Paribas Arbitrage, Sa | 453 | 26,89 | 55 | 28,57 | ||||
| 2026-01-29 | 13F | IMC-Chicago, LLC | Put | 12.600 | -60,50 | 1.520 | -59,92 | |||
| 2026-04-16 | 13F | SG Americas Securities, LLC | 8.454 | 51,78 | 1 | |||||
| 2026-01-29 | 13F | IMC-Chicago, LLC | Call | 25.800 | 2,79 | 3.112 | 4,33 | |||
| 2026-02-17 | 13F | Silvercrest Asset Management Group Llc | 17.497 | 3,87 | 2.110 | 5,45 | ||||
| 2026-02-10 | 13F | Savant Capital, LLC | 2.988 | 27,09 | 360 | 29,03 | ||||
| 2026-02-13 | 13F | Smartleaf Asset Management LLC | 93 | 11 | ||||||
| 2026-04-07 | 13F | Farther Finance Advisors, LLC | 434 | 48,12 | 51 | 45,71 | ||||
| 2026-02-12 | 13F | Hrt Financial Lp | 67.800 | 8 | ||||||
| 2026-02-09 | 13F | Kestra Investment Management, LLC | 13.392 | -6,90 | 1.615 | -5,50 | ||||
| 2026-02-10 | 13F | Ellevest, Inc. | 4.957 | -13,78 | 598 | -12,59 | ||||
| 2026-01-16 | 13F | Marquette Asset Management, LLC | 0 | -100,00 | 0 | |||||
| 2026-02-13 | 13F | Barclays Plc | 0 | -100,00 | 0 | |||||
| 2026-02-02 | 13F | Oppenheimer & Co Inc | 3.376 | -3,10 | 407 | -1,45 | ||||
| 2026-02-06 | 13F | Pnc Financial Services Group, Inc. | 3.030 | 1,47 | 365 | 3,11 | ||||
| 2026-01-16 | 13F | Standard Life Aberdeen plc | 46.611 | -17,21 | 5.622 | -15,23 | ||||
| 2026-02-02 | 13F | Fifth Third Bancorp | 429 | 0,00 | 52 | 2,00 | ||||
| 2026-02-06 | 13F | Larson Financial Group LLC | 100 | 58,73 | 12 | 71,43 | ||||
| 2026-04-14 | 13F | Seven Mile Advisory | 2.937 | -4,58 | 334 | -10,24 | ||||
| 2026-01-29 | 13F | Concurrent Investment Advisors, LLC | 65.745 | 7.929 | ||||||
| 2026-02-17 | 13F | Mercer Global Advisors Inc /adv | 2.778 | 335 | ||||||
| 2026-02-13 | 13F | Ariel Investments, Llc | 8.752 | 1.056 | ||||||
| 2026-01-21 | 13F | Newbridge Financial Services Group, Inc. | 0 | 0 | ||||||
| 2025-12-09 | 13F/A | Tudor Investment Corp Et Al | Call | 0 | -100,00 | 0 | ||||
| 2026-02-13 | 13F | Dodge & Cox | 3.950 | 0,00 | 476 | 1,49 | ||||
| 2026-02-17 | 13F | Pinnacle Financial Partners, Inc. | 3.367 | 406 | ||||||
| 2026-02-13 | 13F | Citigroup Inc | 6.032 | -15,66 | 728 | -14,37 | ||||
| 2025-11-04 | 13F | Guerra Advisors Inc | 2 | 0 | ||||||
| 2026-02-19 | 13F | CI Private Wealth, LLC | 6.456 | 23,58 | 779 | 25,48 | ||||
| 2026-02-17 | 13F | Two Sigma Advisers, Lp | 120.300 | 9,07 | 14.509 | 10,71 | ||||
| 2026-02-05 | 13F | Leuthold Group, Llc | 3.027 | 0,13 | 365 | 1,67 | ||||
| 2026-02-03 | 13F | Privium Fund Management (UK) Ltd | 7.041 | -12,44 | 849 | -10,16 | ||||
| 2026-02-17 | 13F | PDT Partners, LLC | 14.267 | -26,33 | 1.721 | -25,25 | ||||
| 2026-02-06 | 13F | Global Retirement Partners, LLC | 1.698 | 14,04 | 205 | 15,91 | ||||
| 2026-01-28 | 13F | Geneos Wealth Management Inc. | 33 | 4 | ||||||
| 2026-03-12 | 13F/A | Peak6 Llc | Call | 0 | -100,00 | 0 | -100,00 | |||
| 2026-04-10 | 13F | Marshall Financial Group LLC | 5.936 | 4,21 | 674 | -1,75 | ||||
| 2026-02-12 | 13F | Logan Capital Management Inc | 0 | -100,00 | 0 | |||||
| 2026-02-03 | 13F | Sprucegrove Investment Management Ltd | 1.911.095 | -16,98 | 230.497 | -15,73 | ||||
| 2026-02-12 | 13F | Campbell & CO Investment Adviser LLC | 1.734 | -38,53 | 209 | -37,61 | ||||
| 2026-04-22 | 13F | Spire Wealth Management | 25 | 0,00 | 3 | -33,33 | ||||
| 2026-04-06 | 13F | Versant Capital Management, Inc | 388 | 130,95 | 44 | 120,00 | ||||
| 2026-01-28 | 13F | Retirement Planning Co of New England, Inc. | 1.957 | 0,00 | 236 | 1,72 | ||||
| 2026-03-25 | 13F/A | Lifetime Wealth Management P.C. | 35.775 | 4.315 | ||||||
| 2026-04-08 | 13F | Wealth Enhancement Advisory Services, Llc | 1.966 | 18,43 | 225 | 6,64 | ||||
| 2026-02-12 | 13F | Ruane, Cunniff & Goldfarb L.P. | 2.555 | 0,00 | 308 | 1,65 | ||||
| 2026-02-13 | 13F | Itau Unibanco Holding S.A. | 127.532 | 505,05 | 15.332 | 512,26 | ||||
| 2026-02-10 | 13F/A | Northwestern Mutual Wealth Management Co | 15 | -21,05 | 2 | -50,00 | ||||
| 2026-04-17 | 13F | Vermillion Wealth Management, Inc. | 3 | 0 | ||||||
| 2026-02-11 | 13F | Capital World Investors | 4.603.671 | 0,66 | 555.249 | 2,17 | ||||
| 2026-02-17 | 13F | FIL Ltd | 6.815 | 0,00 | 822 | 1,48 | ||||
| 2026-02-17 | 13F | Par Capital Management Inc | 157.197 | 6,21 | 18.960 | 7,81 | ||||
| 2026-02-04 | 13F | BCJ Capital Management, LLC | 89.192 | 17,09 | 10.757 | 18,85 | ||||
| 2026-01-26 | 13F | Cwm, Llc | 259 | 4,02 | 0 | |||||
| 2026-02-17 | 13F | Hbk Investments L P | Put | 15.100 | -96,77 | 1.821 | -96,72 | |||
| 2026-01-28 | 13F | Ruffer LLP | 48.819 | 32,92 | 5.897 | 35,16 | ||||
| 2026-02-05 | 13F/A | Truxt Investmentos Ltda. | 13.576 | 1.613 | ||||||
| 2026-04-08 | 13F | Miracle Mile Advisors, LLC | 4.279 | -1,41 | 486 | -7,07 | ||||
| 2026-02-17 | 13F | Millennium Management Llc | 117.930 | -73,99 | 14.224 | -73,60 | ||||
| 2026-02-17 | 13F | Royal Bank Of Canada | 15.043 | -59,19 | 1.813 | -58,60 | ||||
| 2026-02-11 | 13F | Empowered Funds, LLC | 243 | 29 | ||||||
| 2026-02-19 | 13F | Invesco Ltd. | 67.810 | -28,24 | 8.179 | -27,16 | ||||
| 2026-02-13 | 13F | Kestra Advisory Services, LLC | 0 | -100,00 | 0 | |||||
| 2026-02-13 | 13F | Pathstone Holdings, LLC | 16.532 | -3,00 | 1.994 | -1,58 | ||||
| 2025-11-06 | 13F | Whipplewood Advisors, LLC | 0 | -100,00 | 0 | -100,00 | ||||
| 2026-04-21 | 13F | Aaron Wealth Advisors LLC | 3.295 | -29,67 | 374 | -33,81 | ||||
| 2026-02-17 | 13F | Tower Research Capital LLC (TRC) | 0 | -100,00 | 0 | |||||
| 2026-04-15 | 13F | Fortitude Family Office, LLC | 49 | 53,12 | 6 | 66,67 | ||||
| 2026-02-17 | 13F | Schonfeld Strategic Advisors LLC | 39.936 | -67,18 | 4.817 | -66,69 | ||||
| 2026-02-17 | 13F | Freestone Grove Partners LP | 0 | -100,00 | 0 | |||||
| 2026-02-17 | 13F | Advisory Services Network, LLC | 0 | -100,00 | 0 | |||||
| 2026-01-22 | 13F | Massachusetts Financial Services Co /ma/ | 13.250 | -24,18 | 1.598 | -23,03 | ||||
| 2026-02-17 | 13F | Point72 Asset Management, L.P. | 0 | -100,00 | 0 | |||||
| 2026-02-04 | 13F | Summit Wealth Group Llc / Co | 0 | -100,00 | 0 | -100,00 | ||||
| 2026-02-05 | 13F | Allworth Financial LP | 5 | 400,00 | 1 | |||||
| 2026-02-17 | 13F | Cape Investment Advisory, Inc. | 614 | 74 | ||||||
| 2026-01-23 | 13F | Altfest L J & Co Inc | 0 | -100,00 | 0 | |||||
| 2026-02-09 | 13F | Optimist Retirement Group LLC | 2.337 | 0,00 | 282 | 1,44 | ||||
| 2026-02-17 | 13F | Amundi | 53.000 | -14,63 | 6.392 | -14,89 | ||||
| 2025-11-17 | 13F | PharVision Advisers, LLC | 0 | -100,00 | 0 | |||||
| 2026-02-12 | 13F | Renaissance Technologies Llc | 772.528 | -12,95 | 93.175 | -11,64 | ||||
| 2026-02-10 | 13F | Semanteon Capital Management, LP | 0 | -100,00 | 0 | |||||
| 2026-02-10 | 13F | Goldman Sachs Group Inc | 266.471 | 9,62 | 32.139 | 11,28 | ||||
| 2026-02-11 | 13F | LPL Financial LLC | 39.779 | 17,62 | 4.798 | 19,39 | ||||
| 2026-02-12 | 13F | Provida Pension Fund Administrator | 0 | -100,00 | 0 | |||||
| 2026-02-13 | 13F | Sei Investments Co | 334.197 | -18,44 | 40.307 | -17,21 | ||||
| 2026-02-12 | 13F | Sagil Capital Llp | 53.854 | 6.495 | ||||||
| 2026-02-13 | 13F | Rhumbline Advisers | 0 | -100,00 | 0 | |||||
| 2026-02-03 | 13F | Ethic Inc. | 47.541 | -0,94 | 5.734 | 0,54 | ||||
| 2026-02-13 | 13F | Public Sector Pension Investment Board | 79.656 | 9.607 | ||||||
| 2026-02-17 | 13F | nVerses Capital, LLC | 2.461 | 297 | ||||||
| 2026-02-10 | 13F | Acadian Asset Management Llc | 0 | -100,00 | 0 | |||||
| 2026-02-12 | 13F | Principal Securities, Inc. | 9.474 | 19,18 | 1.143 | 20,97 | ||||
| 2026-02-17 | 13F | Russell Investments Group, Ltd. | 13.149 | 1,23 | 1.586 | 2,79 | ||||
| 2026-04-21 | 13F | Hosking Partners LLP | 64.878 | -0,86 | 7.371 | -6,61 | ||||
| 2026-02-09 | 13F | Optimize Financial Inc | 2.723 | 1,34 | 328 | 2,82 | ||||
| 2026-02-10 | 13F | Marietta Investment Partners Llc | 7.667 | -1,22 | 925 | 0,22 | ||||
| 2026-01-12 | 13F | CVA Family Office, LLC | 26 | 0,00 | 3 | 0,00 | ||||
| 2026-02-11 | 13F | O'shaughnessy Asset Management, Llc | 3.757 | -14,32 | 453 | -13,05 | ||||
| 2026-04-15 | 13F | Bayforest Capital Ltd | 479 | -77,98 | 54 | -79,39 | ||||
| 2026-04-02 | 13F | Ares Financial Consulting, LLC | 122 | 430,43 | 14 | 600,00 | ||||
| 2026-01-14 | 13F | ORG Partners LLC | 10 | -82,46 | 1 | -83,33 | ||||
| 2025-11-05 | 13F | SPC Financial, Inc. | 1.819 | 0,00 | 216 | 8,00 | ||||
| 2026-01-30 | 13F | Caldwell Securities, Inc | 16 | 0,00 | 2 | 0,00 | ||||
| 2026-02-10 | 13F | Quantbot Technologies LP | 9.703 | 31,23 | 1.170 | 33,26 | ||||
| 2026-02-12 | 13F | Insigneo Advisory Services, Llc | 1.809 | 218 | ||||||
| 2026-02-02 | 13F | CM Management, LLC | 2.500 | -72,22 | 302 | -71,84 | ||||
| 2026-01-23 | 13F | Assetmark, Inc | 184 | 32,37 | 22 | 37,50 | ||||
| 2026-02-17 | 13F | Summit Trail Advisors, Llc | 10.284 | 146,56 | 1.240 | 150,51 | ||||
| 2026-02-06 | 13F | Gsa Capital Partners Llp | 17.397 | -12,07 | 2 | 0,00 | ||||
| 2026-02-10 | 13F | Commonwealth Of Pennsylvania Public School Empls Retrmt Sys | 58.811 | 0,00 | 7.093 | 1,52 | ||||
| 2026-03-13 | 13F/A | Pensionmark Financial Group, Llc | 1.844 | 222 | ||||||
| 2026-02-10 | 13F | Bank of New York Mellon Corp | 2.908 | 9,12 | 351 | 10,76 | ||||
| 2025-11-13 | 13F | Deutsche Bank Ag\ | 0 | -100,00 | 0 | -100,00 | ||||
| 2026-02-12 | 13F | Dimensional Fund Advisors Lp | 1.344.720 | 2,41 | 162.185 | 3,95 | ||||
| 2026-02-05 | 13F | HFM Investment Advisors, LLC | 3 | 0,00 | 0 | |||||
| 2026-02-06 | 13F | Leonteq Securities AG | 110 | -63,46 | 13 | -62,86 | ||||
| 2026-04-13 | 13F | IFP Advisors, Inc | 21 | 0,00 | 2 | 0,00 | ||||
| 2026-02-13 | 13F | Y-Intercept (Hong Kong) Ltd | 8.402 | 1.013 | ||||||
| 2026-02-13 | 13F | Fourth Sail Capital LP | 130.200 | 15.703 | ||||||
| 2026-02-13 | 13F | Morgan Stanley | 270.039 | 2,24 | 32.570 | 3,78 | ||||
| 2026-02-11 | 13F | Janney Montgomery Scott LLC | 82.151 | 3.004,72 | 10 | |||||
| 2026-02-14 | 13F | Rockefeller Capital Management L.P. | 7.052 | 3,95 | 851 | 5,46 | ||||
| 2026-01-29 | 13F | McGowan Group Asset Management, Inc. | 20.209 | 11,41 | 2.437 | 13,09 | ||||
| 2026-02-10 | 13F | Catalyst Capital Advisors LLC | 700 | 0,00 | 84 | 1,20 | ||||
| 2026-04-14 | 13F | Focus Financial Network, Inc. | 2.238 | 2,05 | 254 | -3,79 | ||||
| 2026-02-12 | 13F | BlackRock, Inc. | 10.490 | 38,28 | 1.265 | 40,40 | ||||
| 2026-01-29 | 13F | Deltec Asset Management Llc | 37.900 | -3,81 | 4.571 | -2,35 | ||||
| 2026-02-17 | 13F | Artisan Partners Limited Partnership | 253.729 | 2,75 | 30.602 | 4,30 | ||||
| 2025-10-24 | 13F | Hemington Wealth Management | 60 | 5,26 | 0 | |||||
| 2026-04-20 | 13F | CWA Asset Management Group, LLC | 17.635 | 17,14 | 2.004 | 10,36 | ||||
| 2026-02-10 | 13F | CIBC World Markets Inc. | 57.780 | 9,33 | 6.969 | 10,97 | ||||
| 2026-02-17 | 13F | BTG Pactual Asset Management US LLC | 2.228 | 269 | ||||||
| 2025-11-14 | 13F | Binnacle Investments Inc | 4 | 0 | ||||||
| 2026-02-17 | 13F | Credit Agricole S A | 18.827 | 0,00 | 2.271 | 1,48 | ||||
| 2026-02-13 | 13F | Evelyn Partners Investment Management Services Ltd | 528 | 0,00 | 64 | 1,61 | ||||
| 2026-02-03 | 13F | We Are One Seven, LLC | 3.743 | 3,08 | 451 | 4,64 | ||||
| 2026-02-06 | 13F | Carrhae Capital LLP | 124.717 | 15.042 | ||||||
| 2026-02-12 | 13F | Triumph Capital Management | 475 | 58,33 | 57 | 62,86 | ||||
| 2026-04-20 | 13F | Inscription Capital, LLC | 2.312 | 263 | ||||||
| 2026-04-15 | 13F | Redhawk Wealth Advisors, Inc. | 7.894 | -4,23 | 897 | -9,86 | ||||
| 2026-02-11 | 13F | Parallel Advisors, LLC | 3 | -88,00 | 0 | -100,00 | ||||
| 2026-04-15 | 13F | Paragon Capital Management Ltd | 1.871 | -5,07 | 213 | -10,55 | ||||
| 2026-02-17 | 13F | Wealth Watch Advisors, INC | 7 | 0,00 | 1 | |||||
| 2026-02-17 | 13F | Qube Research & Technologies Ltd | 22.683 | -45,00 | 2.736 | -44,18 | ||||
| 2025-10-31 | 13F | Frazier Financial Advisors, LLC | 0 | -100,00 | 0 | |||||
| 2025-11-13 | 13F | Aristides Capital LLC | 0 | -100,00 | 0 | |||||
| 2025-11-07 | 13F | Atticus Wealth Management, Llc | 0 | -100,00 | 0 | |||||
| 2026-02-13 | 13F | Aigen Investment Management, Lp | 0 | -100,00 | 0 | |||||
| 2025-11-12 | 13F/A | Norges Bank | 2.345 | 0,00 | 220 | -1,35 | ||||
| 2026-02-17 | 13F | Balyasny Asset Management Llc | 258.251 | 428,44 | 31.148 | 436,46 | ||||
| 2026-02-13 | 13F | Walleye Trading LLC | Call | 13.000 | 160,00 | 1.568 | 163,80 | |||
| 2026-02-17 | 13F | Scarborough Advisors, LLC | 95 | 0,00 | 11 | 0,00 | ||||
| 2026-03-06 | 13F | Hsbc Holdings Plc | 41.753 | -22,00 | 5.056 | -20,10 | ||||
| 2026-01-28 | 13F | U S Global Investors Inc | 33.720 | 1,07 | 4.067 | 2,57 | ||||
| 2026-02-13 | 13F | Walleye Trading LLC | Put | 7.000 | 169,23 | 844 | 174,03 | |||
| 2026-02-13 | 13F | Macquarie Group Ltd | 0 | -100,00 | 0 | |||||
| 2026-02-17 | 13F | Lazard Asset Management Llc | 32.492 | -26,80 | 3.919 | -25,70 | ||||
| 2026-02-17 | 13F | MIRAE ASSET GLOBAL ETFS HOLDINGS Ltd. | 120.437 | 1,33 | 14.526 | 2,85 | ||||
| 2026-01-23 | 13F | Burney Co/ | 6.032 | 1,87 | 728 | 3,41 | ||||
| 2026-02-10 | 13F | Root Financial Partners, LLC | 172 | 14,67 | 21 | 17,65 | ||||
| 2026-01-23 | 13F | Baillie Gifford & Co | 2.747.078 | -0,66 | 331.325 | 0,84 | ||||
| 2026-02-11 | 13F | Simplex Trading, Llc | Call | 2.600 | -70,79 | 314 | 31.200,00 | |||
| 2026-02-17 | 13F | Quantinno Capital Management LP | 73.780 | 38,73 | 8.899 | 40,81 | ||||
| 2026-01-15 | 13F | Range Financial Group LLC | 18.154 | 10,71 | 2.190 | 12,37 | ||||
| 2026-02-03 | 13F | McIlrath & Eck, LLC | 1.152 | 97,94 | 139 | 100,00 | ||||
| 2026-02-11 | 13F | Convergence Financial, LLC | 3.966 | 478 | ||||||
| 2026-02-17 | 13F | Private Advisor Group, LLC | 4.708 | 118,16 | 568 | 121,48 | ||||
| 2025-11-05 | 13F | SOUTH STATE Corp | 0 | -100,00 | 0 | |||||
| 2026-02-11 | 13F | Simplex Trading, Llc | Put | 21.100 | 71,54 | 2.545 | 254.300,00 | |||
| 2026-02-17 | 13F | Tudor Investment Corp Et Al | 8.191 | 988 | ||||||
| 2026-02-12 | 13F | CIBC Private Wealth Group, LLC | 134 | 86,11 | 16 | 100,00 | ||||
| 2026-02-12 | 13F | Cloud Capital Management, LLC | 0 | -100,00 | 0 | |||||
| 2026-02-17 | 13F | Aquatic Capital Management LLC | 9.443 | 122,29 | 1.139 | 125,79 | ||||
| 2025-11-12 | 13F | Simplex Trading, Llc | 0 | -100,00 | 0 | |||||
| 2026-04-17 | 13F | IFC & Insurance Marketing, Inc. | 0 | -100,00 | 0 | |||||
| 2026-04-14 | 13F | Zrc Wealth Management, Llc | 49 | 22,50 | 6 | 25,00 | ||||
| 2026-04-20 | 13F | State of Alaska, Department of Revenue | 28.720 | 0,00 | 3 | 0,00 | ||||
| 2026-02-13 | 13F | SPX Equities Gestao de Recursos Ltda | 393.542 | -3,22 | 47.465 | -1,76 | ||||
| 2026-02-11 | 13F | CSM Advisors, LLC | 47.148 | 5,25 | 6 | 0,00 | ||||
| 2026-04-21 | 13F | Quad-Cities Investment Group, LLC | 8.350 | 4,14 | 949 | -1,96 | ||||
| 2026-02-17 | 13F | PenderFund Capital Management Ltd. | 2.048 | 0,00 | 247 | 1,65 | ||||
| 2026-02-11 | 13F | Letko, Brosseau & Associates Inc | 195.203 | 3,97 | 23.543 | 5,54 | ||||
| 2026-02-17 | 13F | Engineers Gate Manager LP | 14.604 | 65,11 | 1.761 | 67,71 | ||||
| 2025-11-07 | 13F | Sierra Ocean, Llc | 0 | -100,00 | 0 | |||||
| 2026-02-13 | 13F | Cullen Capital Management, LLC | 163.557 | -21,89 | 19.727 | -20,72 | ||||
| 2026-02-13 | 13F | Parkside Financial Bank & Trust | 100 | 0,00 | 12 | 9,09 | ||||
| 2026-02-13 | 13F | Vontobel Holding Ltd. | 484.852 | -1,16 | 58.478 | 0,33 | ||||
| 2026-04-07 | 13F | Carolina Wealth Advisors, LLC | 1.929 | 219 | ||||||
| 2026-02-17 | 13F | Signature Equity Partners, LLC | 71 | 9 | ||||||
| 2025-11-07 | 13F | Synovus Financial Corp | 1.736 | 206 | ||||||
| 2026-02-17 | 13F | Bank Of America Corp /de/ | 124.830 | -37,83 | 15.056 | -36,89 | ||||
| 2026-04-17 | 13F | Brown, Lisle/cummings, Inc. | 68 | 8 | ||||||
| 2026-01-27 | 13F | Genoa Capital Gestora de Recursos Ltda. | 0 | -100,00 | 0 | |||||
| 2026-02-13 | 13F | JustInvest LLC | 11.242 | -1,00 | 1.356 | 0,44 | ||||
| 2026-02-12 | 13F | Banco BTG Pactual S.A. | 10.090 | 185,03 | 1.217 | 189,52 | ||||
| 2026-04-13 | 13F | True Wealth Design, LLC | 71 | 102,86 | 8 | 100,00 | ||||
| 2026-01-20 | 13F | Harbor Capital Advisors, Inc. | 9.178 | 23,06 | 1 | |||||
| 2026-02-17 | 13F | Wiley Bros.-aintree Capital, Llc | 4.594 | 555 | ||||||
| 2026-02-12 | 13F | Resurgent Financial Advisors LLC | 2.000 | 241 | ||||||
| 2026-04-07 | 13F | Signaturefd, Llc | 207 | 107,00 | 24 | 91,67 | ||||
| 2026-02-10 | 13F | State of Wyoming | 1.750 | -53,70 | 211 | -53,01 | ||||
| 2026-04-07 | 13F | Eastern Bank | 426 | 0,00 | 48 | -5,88 | ||||
| 2026-02-13 | 13F | Kayne Anderson Rudnick Investment Management Llc | 6 | 0,00 | 1 | |||||
| 2026-02-09 | 13F | Hantz Financial Services, Inc. | 4 | 0 | ||||||
| 2026-02-13 | 13F | Bridgewater Associates, LP | 43.601 | -31,54 | 5.259 | -30,50 | ||||
| 2026-02-13 | 13F | Squarepoint Ops LLC | 4.544 | 75,31 | 548 | 78,50 | ||||
| 2025-11-13 | 13F | Quadrature Capital Ltd | 0 | -100,00 | 0 | |||||
| 2026-02-17 | 13F | Citadel Advisors Llc | Call | 56.600 | -27,06 | 6.827 | -25,97 | |||
| 2026-04-13 | 13F | Artemis Investment Management LLP | 620.198 | 37,29 | 70.461 | 29,32 | ||||
| 2026-01-29 | 13F | UBS Group AG | 67.684 | -13,36 | 8.163 | -12,06 | ||||
| 2026-02-06 | 13F | Bare Financial Services, Inc | 0 | -100,00 | 0 | |||||
| 2026-02-17 | 13F | Citadel Advisors Llc | Put | 65.300 | -26,38 | 7.876 | -25,28 | |||
| 2026-02-17 | 13F | Sig Brokerage, Lp | 0 | -100,00 | 0 | |||||
| 2026-02-17 | 13F | Aqr Capital Management Llc | 2.499 | 302 | ||||||
| 2026-02-17 | 13F | Citadel Advisors Llc | 25.120 | 586,53 | 3.030 | 597,93 | ||||
| 2026-01-30 | 13F | Carrera Capital Advisors | 35.591 | -3,07 | 4.293 | -1,63 | ||||
| 2026-01-23 | 13F | Deprince Race & Zollo Inc | 13.787 | 1.663 | ||||||
| 2026-02-17 | 13F | Susquehanna International Group, Llp | 16.230 | 1.958 | ||||||
| 2026-02-12 | 13F | Steward Partners Investment Advisory, Llc | 1.813 | 0,11 | 219 | 1,40 | ||||
| 2026-02-05 | 13F | Bessemer Group Inc | 128 | 0,00 | 0 | |||||
| 2026-02-17 | 13F | D. E. Shaw & Co., Inc. | Call | 11.800 | 257,58 | 1.423 | 263,01 | |||
| 2026-02-17 | 13F | Susquehanna International Group, Llp | Put | 175.000 | -8,52 | 21.107 | -7,14 | |||
| 2026-02-17 | 13F | Susquehanna International Group, Llp | Call | 38.500 | -51,88 | 4.643 | -51,15 | |||
| 2025-11-14 | 13F | Nomura Holdings Inc | 0 | -100,00 | 0 | |||||
| 2026-02-11 | 13F | Brandywine Global Investment Management, LLC | 137.970 | 1,54 | 16.641 | 3,07 | ||||
| 2026-02-18 | 13F | GWM Advisors LLC | 0 | -100,00 | 0 | |||||
| 2026-03-12 | 13F/A | Peak6 Llc | Put | 19.700 | 2.376 | |||||
| 2026-04-20 | 13F | Jfs Wealth Advisors, Llc | 42 | 7,69 | 5 | 0,00 | ||||
| 2026-01-23 | 13F | Legend Financial Advisors, Inc. | 8.050 | 1,64 | 971 | 3,08 | ||||
| 2026-02-02 | 13F | Hussman Strategic Advisors, Inc. | 10.500 | 1.266 | ||||||
| 2026-02-06 | 13F | EverSource Wealth Advisors, LLC | 1.678 | -0,47 | 202 | 1,00 | ||||
| 2026-02-11 | 13F | Fca Corp /tx | 3.000 | 0,00 | 362 | 1,40 | ||||
| 2026-03-12 | 13F/A | Peak6 Llc | 5.249 | 633 | ||||||
| 2026-02-11 | 13F | Fox Run Management, L.l.c. | 3.478 | -45,16 | 419 | -44,36 | ||||
| 2026-02-17 | 13F/A | Uniplan Investment Counsel, Inc. | 15.062 | -4,47 | 1.817 | -3,04 | ||||
| 2026-02-17 | 13F | Clark Capital Management Group, Inc. | 551.280 | 0,09 | 66.490 | 1,59 | ||||
| 2025-11-14 | 13F | Quarry LP | 0 | -100,00 | 0 | -100,00 | ||||
| 2026-04-20 | 13F | Hilton Head Capital Partners, LLC | 324 | 44,00 | 37 | 33,33 | ||||
| 2026-02-23 | 13F | Virtu Financial LLC | 3.461 | 0 |
Other Listings
| DE:C2H | 105,50 € |