Grundlæggende statistik
| Institutionelle ejere | 154 total, 154 long only, 0 short only, 0 long/short - change of -2,53% MRQ |
| Gennemsnitlig porteføljeallokering | 0.6751 % - change of 0,93% MRQ |
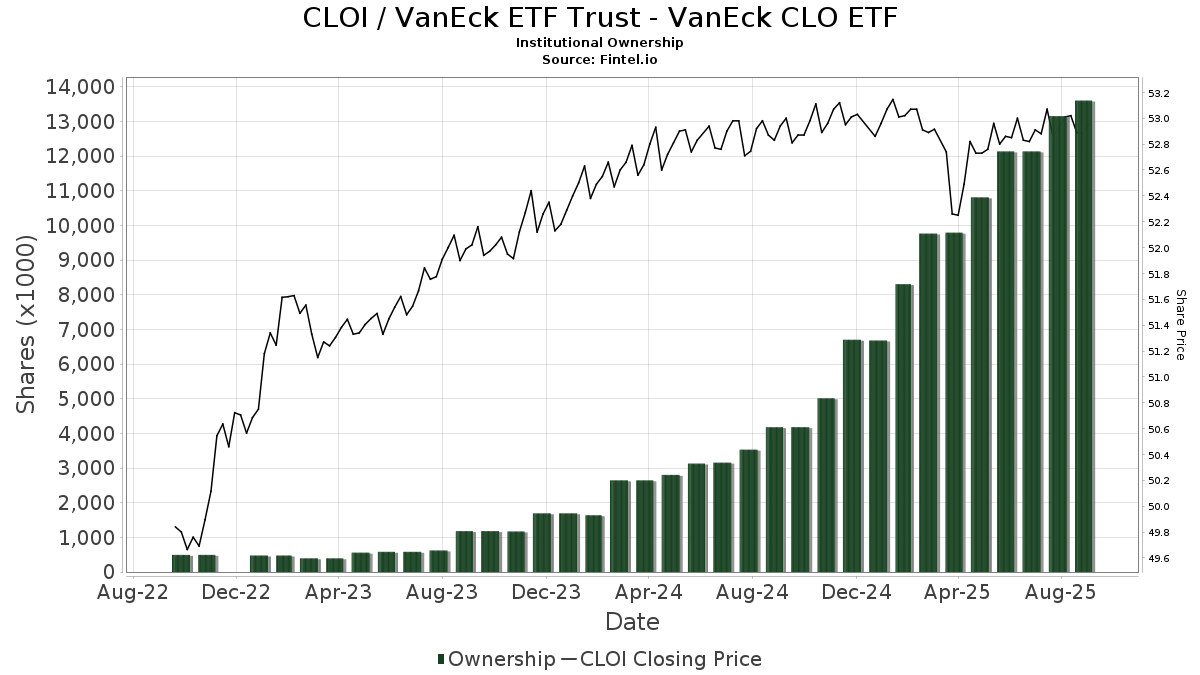
| Institutionelle aktier (lange) | 13.602.279 (ex 13D/G) - change of 1,47MM shares 12,09% MRQ |
| Institutionel værdi (lang) | $ 690.413 USD ($1000) |
Institutionelt ejerskab og aktionærer
VanEck ETF Trust - VanEck CLO ETF (US:CLOI) har 154 institutionelle ejere og aktionærer, der har indsendt 13D/G- eller 13F-formularer til Securities Exchange Commission (SEC). Disse institutioner har i alt 13,602,279 aktier. Største aktionærer omfatter LPL Financial LLC, Capital Investment Advisors, LLC, Independence Asset Advisors, LLC, Syon Capital Llc, Orion Portfolio Solutions, LLC, Brinker Capital Investments, LLC, TRUE Private Wealth Advisors, Ferguson Shapiro LLC, WealthPlan Investment Management, LLC, and HighTower Advisors, LLC .
VanEck ETF Trust - VanEck CLO ETF (ARCA:CLOI) institutionel ejerskabsstruktur viser aktuelle positioner i virksomheden efter institutioner og fonde, samt seneste ændringer i positionsstørrelse. Større aktionærer kan omfatte individuelle investorer, investeringsforeninger, hedgefonde eller institutioner. Skema 13D angiver, at investoren besidder (eller besidder) mere end 5 % af virksomheden og har til hensigt (eller har til hensigt at) aktivt at forfølge en ændring i forretningsstrategi. Skema 13G indikerer en passiv investering på over 5%.
The share price as of September 12, 2025 is 52,95 / share. Previously, on September 16, 2024, the share price was 52,88 / share. This represents an increase of 0,13% over that period.
Fondens stemningsscore
Fund Sentiment Score (fka Ownership Accumulation Score) finder de aktier, der bliver mest købt af fonde. Det er resultatet af en sofistikeret, multi-faktor kvantitativ model, der identificerer virksomheder med de højeste niveauer af institutionel akkumulering. Scoringsmodellen bruger en kombination af den samlede stigning i oplyste ejere, ændringerne i porteføljeallokeringer i disse ejere og andre målinger. Tallet går fra 0 til 100, hvor højere tal indikerer et højere niveau af akkumulering for sine jævnaldrende, og 50 er gennemsnittet.
Opdateringsfrekvens: Dagligt
Se Ownership Explorer, som giver en liste over højest rangerende virksomheder.
Institutionel Put/Call-forhold
Ud over at indberette standardaktie- og gældsudstedelser skal institutter med mere end 100 mill. aktiver under forvaltning også oplyse deres put- og call-optionsbeholdninger. Da salgsoptioner generelt indikerer negativ stemning, og købsoptioner indikerer positiv stemning, kan vi få en fornemmelse af den overordnede institutionelle stemning ved at plotte forholdet mellem put og kald. Diagrammet til højre viser det historiske put/call-forhold for dette instrument.
Brug af Put/Call Ratio som en indikator for investorernes stemning overvinder en af de vigtigste mangler ved at bruge totalt institutionelt ejerskab, som er, at en betydelig mængde af aktiver under forvaltning investeres passivt for at spore indekser. Passivt forvaltede fonde køber typisk ikke optioner, så indikatoren for put/call-forholdet følger mere nøje følelsen af aktivt forvaltede fonde.
13F og NPORT arkivering
Detaljer om 13F-arkivering er gratis. Detaljer om NP-ansøgninger kræver et premium-medlemskab. Grønne rækker angiver nye positioner. Røde rækker angiver lukkede positioner. Klik på linket ikon for at se den fulde transaktionshistorik.
Opgrader
for at låse premium-data op og eksportere til Excel ![]() .
.
| Fil dato | Kilde | Investor | Type | Gennemsnitlig pris (Øst) |
Aktier | Δ Aktier (%) |
Rapporteret Værdi ($1000) |
Δ Værdi (%) |
Port Alloc (%) |
|
|---|---|---|---|---|---|---|---|---|---|---|
| 2025-05-16 | 13F/A | Kestra Investment Management, LLC | 0 | -100,00 | 0 | |||||
| 2025-08-06 | 13F | Financial Advisory Corp /ut/ /adv | 16.913 | 14,38 | 1 | |||||
| 2025-08-08 | 13F | Gts Securities Llc | 9.194 | -71,44 | 487 | -71,43 | ||||
| 2025-08-12 | 13F | Proequities, Inc. | 0 | 0 | ||||||
| 2025-08-15 | 13F | Tower Research Capital LLC (TRC) | 0 | -100,00 | 0 | |||||
| 2025-07-08 | 13F | Goldstone Financial Group, LLC | 4.061 | 215 | ||||||
| 2025-08-13 | 13F | Jones Financial Companies Lllp | 26.230 | 1.475,38 | 1.391 | 1.497,70 | ||||
| 2025-08-07 | 13F | Allworth Financial LP | 2.627 | 0,96 | 139 | 2,21 | ||||
| 2025-05-02 | 13F | Kingsview Wealth Management, LLC | 0 | -100,00 | 0 | |||||
| 2025-08-05 | 13F | Carolinas Wealth Consulting Llc | 0 | -100,00 | 0 | -100,00 | ||||
| 2025-08-13 | 13F | Cresset Asset Management, LLC | 11.695 | 619 | ||||||
| 2025-08-14 | 13F | Harwood Advisory Group, LLC | 246.417 | 48,06 | 13.048 | 48,57 | ||||
| 2025-08-14 | 13F | Jane Street Group, Llc | 33.360 | -65,39 | 1.766 | -65,32 | ||||
| 2025-08-06 | 13F | Stonebridge Financial Planning Group, LLC | 18.626 | 73,14 | 986 | 73,59 | ||||
| 2025-08-14 | 13F | Goldman Sachs Group Inc | 52.487 | 2.779 | ||||||
| 2025-07-28 | 13F | Harbour Investments, Inc. | 5.185 | 0,00 | 275 | 0,37 | ||||
| 2025-08-05 | 13F | K.J. Harrison & Partners Inc | 0 | -100,00 | 0 | |||||
| 2025-05-12 | 13F | Independent Advisor Alliance | 0 | -100,00 | 0 | |||||
| 2025-08-07 | 13F | PCG Wealth Advisors, LLC | 0 | -100,00 | 0 | |||||
| 2025-08-13 | 13F | MONECO Advisors, LLC | 0 | -100,00 | 0 | -100,00 | ||||
| 2025-07-24 | 13F | Lokken Investment Group LLC | 142.469 | 2,81 | 7.544 | 3,02 | ||||
| 2025-08-12 | 13F | Coldstream Capital Management Inc | 0 | -100,00 | 0 | |||||
| 2025-08-14 | 13F | Wiley Bros.-aintree Capital, Llc | 10.572 | 560 | ||||||
| 2025-08-04 | 13F | Arkadios Wealth Advisors | 5.001 | -44,50 | 265 | -44,54 | ||||
| 2025-07-25 | 13F | Atria Wealth Solutions, Inc. | 0 | -100,00 | 0 | |||||
| 2025-07-25 | 13F | Cwm, Llc | 254 | 1,20 | 0 | |||||
| 2025-08-11 | 13F | Western Wealth Management, LLC | 23.956 | 1.268 | ||||||
| 2025-08-06 | 13F | Commonwealth Equity Services, Llc | 11.155 | 1 | ||||||
| 2025-08-12 | 13F | Integras Partners LLC | 81.858 | -42,33 | 4.334 | -42,21 | ||||
| 2025-07-30 | 13F | TFB Advisors LLC | 0 | -100,00 | 0 | |||||
| 2025-08-14 | 13F | Mariner, LLC | 55.077 | 2.916 | ||||||
| 2025-08-14 | 13F | IHT Wealth Management, LLC | 21.634 | -15,54 | 1.146 | -15,37 | ||||
| 2025-05-16 | 13F | Coppell Advisory Solutions LLC | 0 | -100,00 | 0 | |||||
| 2025-07-08 | 13F/A | Salem Investment Counselors Inc | 300 | 0,00 | 16 | 0,00 | ||||
| 2025-08-11 | 13F | TRUE Private Wealth Advisors | 360.791 | 4,06 | 19.104 | 4,27 | ||||
| 2025-08-15 | 13F | Global View Capital Management LLC | 0 | -100,00 | 0 | |||||
| 2025-08-07 | 13F | Proficio Capital Partners LLC | 0 | -100,00 | 0 | |||||
| 2025-08-13 | 13F | Transce3nd, LLC | 822 | -23,11 | 44 | -23,21 | ||||
| 2025-08-14 | 13F | GWM Advisors LLC | 55.364 | 181,42 | 2.932 | 182,10 | ||||
| 2025-07-16 | 13F | Castleview Partners, Llc | 38.841 | -11,26 | 2.057 | -11,07 | ||||
| 2025-07-10 | 13F | CWC Advisors, LLC. | 126.171 | 1,21 | 6.681 | 1,43 | ||||
| 2025-08-04 | 13F | Integrity Alliance, Llc. | 79.564 | -1,69 | 4.213 | -1,50 | ||||
| 2025-08-13 | 13F | Coco Enterprises, LLC | 46.792 | 4,91 | 2.478 | 7,46 | ||||
| 2025-08-14 | 13F | CoreCap Advisors, LLC | 10.551 | -71,00 | 559 | -70,97 | ||||
| 2025-08-12 | 13F | Steward Partners Investment Advisory, Llc | 9.949 | 1.134,37 | 527 | 1.152,38 | ||||
| 2025-08-12 | 13F | Wayfinding Financial, LLC | 54.504 | -37,80 | 3 | -50,00 | ||||
| 2025-07-23 | 13F | Sax Wealth Advisors, Llc | 115.680 | 1.592,71 | 6.125 | 1.596,68 | ||||
| 2025-08-11 | 13F | HighTower Advisors, LLC | 301.713 | 15,58 | 15.976 | 15,82 | ||||
| 2025-05-01 | 13F | Quest 10 Wealth Builders, Inc. | 5.606 | 21,79 | 296 | 22,31 | ||||
| 2025-08-04 | 13F | Atria Investments Llc | 57.835 | -17,88 | 3.062 | -17,71 | ||||
| 2025-07-30 | 13F | LifeWealth Investments, LLC | 5.588 | -6,56 | 296 | -6,35 | ||||
| 2025-08-14 | 13F | Sunbelt Securities, Inc. | 4.618 | 24,24 | 244 | 23,98 | ||||
| 2025-08-01 | 13F | Wealth Watch Advisors, INC | 6.012 | 5,60 | 318 | 6,00 | ||||
| 2025-08-08 | 13F | Avantax Advisory Services, Inc. | 0 | -100,00 | 0 | |||||
| 2025-08-11 | 13F | Summit Wealth Partners, LLC | 8.398 | -8,05 | 445 | -7,88 | ||||
| 2025-08-04 | 13F | Assetmark, Inc | 2.923 | -98,54 | 155 | -98,54 | ||||
| 2025-08-14 | 13F | Quantinno Capital Management LP | 7.561 | 400 | ||||||
| 2025-08-12 | 13F | Allen Capital Group, LLC | 37.321 | 14,99 | 1.976 | 15,29 | ||||
| 2025-08-13 | 13F | PineBridge Investments, L.P. | 271.852 | 14.395 | ||||||
| 2025-07-28 | 13F | Kiker Wealth Management, LLC | 1.407 | 2,18 | 75 | 2,78 | ||||
| 2025-08-01 | 13F | Ferguson Shapiro LLC | 323.062 | 98,19 | 17.106 | 98,61 | ||||
| 2025-08-06 | 13F | AE Wealth Management LLC | 176.198 | -20,96 | 9.330 | -20,80 | ||||
| 2025-07-10 | 13F | Wealth Enhancement Advisory Services, Llc | 154.672 | 8.185 | ||||||
| 2025-07-23 | 13F | WESPAC Advisors, LLC | 6.472 | -89,18 | 343 | -89,17 | ||||
| 2025-07-31 | 13F | Trademark Financial Management, LLC | 82.488 | -7,24 | 4.368 | -7,05 | ||||
| 2025-08-26 | 13F/A | Thrivent Financial For Lutherans | 100.010 | 5 | ||||||
| 2025-08-13 | 13F | Continuum Advisory, LLC | 0 | -100,00 | 0 | |||||
| 2025-07-09 | 13F | Breakwater Capital Group | 34.335 | 1.818 | ||||||
| 2025-04-23 | 13F | SFG Wealth Management, LLC. | 0 | -100,00 | 0 | |||||
| 2025-07-10 | 13F | Financial Management Network Inc | 79.320 | -1,64 | 4.198 | 0,02 | ||||
| 2025-08-01 | 13F | Envestnet Asset Management Inc | 71.200 | -85,33 | 3.760 | -85,34 | ||||
| 2025-08-14 | 13F | Mercer Global Advisors Inc /adv | 25.633 | 0,19 | 1.357 | 0,44 | ||||
| 2025-08-14 | 13F | RMB Capital Management, LLC | 165.842 | 1,96 | 8.781 | 2,18 | ||||
| 2025-07-09 | 13F | VisionPoint Advisory Group, LLC | 24.470 | -1,81 | 1.296 | -1,60 | ||||
| 2025-08-14 | 13F | Mml Investors Services, Llc | 201.040 | -2,53 | 11 | 0,00 | ||||
| 2025-08-06 | 13F | Black Swift Group, LLC | 22.435 | -26,65 | 1.188 | -26,55 | ||||
| 2025-08-14 | 13F | Mpwm Advisory Solutions, Llc | 52.419 | 5,23 | 2.776 | 5,43 | ||||
| 2025-08-27 | 13F/A | Brinker Capital Investments, LLC | 635.803 | -2,03 | 33.666 | -1,83 | ||||
| 2025-07-15 | 13F | Heritage Oak Wealth Advisors Llc | 11.976 | -78,38 | 634 | -78,34 | ||||
| 2025-07-24 | 13F | IFP Advisors, Inc | 10.487 | 9,71 | 555 | 9,90 | ||||
| 2025-07-29 | 13F | Creekside Partners | 3.943 | 209 | ||||||
| 2025-08-14 | 13F | Hilltop Holdings Inc. | 0 | -100,00 | 0 | |||||
| 2025-07-15 | 13F | FLP Wealth Management, LLC | 0 | -100,00 | 0 | |||||
| 2025-07-09 | 13F | Massmutual Trust Co Fsb/adv | 0 | -100,00 | 0 | |||||
| 2025-07-16 | 13F | Beaumont Financial Advisors, LLC | 210.615 | -11,74 | 11.152 | -11,56 | ||||
| 2025-08-14 | 13F | Susquehanna International Group, Llp | 5.517 | 292 | ||||||
| 2025-05-08 | 13F | NorthRock Partners, LLC | 0 | -100,00 | 0 | -100,00 | ||||
| 2025-07-18 | 13F | B.O.S.S. Retirement Advisors, LLC | 18.973 | -26,90 | 1.005 | -26,77 | ||||
| 2025-08-07 | 13F | Ascension Capital Advisors, Inc. | 4.039 | 214 | ||||||
| 2025-08-28 | NP | SSIZX - Sierra Tactical Core Income Fund Class A Shares | 265.100 | 951,98 | 14.037 | 952,25 | ||||
| 2025-07-14 | 13F | IronOak Wealth LLC. | 39.515 | -34,50 | 2.092 | -34,28 | ||||
| 2025-08-14 | 13F | Financial Advisory Service, Inc. | 1.541 | -8,00 | 82 | -7,95 | ||||
| 2025-08-04 | 13F | Deseret Mutual Benefit Administrators | 211.990 | 23,46 | 11.225 | 23,72 | ||||
| 2025-07-29 | 13F | Private Trust Co Na | 1.250 | 66 | ||||||
| 2025-07-25 | 13F | Richardson Financial Services Inc. | 0 | -100,00 | 0 | |||||
| 2025-08-13 | 13F | Trustmark National Bank Trust Department | 14.779 | 3,30 | 783 | 3,58 | ||||
| 2025-08-14 | 13F | Syon Capital Llc | 791.212 | -7,13 | 41.895 | -6,93 | ||||
| 2025-08-15 | 13F | Sugar Maple Asset Management, LLC | 72.685 | 3,46 | 3.849 | 3,66 | ||||
| 2025-08-01 | 13F | Winebrenner Capital Management Llc | 12.138 | 41,80 | 643 | 42,04 | ||||
| 2025-07-22 | 13F | Valley National Advisers Inc | 205 | 0,00 | 0 | |||||
| 2025-07-14 | 13F | Sentinel Pension Advisors Inc | 154.157 | 828,88 | 8.163 | 831,74 | ||||
| 2025-04-30 | 13F | Sofos Investments, Inc. | 14 | 1.300,00 | 1 | |||||
| 2025-07-10 | 13F | Redhawk Wealth Advisors, Inc. | 7.633 | -98,80 | 404 | -98,80 | ||||
| 2025-08-14 | 13F | Clark Capital Management Group, Inc. | 0 | -100,00 | 0 | |||||
| 2025-08-11 | 13F | Portside Wealth Group, LLC | 5.682 | 26,66 | 301 | 26,58 | ||||
| 2025-07-29 | 13F | Independence Asset Advisors, LLC | 1.099.620 | 547,57 | 58.218 | 549,39 | ||||
| 2025-08-12 | 13F | J.w. Cole Advisors, Inc. | 149.481 | 7,31 | 7.915 | 7,54 | ||||
| 2025-08-08 | 13F/A | Sterling Capital Management LLC | 9 | -25,00 | 0 | |||||
| 2025-08-12 | 13F | MAI Capital Management | 10.721 | 48,20 | 568 | 48,43 | ||||
| 2025-07-30 | 13F | Strategic Blueprint, LLC | 0 | -100,00 | 0 | |||||
| 2025-05-20 | 13F/A | Colony Group, LLC | 0 | -100,00 | 0 | |||||
| 2025-08-14 | 13F | Royal Bank Of Canada | 32.227 | 256,26 | 1.706 | 256,90 | ||||
| 2025-07-22 | 13F | Simplicity Wealth,LLC | 0 | -100,00 | 0 | |||||
| 2025-08-05 | 13F | Milestone Asset Management, Llc | 16.872 | -7,18 | 893 | -6,98 | ||||
| 2025-08-11 | 13F | Pineridge Advisors LLC | 134 | -26,37 | 7 | -22,22 | ||||
| 2025-08-13 | 13F | Townsquare Capital Llc | 0 | -100,00 | 0 | |||||
| 2025-08-04 | 13F | Bay Colony Advisory Group, Inc d/b/a Bay Colony Advisors | 0 | -100,00 | 0 | -100,00 | ||||
| 2025-08-04 | 13F | Impact Partnership Wealth, LLC | 12.592 | 667 | ||||||
| 2025-07-29 | 13F | Stratos Wealth Partners, LTD. | 0 | -100,00 | 0 | -100,00 | ||||
| 2025-08-14 | 13F | Hrt Financial Lp | 32.574 | 2 | ||||||
| 2025-08-14 | 13F | Fwl Investment Management, Llc | 216 | 0,00 | 11 | 0,00 | ||||
| 2025-07-17 | 13F | Raleigh Capital Management Inc. | 0 | -100,00 | 0 | |||||
| 2025-07-17 | 13F | Paradigm Financial Partners, Llc | 16.371 | 27,45 | 867 | 27,73 | ||||
| 2025-08-12 | 13F | Park Square Financial Group, LLC | 2.082 | -22,14 | 110 | -21,99 | ||||
| 2025-08-14 | 13F | Van Eck Associates Corp | 452 | 0,00 | 0 | |||||
| 2025-07-16 | 13F | RWM Asset Management, LLC | 0 | -100,00 | 0 | |||||
| 2025-07-29 | 13F | Balboa Wealth Partners | 6.273 | -5,61 | 332 | -5,41 | ||||
| 2025-08-11 | 13F | Perennial Investment Advisors, LLC | 6.455 | -9,05 | 342 | -8,82 | ||||
| 2025-07-21 | 13F | Ameritas Advisory Services, LLC | 3.345 | 177 | ||||||
| 2025-08-12 | 13F | AlphaCore Capital LLC | 11.374 | 20,49 | 602 | 20,88 | ||||
| 2025-08-11 | 13F | Principal Securities, Inc. | 95 | -73,76 | 5 | -73,68 | ||||
| 2025-07-28 | 13F | WealthPLAN Partners, LLC | 166.043 | -13,95 | 8.792 | -13,77 | ||||
| 2025-07-23 | 13F | REAP Financial Group, LLC | 0 | -100,00 | 0 | |||||
| 2025-08-18 | 13F | Geneos Wealth Management Inc. | 153.503 | 28,49 | 8.128 | 28,75 | ||||
| 2025-07-15 | 13F | Sheets Smith Wealth Management | 4.500 | -6,25 | 238 | -5,93 | ||||
| 2025-07-30 | 13F | Eqis Capital Management, Inc. | 4.770 | -71,14 | 253 | -71,13 | ||||
| 2025-08-12 | 13F | Ameritas Investment Partners, Inc. | 90 | 5 | ||||||
| 2025-08-14 | 13F | Warren Averett Asset Management, LLC | 11.893 | 0,21 | 630 | 0,32 | ||||
| 2025-08-14 | 13F | Ancora Advisors, LLC | 65.643 | 6,12 | 3.476 | 6,33 | ||||
| 2025-08-05 | 13F | Optivise Advisory Services LLC | 11.702 | 10,58 | 620 | 10,73 | ||||
| 2025-07-18 | 13F | Bartlett & Co. Wealth Management Llc | 3.775 | 200 | ||||||
| 2025-07-30 | 13F | Brookstone Capital Management | 286.458 | -4,48 | 15.168 | -4,28 | ||||
| 2025-08-12 | 13F | Jpmorgan Chase & Co | 5 | -99,99 | 0 | -100,00 | ||||
| 2025-07-28 | 13F | WealthPlan Investment Management, LLC | 312.471 | 20,98 | 16.545 | 21,23 | ||||
| 2025-07-14 | 13F | Iams Wealth Management, Llc | 11.981 | -7,74 | 634 | -7,58 | ||||
| 2025-08-14 | 13F | Advisor OS, LLC | 38.737 | 33,59 | 2.051 | 33,88 | ||||
| 2025-07-31 | 13F | Cambridge Investment Research Advisors, Inc. | 94.327 | -5,59 | 5 | -20,00 | ||||
| 2025-07-29 | 13F | Mattson Financial Services, LLC | 0 | -100,00 | 0 | |||||
| 2025-05-15 | 13F/A | Orion Portfolio Solutions, LLC | 648.991 | -2,11 | 34.293 | -1,98 | ||||
| 2025-07-16 | 13F | Maridea Wealth Management LLC | 134.247 | 0,33 | 7.108 | 0,54 | ||||
| 2025-08-14 | 13F | Arete Wealth Advisors, LLC | 27.337 | -4,47 | 1 | 0,00 | ||||
| 2025-08-15 | 13F | Kestra Advisory Services, LLC | 4.231 | 36,09 | 224 | 36,59 | ||||
| 2025-05-09 | 13F | GeoWealth Management, LLC | 0 | -100,00 | 0 | |||||
| 2025-08-05 | 13F | BEAM Asset Management, LLC | 0 | -100,00 | 0 | |||||
| 2025-08-14 | 13F | Two Sigma Securities, Llc | 0 | -100,00 | 0 | |||||
| 2025-08-14 | 13F | Visionary Wealth Advisors | 86.777 | 27,40 | 4.595 | 27,65 | ||||
| 2025-07-18 | 13F | Truist Financial Corp | 14.615 | -5,53 | 774 | -5,39 | ||||
| 2025-08-13 | 13F | Northwestern Mutual Wealth Management Co | 0 | -100,00 | 0 | |||||
| 2025-08-11 | 13F | Elequin Capital Lp | 4.084 | 216 | ||||||
| 2025-05-13 | 13F | CacheTech Inc. | 26.280 | 3,52 | 1.389 | 3,66 | ||||
| 2025-08-14 | 13F | Harvest Investment Services, LLC | 178.345 | -4,85 | 9.443 | -4,65 | ||||
| 2025-05-13 | 13F | Adams Wealth Management | 26.280 | 3,52 | 1.389 | 3,66 | ||||
| 2025-07-25 | 13F | Envestnet Portfolio Solutions, Inc. | 0 | -100,00 | 0 | |||||
| 2025-07-24 | 13F | Us Bancorp \de\ | 0 | -100,00 | 0 | |||||
| 2025-07-28 | 13F | Mutual Advisors, LLC | 26.867 | -0,71 | 1.427 | 0,42 | ||||
| 2025-08-12 | 13F | LPL Financial LLC | 1.313.075 | 2,32 | 69.527 | 2,54 | ||||
| 2025-07-14 | 13F | Chris Bulman Inc | 8.852 | -3,93 | 469 | -3,70 | ||||
| 2025-07-08 | 13F | Gradient Investments LLC | 277.737 | 0,77 | 14.706 | 0,99 | ||||
| 2025-08-11 | 13F | Private Advisor Group, LLC | 17.086 | 25,07 | 905 | 25,38 | ||||
| 2025-08-08 | 13F | Financial Gravity Companies, Inc. | 14 | 0,00 | 1 | |||||
| 2025-08-08 | 13F | Crossmark Global Holdings, Inc. | 29.012 | -0,68 | 1.537 | -0,58 | ||||
| 2025-07-14 | 13F | Cathy Pareto & Associates, Inc | 20.916 | 40,14 | 1.108 | 40,48 | ||||
| 2025-08-12 | 13F | CIBC Private Wealth Group, LLC | 0 | -100,00 | 0 | |||||
| 2025-08-11 | 13F | NewEdge Wealth, LLC | 78.881 | 4.170 | ||||||
| 2025-08-05 | 13F | Scarborough Advisors, LLC | 278 | 15 | ||||||
| 2025-08-07 | 13F | Mosaic Financial Group, Llc | 7.062 | 33,27 | 0 | |||||
| 2025-07-17 | 13F/A | Capital Investment Advisors, LLC | 1.286.977 | 14,65 | 68.145 | 14,89 | ||||
| 2025-08-13 | 13F | Flow Traders U.s. Llc | 14.446 | 1 | ||||||
| 2025-04-17 | 13F | Authentikos Wealth Advisory, LLC | 0 | -100,00 | 0 | |||||
| 2025-08-14 | 13F | Comerica Bank | 612 | -17,85 | 32 | -17,95 | ||||
| 2025-08-14 | 13F | UBS Group AG | 0 | -100,00 | 0 | |||||
| 2025-08-11 | 13F | FSA Wealth Management LLC | 1.200 | 0,00 | 64 | 0,00 | ||||
| 2025-09-04 | 13F/A | Advisor Group Holdings, Inc. | 99.291 | 139,58 | 5.252 | 139,93 | ||||
| 2025-04-21 | 13F | PSI Advisors, LLC | 0 | -100,00 | 0 | |||||
| 2025-08-04 | 13F | Spire Wealth Management | 55 | 1,85 | 3 | 0,00 | ||||
| 2025-08-07 | 13F | Kestra Private Wealth Services, Llc | 45.346 | 2.401 | ||||||
| 2025-08-12 | 13F | Global Retirement Partners, LLC | 276 | 1,47 | 15 | 0,00 | ||||
| 2025-07-15 | 13F | Fifth Third Bancorp | 375 | 0,00 | 20 | 0,00 | ||||
| 2025-08-14 | 13F | Kovitz Investment Group Partners, LLC | 97.391 | -0,60 | 5.157 | -0,41 | ||||
| 2025-08-25 | 13F | Fulcrum Equity Management | 0 | -100,00 | 0 | |||||
| 2025-07-25 | 13F | We Are One Seven, LLC | 8.217 | -7,15 | 435 | -6,85 | ||||
| 2025-08-14 | 13F | Citadel Advisors Llc | 28.055 | -61,42 | 1.486 | -61,35 | ||||
| 2025-08-12 | 13F | Richmond Investment Services, LLC | 44.554 | 113,10 | 2.359 | 113,68 | ||||
| 2025-08-05 | 13F | Sigma Planning Corp | 4.398 | -6,86 | 233 | -6,83 | ||||
| 2025-07-08 | 13F | Lowe Wealth Advisors, LLC | 10.411 | 4,43 | 551 | 4,75 | ||||
| 2025-08-15 | 13F/A | Symphony Financial, Ltd. Co. | 12.145 | 642 | ||||||
| 2025-08-15 | 13F | Morgan Stanley | 459 | 129,50 | 24 | 140,00 | ||||
| 2025-08-12 | 13F | TCP Asset Management, LLC | 34.666 | 2,06 | 1.836 | 2,29 | ||||
| 2025-07-15 | 13F | Armis Advisers, LLC | 27.863 | 20,99 | 1.474 | 21,22 |