Grundlæggende statistik
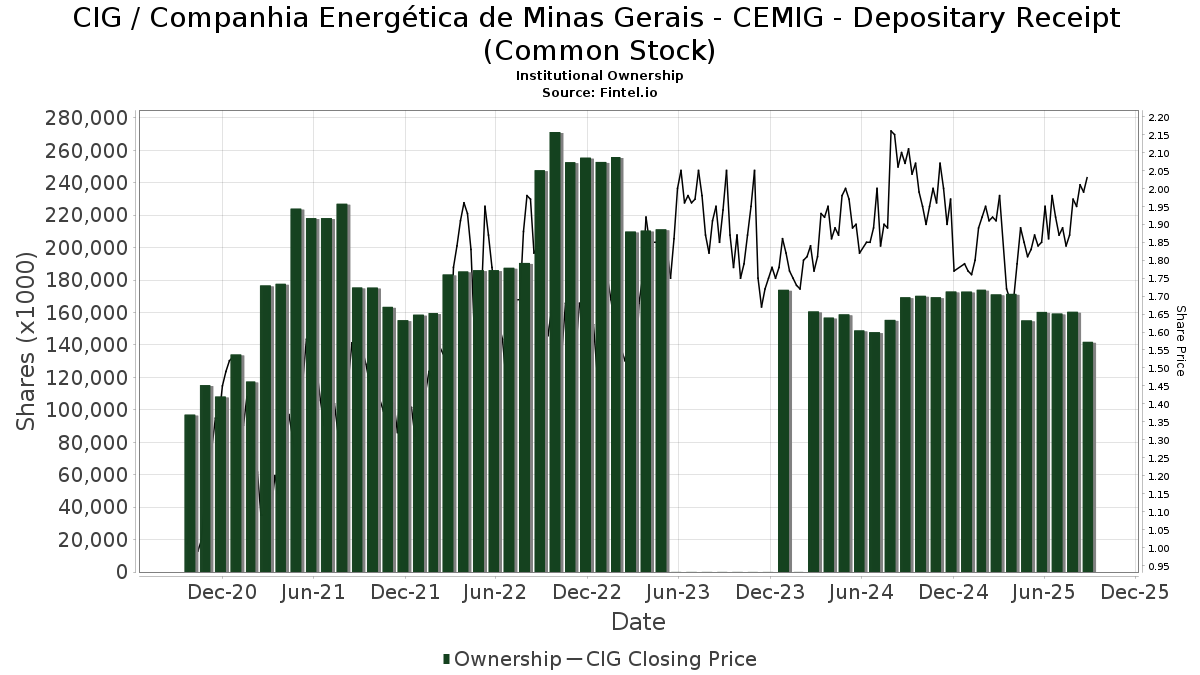
| Institutionelle ejere | 199 total, 198 long only, 0 short only, 1 long/short - change of -12,23% MRQ |
| Gennemsnitlig porteføljeallokering | 0.0635 % - change of -32,53% MRQ |
| Institutionelle aktier (lange) | 130.123.433 (ex 13D/G) - change of -15,96MM shares -10,92% MRQ |
| Institutionel værdi (lang) | $ 261.173 USD ($1000) |
Institutionelt ejerskab og aktionærer
Companhia Energética de Minas Gerais - CEMIG - Depositary Receipt (Common Stock) (US:CIG) har 199 institutionelle ejere og aktionærer, der har indsendt 13D/G- eller 13F-formularer til Securities Exchange Commission (SEC). Disse institutioner har i alt 130,123,433 aktier. Største aktionærer omfatter BlackRock, Inc., Goldman Sachs Group Inc, State Street Corp, Vanguard Group Inc, Renaissance Technologies Llc, VGTSX - Vanguard Total International Stock Index Fund Investor Shares, American Century Companies Inc, VEIEX - Vanguard Emerging Markets Stock Index Fund Investor Shares, Crossmark Global Holdings, Inc., and Morgan Stanley .
Companhia Energética de Minas Gerais - CEMIG - Depositary Receipt (Common Stock) (NYSE:CIG) institutionel ejerskabsstruktur viser aktuelle positioner i virksomheden efter institutioner og fonde, samt seneste ændringer i positionsstørrelse. Større aktionærer kan omfatte individuelle investorer, investeringsforeninger, hedgefonde eller institutioner. Skema 13D angiver, at investoren besidder (eller besidder) mere end 5 % af virksomheden og har til hensigt (eller har til hensigt at) aktivt at forfølge en ændring i forretningsstrategi. Skema 13G indikerer en passiv investering på over 5%.
The share price as of March 19, 2026 is 2,29 / share. Previously, on March 20, 2025, the share price was 1,97 / share. This represents an increase of 16,24% over that period.
Fondens stemningsscore
Fund Sentiment Score (fka Ownership Accumulation Score) finder de aktier, der bliver mest købt af fonde. Det er resultatet af en sofistikeret, multi-faktor kvantitativ model, der identificerer virksomheder med de højeste niveauer af institutionel akkumulering. Scoringsmodellen bruger en kombination af den samlede stigning i oplyste ejere, ændringerne i porteføljeallokeringer i disse ejere og andre målinger. Tallet går fra 0 til 100, hvor højere tal indikerer et højere niveau af akkumulering for sine jævnaldrende, og 50 er gennemsnittet.
Opdateringsfrekvens: Dagligt
Se Ownership Explorer, som giver en liste over højest rangerende virksomheder.
AI+ Ask Fintel’s AI assistant about Companhia Energética de Minas Gerais - CEMIG - Depositary Receipt (Common Stock).
Select a question to share a public post with an AI-crafted answer.
Thinking of good questions…
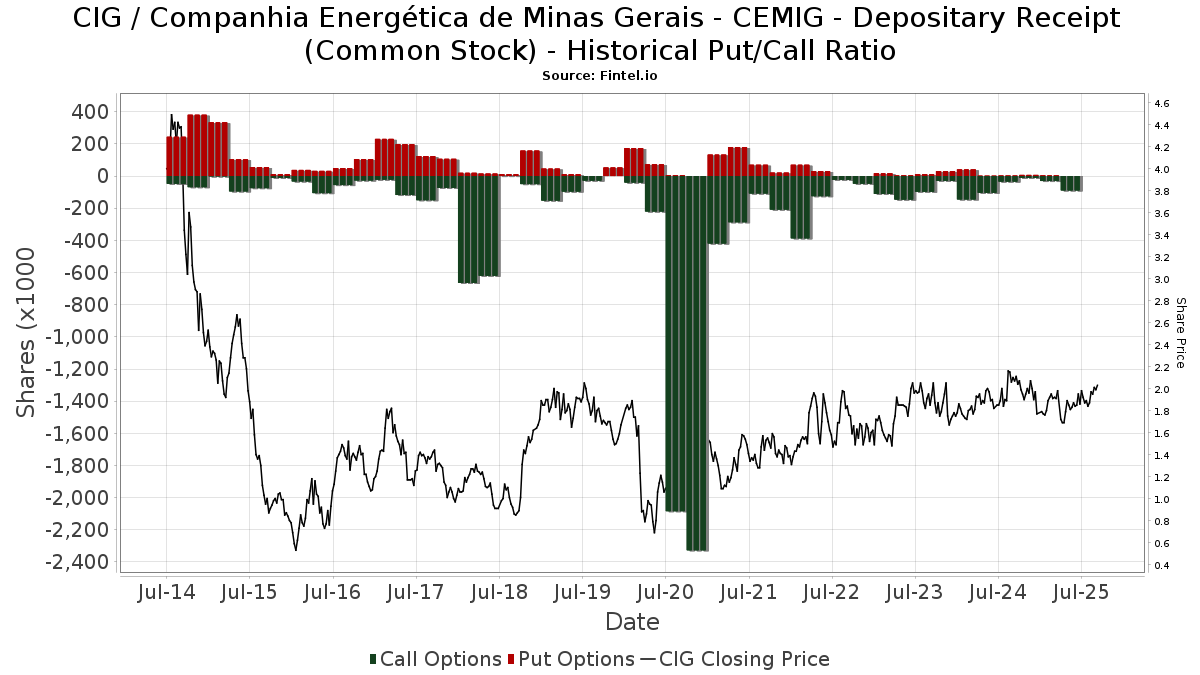
Institutionel Put/Call-forhold
Ud over at indberette standardaktie- og gældsudstedelser skal institutter med mere end 100 mill. aktiver under forvaltning også oplyse deres put- og call-optionsbeholdninger. Da salgsoptioner generelt indikerer negativ stemning, og købsoptioner indikerer positiv stemning, kan vi få en fornemmelse af den overordnede institutionelle stemning ved at plotte forholdet mellem put og kald. Diagrammet til højre viser det historiske put/call-forhold for dette instrument.
Brug af Put/Call Ratio som en indikator for investorernes stemning overvinder en af de vigtigste mangler ved at bruge totalt institutionelt ejerskab, som er, at en betydelig mængde af aktiver under forvaltning investeres passivt for at spore indekser. Passivt forvaltede fonde køber typisk ikke optioner, så indikatoren for put/call-forholdet følger mere nøje følelsen af aktivt forvaltede fonde.
13F og NPORT arkivering
Detaljer om 13F-arkivering er gratis. Detaljer om NP-ansøgninger kræver et premium-medlemskab. Grønne rækker angiver nye positioner. Røde rækker angiver lukkede positioner. Klik på linket ikon for at se den fulde transaktionshistorik.
Opgrader
for at låse premium-data op og eksportere til Excel ![]() .
.
| Fil dato | Kilde | Investor | Type | Gennemsnitlig pris (Øst) |
Aktier | Δ Aktier (%) |
Rapporteret Værdi ($1000) |
Δ Værdi (%) |
Port Alloc (%) |
|
|---|---|---|---|---|---|---|---|---|---|---|
| 2026-02-13 | 13F/A | Virtus ETF Advisers LLC | 0 | -100,00 | 0 | |||||
| 2025-09-25 | NP | DFSE - Dimensional Emerging Markets Sustainability Core 1 ETF | 33.910 | 0,00 | 61 | -4,69 | ||||
| 2026-02-13 | 13F | Marshall Wace, Llp | 0 | -100,00 | 0 | |||||
| 2026-01-05 | 13F | GAMMA Investing LLC | 16.454 | 14,40 | 33 | 6,67 | ||||
| 2026-02-06 | 13F | EverSource Wealth Advisors, LLC | 25.894 | 14,74 | 52 | 8,51 | ||||
| 2026-02-17 | 13F | Royal Bank Of Canada | 246.115 | -2,81 | 493 | -7,85 | ||||
| 2026-02-04 | 13F | Pure Financial Advisors, Inc. | 66.185 | 0,00 | 132 | -5,04 | ||||
| 2026-02-02 | 13F | Qrg Capital Management, Inc. | 137.806 | -9,02 | 276 | -13,79 | ||||
| 2026-02-12 | 13F | Skopos Labs, Inc. | 0 | -100,00 | 0 | |||||
| 2026-02-13 | 13F | Mariner, LLC | 137.778 | -14,96 | 276 | -19,35 | ||||
| 2026-02-13 | 13F | Inspire Advisors, LLC | 15.716 | 55,84 | 31 | 47,62 | ||||
| 2025-09-25 | NP | TWAAX - Thrivent International Allocation Fund Class A | 0 | -100,00 | 0 | -100,00 | ||||
| 2025-09-26 | NP | UBPIX - Ultralatin America Profund Investor Class | 43.139 | 14,07 | 78 | 9,86 | ||||
| 2026-01-23 | 13F | Robeco Institutional Asset Management B.V. | 2.773.413 | 0,00 | 5.547 | -5,21 | ||||
| 2026-02-13 | 13F | State Street Corp | 14.278.481 | 4,23 | 31.827 | 3,73 | ||||
| 2026-02-24 | 13F | DGS Capital Management, LLC | 47.327 | -11,40 | 95 | -16,07 | ||||
| 2026-02-12 | 13F | Investment Research Partners LLC | 36.371 | 4,59 | 73 | 1,41 | ||||
| 2025-11-14 | 13F | Cubist Systematic Strategies, LLC | 58.950 | 124 | ||||||
| 2026-02-03 | 13F | Ethic Inc. | 79.105 | 46,20 | 158 | 38,60 | ||||
| 2026-02-11 | 13F | Simplex Trading, Llc | Call | 0 | -100,00 | 0 | ||||
| 2026-02-17 | 13F | Aqr Capital Management Llc | 834.215 | -25,77 | 1.668 | -29,65 | ||||
| 2026-01-20 | 13F | Signaturefd, Llc | 178.505 | -1,48 | 357 | -6,54 | ||||
| 2026-02-17 | 13F | Northern Trust Corp | 1.700.200 | -11,43 | 3.400 | -16,05 | ||||
| 2026-02-13 | 13F | PCM Encore, LLC | 50.335 | 101 | ||||||
| 2026-01-08 | 13F | True Wealth Design, LLC | 4 | 0,00 | 0 | |||||
| 2026-02-13 | 13F | JustInvest LLC | 38.263 | 4,38 | 77 | -1,30 | ||||
| 2026-02-13 | 13F | Flow Traders U.s. Llc | 32.940 | 0 | ||||||
| 2026-01-21 | 13F | Yousif Capital Management, Llc | 23.272 | 0,00 | 47 | -4,08 | ||||
| 2025-09-25 | NP | VEIEX - Vanguard Emerging Markets Stock Index Fund Investor Shares | 4.339.107 | 0,00 | 7.854 | -4,23 | ||||
| 2026-02-13 | 13F | Ubs Asset Management Americas Inc | 5.290 | 11 | ||||||
| 2026-02-13 | 13F | Squarepoint Ops LLC | 10.462 | -89,18 | 21 | -90,20 | ||||
| 2026-02-04 | 13F | Argos Wealth Advisors, LLC | 18.935 | 38 | ||||||
| 2026-02-12 | 13F | Quadrant Capital Group Llc | 299.997 | -0,16 | 600 | -5,36 | ||||
| 2025-11-10 | 13F | Optiver Holding B.V. | 0 | -100,00 | 0 | |||||
| 2025-09-24 | NP | SGIDX - Steward Global Equity Income Fund Class A | 3.997 | -3,43 | ||||||
| 2025-09-23 | NP | GERIX - Goldman Sachs Emerging Markets Equity Insights Fund Institutional | 118.300 | -12,69 | 214 | -16,41 | ||||
| 2026-01-15 | 13F | Allspring Global Investments Holdings, LLC | 10.793 | 22 | ||||||
| 2026-02-17 | 13F | Virtus Investment Advisers, Inc. | 82.538 | -1,04 | 165 | -5,71 | ||||
| 2026-02-17 | 13F | SageView Advisory Group, LLC | 854 | 2 | ||||||
| 2026-02-12 | 13F | Federation des caisses Desjardins du Quebec | 2.347 | 0,00 | 5 | 0,00 | ||||
| 2026-01-16 | 13F | Perigon Wealth Management, LLC | 159.131 | 318 | ||||||
| 2026-02-17 | 13F | Jones Financial Companies Lllp | 774 | -25,93 | 2 | -50,00 | ||||
| 2026-02-02 | 13F | Principal Financial Group Inc | 207.165 | 8,98 | 414 | 3,24 | ||||
| 2026-02-06 | 13F | Pzena Investment Management Llc | 1.080.784 | -46,29 | 2.162 | -49,09 | ||||
| 2026-02-19 | 13F | Invesco Ltd. | 290.829 | -21,16 | 582 | -25,32 | ||||
| 2026-02-03 | 13F/A | Mount Yale Investment Advisors, LLC | 0 | -100,00 | 0 | |||||
| 2026-01-27 | 13F | PFG Advisors | 18.392 | 0,00 | 37 | -5,26 | ||||
| 2026-02-17 | 13F | Quadrature Capital Ltd | 0 | -100,00 | 0 | |||||
| 2026-02-06 | 13F | Profund Advisors Llc | 49.768 | 31,69 | 100 | 25,32 | ||||
| 2026-02-13 | 13F | Caitong International Asset Management Co., Ltd | 22.505 | 4.114,42 | 45 | 4.400,00 | ||||
| 2025-09-25 | NP | VEU - Vanguard FTSE All-World ex-US Index Fund ETF Shares | 980.613 | 0,00 | 1.775 | -4,26 | ||||
| 2026-02-17 | 13F | Public Employees Retirement System Of Ohio | 379.734 | 0,00 | 759 | -5,24 | ||||
| 2026-02-06 | 13F | Banque Cantonale Vaudoise | 222.296 | 5,54 | 445 | |||||
| 2026-01-26 | 13F | Mirae Asset Global Investments Co., Ltd. | 103.450 | 2,31 | 207 | -3,29 | ||||
| 2026-02-18 | 13F | Vident Advisory, LLC | 510.489 | 0,48 | 1.021 | -4,76 | ||||
| 2026-01-07 | 13F | Hilltop National Bank | 8.000 | 0,00 | 16 | 0,00 | ||||
| 2026-02-13 | 13F | National Bank Of Canada /fi/ | 18.864 | -30,19 | 38 | -33,93 | ||||
| 2026-02-02 | 13F | Truist Financial Corp | 26.041 | -5,12 | 52 | -8,77 | ||||
| 2026-02-10 | 13F | Connor, Clark & Lunn Investment Management Ltd. | 2.248.460 | 0,09 | 4.497 | -5,13 | ||||
| 2025-09-25 | NP | DEXC - Dimensional Emerging Markets ex China Core Equity ETF | 33.600 | 0,00 | 61 | -4,76 | ||||
| 2026-02-11 | 13F | Metis Global Partners, LLC | 137.662 | 0,00 | 275 | -5,17 | ||||
| 2026-02-12 | 13F | Banco BTG Pactual S.A. | 0 | -100,00 | 0 | |||||
| 2026-01-30 | 13F | Simplicity Wealth,LLC | 10.918 | 22 | ||||||
| 2025-09-25 | NP | DFEM - Dimensional Emerging Markets Core Equity 2 ETF | 116.130 | 0,00 | 210 | -4,11 | ||||
| 2026-01-29 | 13F | Vanguard Group Inc | 13.098.258 | 0,00 | 26.197 | -5,21 | ||||
| 2026-02-12 | 13F | Raiffeisen Bank International AG | 85.266 | -13,62 | 174 | -16,83 | ||||
| 2026-02-17 | 13F | Bank Of America Corp /de/ | 1.981.673 | 236,87 | 3.963 | 219,34 | ||||
| 2025-09-25 | NP | VGTSX - Vanguard Total International Stock Index Fund Investor Shares | 5.197.706 | 0,00 | 9.408 | -4,23 | ||||
| 2026-02-11 | 13F | Franklin Resources Inc | 272.751 | 5,33 | 546 | -0,18 | ||||
| 2026-01-26 | 13F | Harbor Asset Planning, Inc. | 8.036 | 0,00 | 16 | 0,00 | ||||
| 2026-02-06 | 13F | Global Retirement Partners, LLC | 88.685 | 65.592,59 | 177 | |||||
| 2026-02-10 | 13F | Welch & Forbes Llc | 0 | -100,00 | 0 | |||||
| 2025-09-25 | NP | DFA INVESTMENT DIMENSIONS GROUP INC - Emerging Markets Sustainability Core 1 Portfolio Institutional Class This fund is a listed as child fund of Dimensional Fund Advisors Lp and if that institution has disclosed ownership in this security, then these positions will not be double counted when calculating total shares and total value | 11.963 | 0,00 | 22 | -4,55 | ||||
| 2026-01-30 | 13F | Valued Wealth Advisors LLC | 1.329 | 0,00 | 3 | 0,00 | ||||
| 2026-02-06 | 13F | HighTower Advisors, LLC | 135.858 | -3,43 | 272 | -8,45 | ||||
| 2026-02-24 | 13F | Bell Investment Advisors, Inc | 1.020 | 0,00 | 2 | 0,00 | ||||
| 2026-02-13 | 13F | Rhumbline Advisers | 33.589 | 0,67 | 67 | -4,29 | ||||
| 2026-02-13 | 13F | First Trust Advisors Lp | 11.988 | -36,40 | 24 | -41,03 | ||||
| 2025-10-08 | 13F/A | New York State Common Retirement Fund | 0 | -100,00 | 0 | -100,00 | ||||
| 2026-02-12 | 13F | Hrt Financial Lp | 0 | -100,00 | 0 | |||||
| 2026-02-11 | 13F | IMA Wealth, Inc. | 383 | 1 | ||||||
| 2026-02-13 | 13F | Mml Investors Services, Llc | 32.095 | -4,39 | 64 | -8,57 | ||||
| 2026-02-17 | 13F | Two Sigma Securities, Llc | 34.793 | 203,60 | 70 | 187,50 | ||||
| 2026-02-12 | 13F | Qtron Investments LLC | 0 | -100,00 | 0 | |||||
| 2026-02-09 | 13F | Legal & General Group Plc | 1.421.852 | 0,00 | 2.851 | -4,30 | ||||
| 2026-01-21 | 13F | Prime Capital Investment Advisors, LLC | 57.741 | -1,00 | 115 | -6,50 | ||||
| 2026-02-13 | 13F | Sei Investments Co | 207.021 | -14,50 | 414 | -18,82 | ||||
| 2026-01-20 | 13F | AdvisorNet Financial, Inc | 2.413 | 0,00 | 5 | -20,00 | ||||
| 2026-02-17 | 13F | Grantham, Mayo, Van Otterloo & Co. LLC | 717.492 | 0,00 | 1.435 | -5,22 | ||||
| 2026-02-17 | 13F | Mercer Global Advisors Inc /adv | 47.409 | -11,07 | 95 | -16,07 | ||||
| 2026-02-18 | 13F | Mackenzie Financial Corp | 424.174 | -18,32 | 864 | -21,19 | ||||
| 2026-01-16 | 13F | Ronald Blue Trust, Inc. | 73.752 | -16,26 | 148 | -20,54 | ||||
| 2025-11-12 | 13F | Simplex Trading, Llc | 0 | -100,00 | 0 | |||||
| 2026-02-13 | 13F | MAI Capital Management | 1.540 | 0,00 | 3 | 0,00 | ||||
| 2026-02-10 | 13F | Acadian Asset Management Llc | 0 | -100,00 | 0 | |||||
| 2025-11-12 | 13F | Barclays Plc | 0 | -100,00 | 0 | |||||
| 2026-01-29 | 13F | UBS Group AG | 203.395 | -85,33 | 407 | -86,12 | ||||
| 2026-02-03 | 13F | Sequoia Financial Advisors, LLC | 56.668 | 0,68 | 113 | -4,24 | ||||
| 2026-02-13 | 13F | Arrowstreet Capital, Limited Partnership | 825.893 | -41,62 | 1.652 | -44,69 | ||||
| 2026-01-26 | 13F | Abundance Wealth Counselors | 68.157 | 9,96 | 136 | 4,62 | ||||
| 2025-09-29 | NP | VRAI - Virtus Real Asset Income ETF | 89.354 | 5,60 | 162 | 1,26 | ||||
| 2025-10-27 | 13F | First Horizon Corp | 0 | -100,00 | 0 | |||||
| 2026-02-17 | 13F | Ameriprise Financial Inc | 27.767 | 0,00 | 56 | -5,17 | ||||
| 2026-02-19 | 13F | Atomi Financial Group, Inc. | 57.919 | 47,25 | 116 | 40,24 | ||||
| 2026-01-21 | 13F | TSP Capital Management Group, LLC | 18.106 | -5,99 | ||||||
| 2026-02-13 | 13F | Pinnacle Wealth Planning Services, Inc. | 25.539 | 0,00 | 51 | -3,77 | ||||
| 2026-02-17 | 13F | Cetera Investment Advisers | 10.758 | 22 | ||||||
| 2026-01-23 | 13F | Eagle Bay Advisors LLC | 16.000 | 32 | ||||||
| 2026-01-26 | 13F | Invested Advisors | 25.517 | 33,63 | 51 | 50,00 | ||||
| 2026-02-17 | 13F | Laird Norton Trust Company, Llc | 232.255 | 498 | ||||||
| 2026-02-11 | 13F | Parallel Advisors, LLC | 9.245 | 0,00 | 18 | -5,26 | ||||
| 2026-02-03 | 13F | SBI Securities Co., Ltd. | 33.493 | 75,13 | 67 | 65,00 | ||||
| 2026-02-13 | 13F | Wells Fargo & Company/mn | 4.752 | 44,26 | 10 | 50,00 | ||||
| 2026-02-13 | 13F | American Century Companies Inc | 5.139.632 | 14,52 | 10.279 | 8,55 | ||||
| 2026-01-26 | 13F | Cwm, Llc | 2.407 | -42,44 | 0 | |||||
| 2026-02-11 | 13F | Cerity Partners LLC | 48.288 | -3,55 | 97 | -8,57 | ||||
| 2026-02-02 | 13F | Ativo Capital Management LLC | 586.421 | -5,19 | 1.173 | -10,19 | ||||
| 2025-11-04 | 13F | Gitterman Wealth Management, LLC | 161.340 | 9,22 | 340 | 17,65 | ||||
| 2026-02-17 | 13F | Two Sigma Investments, Lp | 745.999 | -27,35 | 1.492 | -31,16 | ||||
| 2025-11-12 | 13F | LPL Financial LLC | 0 | -100,00 | 0 | -100,00 | ||||
| 2026-02-13 | 13F | Dodge & Cox | 15.000 | 0,00 | 30 | -3,23 | ||||
| 2026-02-12 | 13F | Principal Securities, Inc. | 0 | -100,00 | 0 | -100,00 | ||||
| 2026-02-17 | 13F | Evergreen Wealth Solutions, LLC | 30.176 | 21,69 | 60 | 15,38 | ||||
| 2026-02-06 | 13F | Pnc Financial Services Group, Inc. | 46.638 | 2,66 | 93 | -2,11 | ||||
| 2026-02-17 | 13F | Citadel Advisors Llc | Put | 10.000 | 20 | |||||
| 2026-02-17 | 13F | Two Sigma Advisers, Lp | 139.990 | -7,62 | 280 | -12,54 | ||||
| 2026-02-17 | 13F | Citadel Advisors Llc | 249.422 | -78,17 | 499 | -79,34 | ||||
| 2026-01-30 | 13F | Precision Wealth Strategies, LLC | 63.668 | -19,18 | 127 | -23,49 | ||||
| 2026-02-17 | 13F | Engineers Gate Manager LP | 0 | -100,00 | 0 | |||||
| 2026-02-10 | 13F | Greenspring Advisors, LLC | 14.832 | 30 | ||||||
| 2026-02-17 | 13F | DZ BANK AG Deutsche Zentral Genossenschafts Bank, Frankfurt am Main | 587.500 | 1.175 | ||||||
| 2026-01-05 | 13F | Park Avenue Securities Llc | 0 | -100,00 | 0 | |||||
| 2025-09-25 | NP | DFA INVESTMENT DIMENSIONS GROUP INC - World ex U.S. Core Equity Portfolio Institutional Class Shares | 12.652 | 0,00 | 23 | -4,35 | ||||
| 2026-02-19 | 13F | CI Private Wealth, LLC | 594.303 | 0,81 | 1.190 | -4,34 | ||||
| 2025-09-25 | NP | DFAE - Dimensional Emerging Core Equity Market ETF | 418.570 | 0,00 | 758 | -4,30 | ||||
| 2026-01-13 | 13F | Stableford Capital Ii Llc | 38.225 | 0,00 | 76 | -5,00 | ||||
| 2026-01-23 | 13F | Farther Finance Advisors, LLC | 348.457 | 1,48 | 697 | -3,87 | ||||
| 2026-02-13 | 13F | Candriam Luxembourg S.C.A. | 47.797 | 91,36 | 96 | 82,69 | ||||
| 2026-02-10 | 13F | Envestnet Asset Management Inc | 116.091 | -95,10 | 232 | -95,36 | ||||
| 2026-02-11 | 13F | SmartHarvest Portfolios, LLC | 14.952 | 30 | ||||||
| 2026-02-13 | 13F | Manufacturers Life Insurance Company, The | 0 | -100,00 | 0 | |||||
| 2026-02-12 | 13F | Brown Brothers Harriman & Co | 1.871 | 107,43 | 4 | 200,00 | ||||
| 2026-02-17 | 13F | D. E. Shaw & Co., Inc. | 204.419 | -43,93 | 409 | -46,94 | ||||
| 2026-02-11 | 13F | Jpmorgan Chase & Co | 17.727 | -94,14 | 35 | -94,51 | ||||
| 2026-02-17 | 13F | Susquehanna International Group, Llp | Call | 54.500 | 74,68 | 109 | 67,69 | |||
| 2026-02-17 | 13F | Tower Research Capital LLC (TRC) | 16.621 | 534,63 | 33 | 560,00 | ||||
| 2026-01-16 | 13F | Vanguard Capital Wealth Advisors This fund is a listed as child fund of Vanguard Group Inc and if that institution has disclosed ownership in this security, then these positions will not be double counted when calculating total shares and total value | 50.300 | 42,49 | 101 | 35,14 | ||||
| 2026-02-12 | 13F | Canopy Partners, LLC | 0 | -100,00 | 0 | |||||
| 2026-02-17 | 13F | Guggenheim Capital Llc | 629.791 | 3,58 | 1.260 | -1,79 | ||||
| 2026-02-17 | 13F | Fmr Llc | 30.800 | -0,72 | 62 | -6,15 | ||||
| 2026-01-08 | 13F | Traveka Wealth, LLC | 12.725 | 0,00 | 25 | -3,85 | ||||
| 2025-11-12 | 13F | Steward Partners Investment Advisory, Llc | 0 | -100,00 | 0 | |||||
| 2026-02-17 | 13F | Susquehanna International Group, Llp | 137.983 | 227,74 | 276 | 212,50 | ||||
| 2026-02-13 | 13F | Itau Unibanco Holding S.A. | 0 | -100,00 | 0 | |||||
| 2026-02-10 | 13F | Bnp Paribas Arbitrage, Sa | 41.034 | 0,00 | 82 | -4,65 | ||||
| 2026-02-17 | 13F | Mangrove Partners | 2.625.000 | -42,93 | 5.250 | -45,91 | ||||
| 2026-02-11 | 13F | Group One Trading, L.p. | Call | 4.700 | -77,40 | 9 | -79,07 | |||
| 2026-02-11 | 13F | Group One Trading, L.p. | 2.802 | -63,98 | 6 | -68,75 | ||||
| 2026-02-11 | 13F | Longfellow Investment Management Co Llc | 463.490 | -13,28 | 927 | -17,83 | ||||
| 2026-03-04 | 13F | Rehmann Capital Advisory Group | 0 | -100,00 | 0 | |||||
| 2026-02-13 | 13F | Pathstone Holdings, LLC | 83.589 | 1,87 | 167 | -3,47 | ||||
| 2026-02-05 | 13F | Abacus Wealth Partners, LLC | 10.113 | 20 | ||||||
| 2026-02-23 | 13F | Leonteq Securities AG | 0 | -100,00 | 0 | |||||
| 2026-02-04 | 13F | Blackhawk Capital Partners LLC. | 24.337 | 0,00 | 49 | -5,88 | ||||
| 2026-02-03 | 13F | Crossmark Global Holdings, Inc. | 4.061.011 | 1,59 | 8.122 | -3,70 | ||||
| 2026-02-17 | 13F | CWM Advisors, LLC | 4.423 | 9 | ||||||
| 2026-02-10 | 13F/A | Northwestern Mutual Wealth Management Co | 9.132 | 0,00 | 18 | -5,26 | ||||
| 2026-02-17 | 13F | Amundi | 1.058.866 | 0,00 | 2.118 | -0,52 | ||||
| 2026-02-13 | 13F | Van Eck Associates Corp | 357.747 | -4,21 | 1 | |||||
| 2025-11-14 | 13F | Raymond James Financial Inc | 0 | -100,00 | 0 | |||||
| 2025-09-26 | NP | RTXAX - Tax-Managed Real Assets Fund Class A | 225.906 | 0,00 | 409 | -4,23 | ||||
| 2026-02-12 | 13F | Advisors Asset Management, Inc. | 652.018 | 4,64 | 1.304 | -0,76 | ||||
| 2026-02-17 | 13F | XTX Topco Ltd | 259.105 | 34,07 | 518 | 27,27 | ||||
| 2025-11-14 | 13F | Eqis Capital Management, Inc. | 0 | -100,00 | 0 | |||||
| 2026-02-12 | 13F | Dimensional Fund Advisors Lp | 1.078.963 | 4,77 | 2.158 | -0,69 | ||||
| 2026-02-13 | 13F | Stifel Financial Corp | 775.601 | 11,21 | 1.551 | 5,44 | ||||
| 2025-11-06 | 13F | Wealthstream Advisors, Inc. | 15.247 | 25,77 | 32 | 39,13 | ||||
| 2026-01-28 | 13F | Geneos Wealth Management Inc. | 15.344 | 0,00 | 31 | -6,25 | ||||
| 2025-09-29 | NP | CVY - Invesco Zacks Multi-Asset Income ETF This fund is a listed as child fund of Invesco Ltd. and if that institution has disclosed ownership in this security, then these positions will not be double counted when calculating total shares and total value | 574.528 | -7,74 | 1.040 | -11,65 | ||||
| 2026-01-14 | 13F | Generali Investments CEE, investicni spolecnost, a.s. | 894.044 | 0,98 | 1.788 | -4,28 | ||||
| 2026-02-12 | 13F | Renaissance Technologies Llc | 7.385.748 | -10,74 | 14.771 | -15,40 | ||||
| 2026-02-03 | 13F | Ballentine Partners, LLC | 31.858 | -5,70 | 64 | -11,27 | ||||
| 2026-02-12 | 13F | Triumph Capital Management | 21.440 | 0,00 | 43 | -6,67 | ||||
| 2026-02-11 | 13F | O'shaughnessy Asset Management, Llc | 80.905 | 19,59 | 162 | 13,38 | ||||
| 2026-02-12 | 13F | Xponance, Inc. | 24.487 | 11,97 | 49 | 4,35 | ||||
| 2026-02-13 | 13F | Truvestments Capital Llc | 357 | 0,00 | 1 | |||||
| 2026-02-13 | 13F | Citigroup Inc | 495.467 | -32,65 | 991 | -36,21 | ||||
| 2026-02-17 | 13F | Quantinno Capital Management LP | 0 | -100,00 | 0 | |||||
| 2026-02-11 | 13F | West Family Investments, Inc. | 48.029 | 0,00 | 96 | -4,95 | ||||
| 2025-11-20 | 13F | First Affirmative Financial Network | 92.258 | 5,40 | 195 | 13,45 | ||||
| 2026-02-13 | 13F | SPX Equities Gestao de Recursos Ltda | 354.805 | 10,61 | 710 | 4,88 | ||||
| 2026-01-30 | 13F | Mitsubishi UFJ Trust & Banking Corp | 36.037 | -6,00 | 72 | -10,00 | ||||
| 2026-02-05 | 13F | Allworth Financial LP | 864 | -37,12 | 2 | -50,00 | ||||
| 2026-01-15 | 13F | Nisa Investment Advisors, Llc | 3.114 | 3,80 | 6 | 0,00 | ||||
| 2026-02-17 | 13F | Modern Wealth Management, LLC | 48.796 | -0,16 | 98 | -5,83 | ||||
| 2026-02-13 | 13F | Morgan Stanley | 3.946.057 | 1,60 | 7.892 | -3,70 | ||||
| 2026-02-17 | 13F | Point72 Asset Management, L.P. | 0 | -100,00 | 0 | |||||
| 2026-01-26 | 13F | PDS Planning, Inc | 41.721 | 0,00 | 83 | -5,68 | ||||
| 2026-01-30 | 13F | Us Bancorp \de\ | 54.014 | 25,63 | 108 | 20,00 | ||||
| 2026-02-13 | 13F | VPR Management LLC | 147.547 | 0,00 | 295 | -5,14 | ||||
| 2026-02-05 | 13F | Atria Investments Llc | 291.996 | 0,80 | 584 | -4,58 | ||||
| 2026-02-13 | 13F | Ieq Capital, Llc | 32.053 | -30,32 | 64 | -34,02 | ||||
| 2026-02-17 | 13F | Citadel Advisors Llc | Call | 0 | -100,00 | 0 | ||||
| 2026-02-12 | 13F | Jane Street Group, Llc | 455.899 | 76,69 | 912 | 67,46 | ||||
| 2025-09-25 | NP | DFCEX - Emerging Markets Core Equity Portfolio - Institutional Class This fund is a listed as child fund of Dimensional Fund Advisors Lp and if that institution has disclosed ownership in this security, then these positions will not be double counted when calculating total shares and total value | 308.387 | 0,00 | 558 | -4,12 | ||||
| 2026-02-11 | 13F | Group One Trading, L.p. | Put | 0 | -100,00 | 0 | -100,00 | |||
| 2026-03-06 | 13F | Hsbc Holdings Plc | 1.173.835 | 29,76 | 2.348 | 23,01 | ||||
| 2026-01-28 | 13F | CAPROCK Group, Inc. | 15.950 | -8,22 | 35 | -2,86 | ||||
| 2026-02-13 | 13F | Great West Life Assurance Co /can/ | 697.707 | 3,45 | 1 | 0,00 | ||||
| 2026-02-17 | 13F | United Capital Financial Advisers, Llc | 2.208.713 | -2,78 | 4.417 | -7,84 | ||||
| 2025-12-18 | 13F | Danske Bank A/s | 0 | -100,00 | 0 | |||||
| 2026-02-17 | 13F | Qube Research & Technologies Ltd | 184.220 | 174,32 | 368 | 160,99 | ||||
| 2026-02-17 | 13F | Russell Investments Group, Ltd. | 444.740 | 7,58 | 889 | 1,95 | ||||
| 2026-01-14 | 13F | Jfs Wealth Advisors, Llc | 585 | 0,00 | 1 | 0,00 | ||||
| 2026-02-05 | 13F | Bessemer Group Inc | 980 | 0 | ||||||
| 2026-02-13 | 13F | Integrated Wealth Concepts LLC | 0 | -100,00 | 0 | |||||
| 2026-02-05 | 13F | Everstar Asset Management, LLC | 550.276 | 10,43 | 1.101 | 4,66 | ||||
| 2026-01-27 | 13F | Checchi Capital Advisers, LLC | 11.933 | 0,00 | 24 | -8,00 | ||||
| 2026-02-10 | 13F | Eurizon Capital SGR S.p.A. | 56.506 | 115 | ||||||
| 2026-02-17 | 13F | Millennium Management Llc | 338.665 | -76,98 | 677 | -78,19 | ||||
| 2026-02-12 | 13F | BRYN MAWR TRUST Co | 0 | -100,00 | 0 | -100,00 | ||||
| 2026-02-12 | 13F | BlackRock, Inc. | 19.646.670 | 3,22 | 39.293 | -2,16 | ||||
| 2026-02-10 | 13F | Bank of New York Mellon Corp | 11.108 | -19,77 | 22 | -24,14 | ||||
| 2026-01-30 | 13F | R Squared Ltd | 25.782 | -47,66 | 52 | -50,49 | ||||
| 2026-02-13 | 13F | Smartleaf Asset Management LLC | 790 | 0,00 | 2 | 0,00 | ||||
| 2026-02-17 | 13F | Advisor Group Holdings, Inc. | 8.870 | -2,19 | 18 | -5,56 | ||||
| 2026-02-18 | 13F | EP Wealth Advisors, Inc. | 16.490 | 33 | ||||||
| 2026-02-06 | 13F | Gsa Capital Partners Llp | 0 | -100,00 | 0 | |||||
| 2025-11-14 | 13F | Wetherby Asset Management Inc | 207.957 | -0,39 | 439 | 7,09 | ||||
| 2026-01-23 | 13F | BSW Wealth Partners | 16.506 | 33 | ||||||
| 2026-02-12 | 13F | CIBC Private Wealth Group, LLC | 1 | 0,00 | 0 | |||||
| 2026-01-08 | 13F | Tuttle Tactical Management LLC | 26.104 | 52 | ||||||
| 2026-02-13 | 13F | Ariadne Wealth Management, LP | 13.650 | -36,10 | 31 | -34,78 | ||||
| 2026-01-27 | 13F | WealthCollab, LLC | 1.944 | 0,00 | 4 | -25,00 | ||||
| 2026-01-16 | 13F | Empirical Financial Services, LLC d.b.a. Empirical Wealth Management | 59.585 | -77,85 | 119 | -79,01 | ||||
| 2026-02-17 | 13F | Creative Planning | 102.501 | -1,51 | 205 | -6,39 | ||||
| 2026-02-13 | 13F | Schroder Investment Management Group | 158.039 | 17,30 | 322 | 13,38 | ||||
| 2025-11-07 | 13F | Sierra Ocean, Llc | 0 | -100,00 | 0 | |||||
| 2026-02-17 | 13F | Brevan Howard Capital Management LP | 0 | -100,00 | 0 | |||||
| 2026-02-05 | 13F | LGT Group Foundation | 34.085 | 0,00 | 70 | 0,00 | ||||
| 2026-02-10 | 13F | Goldman Sachs Group Inc | 19.464.437 | 99,35 | 38.929 | 88,96 | ||||
| 2026-01-21 | 13F | Greenleaf Trust | 456.833 | 0,00 | 914 | -5,19 | ||||
| 2026-01-23 | 13F | Assetmark, Inc | 386 | 1 |
Other Listings
| DE:CID | 1,99 € |