Grundlæggende statistik
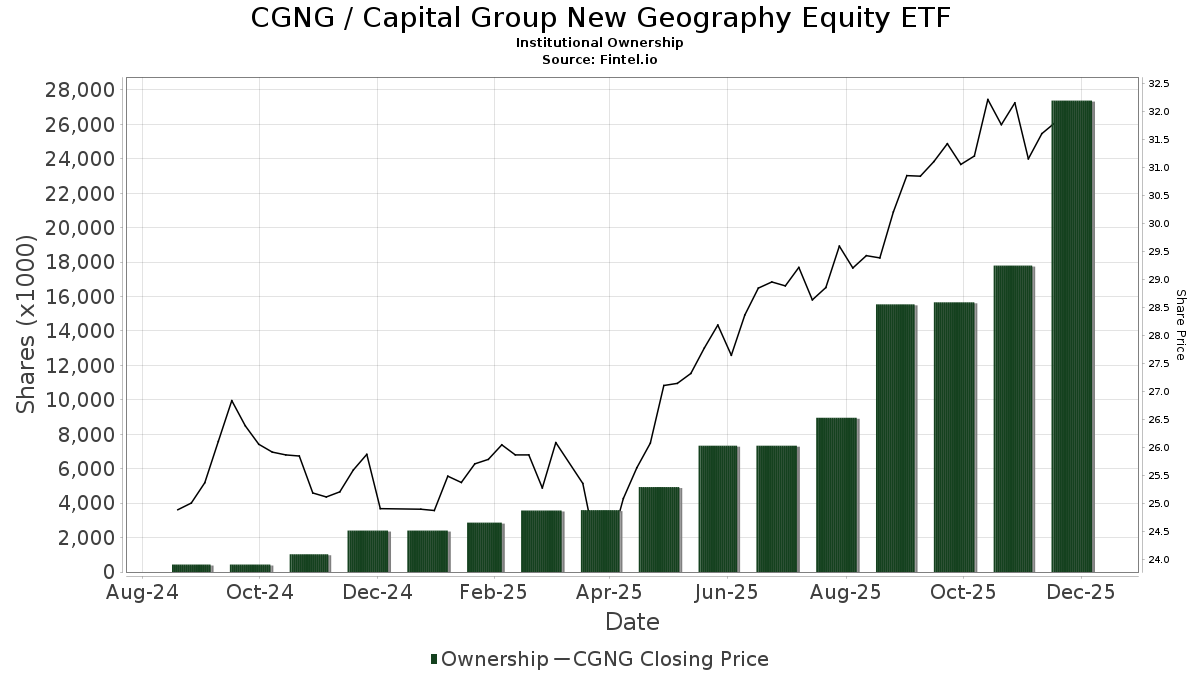
| Institutionelle ejere | 187 total, 187 long only, 0 short only, 0 long/short - change of 17,50% MRQ |
| Gennemsnitlig porteføljeallokering | 0.2765 % - change of 56,25% MRQ |
| Institutionelle aktier (lange) | 35.385.387 (ex 13D/G) - change of 8,00MM shares 29,22% MRQ |
| Institutionel værdi (lang) | $ 1.088.745 USD ($1000) |
Institutionelt ejerskab og aktionærer
Capital Group New Geography Equity ETF (US:CGNG) har 187 institutionelle ejere og aktionærer, der har indsendt 13D/G- eller 13F-formularer til Securities Exchange Commission (SEC). Disse institutioner har i alt 35,385,387 aktier. Største aktionærer omfatter LPL Financial LLC, Capital Group Private Client Services, Inc., Envestnet Asset Management Inc, Raymond James Financial Inc, Cetera Investment Advisers, Northwestern Mutual Wealth Management Co, Bank of New York Mellon Corp, Commonwealth Equity Services, Llc, Advisor Group Holdings, Inc., and Wells Fargo & Company/mn .
Capital Group New Geography Equity ETF (ARCA:CGNG) institutionel ejerskabsstruktur viser aktuelle positioner i virksomheden efter institutioner og fonde, samt seneste ændringer i positionsstørrelse. Større aktionærer kan omfatte individuelle investorer, investeringsforeninger, hedgefonde eller institutioner. Skema 13D angiver, at investoren besidder (eller besidder) mere end 5 % af virksomheden og har til hensigt (eller har til hensigt at) aktivt at forfølge en ændring i forretningsstrategi. Skema 13G indikerer en passiv investering på over 5%.
The share price as of April 2, 2026 is 31,62 / share. Previously, on April 4, 2025, the share price was 23,21 / share. This represents an increase of 36,23% over that period.
Fondens stemningsscore
Fund Sentiment Score (fka Ownership Accumulation Score) finder de aktier, der bliver mest købt af fonde. Det er resultatet af en sofistikeret, multi-faktor kvantitativ model, der identificerer virksomheder med de højeste niveauer af institutionel akkumulering. Scoringsmodellen bruger en kombination af den samlede stigning i oplyste ejere, ændringerne i porteføljeallokeringer i disse ejere og andre målinger. Tallet går fra 0 til 100, hvor højere tal indikerer et højere niveau af akkumulering for sine jævnaldrende, og 50 er gennemsnittet.
Opdateringsfrekvens: Dagligt
Se Ownership Explorer, som giver en liste over højest rangerende virksomheder.
AI+ Ask Fintel’s AI assistant about Capital Group New Geography Equity ETF.
Select a question to share a public post with an AI-crafted answer.
Thinking of good questions…
Institutionel Put/Call-forhold
Ud over at indberette standardaktie- og gældsudstedelser skal institutter med mere end 100 mill. aktiver under forvaltning også oplyse deres put- og call-optionsbeholdninger. Da salgsoptioner generelt indikerer negativ stemning, og købsoptioner indikerer positiv stemning, kan vi få en fornemmelse af den overordnede institutionelle stemning ved at plotte forholdet mellem put og kald. Diagrammet til højre viser det historiske put/call-forhold for dette instrument.
Brug af Put/Call Ratio som en indikator for investorernes stemning overvinder en af de vigtigste mangler ved at bruge totalt institutionelt ejerskab, som er, at en betydelig mængde af aktiver under forvaltning investeres passivt for at spore indekser. Passivt forvaltede fonde køber typisk ikke optioner, så indikatoren for put/call-forholdet følger mere nøje følelsen af aktivt forvaltede fonde.
13F og NPORT arkivering
Detaljer om 13F-arkivering er gratis. Detaljer om NP-ansøgninger kræver et premium-medlemskab. Grønne rækker angiver nye positioner. Røde rækker angiver lukkede positioner. Klik på linket ikon for at se den fulde transaktionshistorik.
Opgrader
for at låse premium-data op og eksportere til Excel ![]() .
.
| Fil dato | Kilde | Investor | Type | Gennemsnitlig pris (Øst) |
Aktier | Δ Aktier (%) |
Rapporteret Værdi ($1000) |
Δ Værdi (%) |
Port Alloc (%) |
|
|---|---|---|---|---|---|---|---|---|---|---|
| 2026-02-10 | 13F | Acorn Wealth Advisors, LLC | 51.343 | 66,10 | 1.639 | 71,62 | ||||
| 2026-01-26 | 13F | Valmark Advisers, Inc. | 30.914 | 44,07 | 987 | 48,87 | ||||
| 2026-01-29 | 13F | Mendel Money Management | 45.329 | -4,79 | 1.447 | -1,63 | ||||
| 2026-01-29 | 13F | Aprio Wealth Management, LLC | 186.234 | 5.946 | ||||||
| 2026-01-09 | 13F | First Heartland Consultants, Inc. | 73.693 | 2.353 | ||||||
| 2026-02-02 | 13F | Benjamin Edwards Inc | 291.549 | 39,93 | 9.309 | 44,60 | ||||
| 2026-02-13 | 13F | Mariner, LLC | 32.865 | 106,75 | 1.049 | 113,65 | ||||
| 2026-01-26 | 13F | Heritage Wealth Management, Inc. | 19.642 | 627 | ||||||
| 2026-02-13 | 13F | Integrated Wealth Concepts LLC | 31.385 | 101,37 | 1.002 | 108,32 | ||||
| 2026-01-23 | 13F | Assetmark, Inc | 330.667 | 44,15 | 10.558 | 48,96 | ||||
| 2026-01-14 | 13F | ORG Partners LLC | 17.148 | 129,71 | 548 | 105,64 | ||||
| 2026-02-10 | 13F | Peapack Gladstone Financial Corp | 132.223 | 120,14 | 4 | 300,00 | ||||
| 2026-01-30 | 13F | Boyer Financial Services, Inc. | 53.436 | 1.741 | ||||||
| 2026-02-05 | 13F | Allworth Financial LP | 574 | 872,88 | 18 | 1.700,00 | ||||
| 2026-02-02 | 13F | Souders Financial Advisors | 180.797 | 2,83 | 5.773 | 6,26 | ||||
| 2026-02-12 | 13F | Steward Partners Investment Advisory, Llc | 53.644 | 13,72 | 1.713 | 17,50 | ||||
| 2026-02-05 | 13F | TrueWealth Financial Partners | 24.341 | 777 | ||||||
| 2026-02-09 | 13F | Kingsview Wealth Management, LLC | 105.444 | 58,67 | 3.367 | 63,96 | ||||
| 2026-01-28 | 13F | Geneos Wealth Management Inc. | 7.627 | 677,47 | 244 | 710,00 | ||||
| 2026-02-11 | 13F | LPL Financial LLC | 4.532.999 | 48,10 | 144.739 | 53,04 | ||||
| 2026-02-13 | 13F | Kestra Advisory Services, LLC | 0 | -100,00 | 0 | |||||
| 2026-01-20 | 13F | Sovran Advisors, LLC | 14.859 | -0,38 | 496 | 4,64 | ||||
| 2026-02-13 | 13F | Advyzon Investment Management, LLC | 9.518 | 304 | ||||||
| 2026-02-02 | 13F | Eq Wealth Advisors, Llc | 28.313 | 9,57 | 904 | 13,28 | ||||
| 2026-01-29 | 13F | Quadcap Wealth Management, LLC | 214.907 | 7,44 | 6.862 | 11,02 | ||||
| 2026-02-06 | 13F | Envestnet Portfolio Solutions, Inc. | 50.586 | 17,33 | 1.615 | 21,25 | ||||
| 2026-02-10 | 13F | Bank of New York Mellon Corp | 1.055.871 | -1,05 | 33.714 | 2,25 | ||||
| 2026-01-13 | 13F | Stablepoint Partners, LLC | 44.869 | 7,27 | 1.433 | 10,84 | ||||
| 2026-02-06 | 13F | EverSource Wealth Advisors, LLC | 2.251 | 4.589,58 | 72 | 7.000,00 | ||||
| 2026-02-13 | 13F | Smartleaf Asset Management LLC | 86.344 | 14,65 | 2.767 | 19,22 | ||||
| 2026-02-10 | 13F | Marshall & Sterling Wealth Advisors Inc. | 0 | -100,00 | 0 | |||||
| 2026-02-13 | 13F | Selby Wealth Management, LLC | 62.647 | 2.000 | ||||||
| 2026-01-27 | 13F | PFG Advisors | 24.919 | 134,51 | 796 | 142,38 | ||||
| 2026-01-21 | 13F | Stonebridge Financial Group, LLC | 44.452 | 73,94 | 1.419 | 79,85 | ||||
| 2026-02-17 | 13F | Advisory Services Network, LLC | 34.178 | 178,37 | 1.091 | 187,86 | ||||
| 2026-02-17 | 13F | Wiley Bros.-aintree Capital, Llc | 251.092 | 49,42 | 8.013 | 54,13 | ||||
| 2026-03-26 | 13F | Merited Wealth, LLC | 31.776 | 1.015 | ||||||
| 2026-01-27 | 13F | Michael Brady & Co., LLC | 14.553 | 465 | ||||||
| 2026-02-10 | 13F | Founders Financial Securities Llc | 41.403 | 147,30 | 1.322 | 155,71 | ||||
| 2026-01-15 | 13F | Saxony Capital Management, LLC | 18.655 | 596 | ||||||
| 2026-02-09 | 13F | Cary Street Partners Financial Llc | 64.481 | 0,89 | 2.059 | 4,26 | ||||
| 2026-02-13 | 13F | BNB Wealth Management, LLC | 13.019 | 416 | ||||||
| 2026-02-17 | 13F | Claro Advisors LLC | 41.685 | 57,36 | 1.331 | 62,71 | ||||
| 2026-01-20 | 13F | NavPoint Financial, Inc. | 80.368 | 46,57 | 2.566 | 51,48 | ||||
| 2026-01-21 | 13F | Ergawealth Advisors, Inc. | 165.051 | 130,41 | 5.270 | 138,14 | ||||
| 2026-02-13 | 13F | Morgan Stanley | 550 | 0,00 | 18 | 6,25 | ||||
| 2026-02-12 | 13F | CIBC Private Wealth Group, LLC | 477 | 0,00 | 15 | 7,14 | ||||
| 2026-01-26 | 13F | Cwm, Llc | 14 | 0 | ||||||
| 2026-02-11 | 13F | Capital Group Private Client Services, Inc. | 2.651.446 | 9,08 | 84.661 | 12,71 | ||||
| 2026-01-14 | 13F | Eagle Rock Investment Company, Llc | 7.546 | 241 | ||||||
| 2026-01-21 | 13F | Prime Capital Investment Advisors, LLC | 15.350 | 490 | ||||||
| 2026-02-18 | 13F | GWM Advisors LLC | 657.916 | 10,44 | 21.007 | 14,13 | ||||
| 2026-01-07 | 13F | Sagespring Wealth Partners, Llc | 20.469 | 33,01 | 654 | 37,47 | ||||
| 2026-02-02 | 13F | Truist Financial Corp | 52.484 | 14,77 | 1.676 | 18,54 | ||||
| 2026-02-05 | 13F | Cambridge Investment Research Advisors, Inc. | 458.420 | 98,69 | 15 | 100,00 | ||||
| 2026-02-12 | 13F | Commonwealth Equity Services, Llc | 909.211 | 15,88 | 29.031 | 120.862,50 | ||||
| 2026-01-16 | 13F | CRA Financial Services, LLC | 91.123 | 4,45 | 2.910 | 7,94 | ||||
| 2026-02-05 | 13F | Cornerstone Wealth Management, LLC | 14.275 | 456 | ||||||
| 2026-01-26 | 13F | Private Trust Co Na | 2.788 | 0,00 | 89 | 3,49 | ||||
| 2026-02-17 | 13F | Warren Averett Asset Management, LLC | 561.314 | 1,00 | 17.923 | 4,36 | ||||
| 2026-01-12 | 13F | National Wealth Management Group, LLC | 163.789 | 5.230 | ||||||
| 2026-01-13 | 13F | Avaii Wealth Management, Llc | 6.720 | 0,27 | 215 | 3,38 | ||||
| 2026-01-14 | 13F | Petredis Investment Advisors Llc | 487.362 | -0,27 | 15.561 | 3,05 | ||||
| 2026-02-13 | 13F | Transamerica Financial Advisors, Inc. | 3.709 | 118 | ||||||
| 2026-02-17 | 13F | Captrust Financial Advisors | 630.281 | 9,06 | 20.125 | 12,69 | ||||
| 2026-01-21 | 13F | Intrinsic Value Partners, LLC | 21.350 | 104,31 | 682 | 111,49 | ||||
| 2026-02-06 | 13F | Cullen/frost Bankers, Inc. | 58.544 | 29,56 | 1.869 | 33,88 | ||||
| 2026-02-12 | 13F | Principal Securities, Inc. | 41.283 | 30,20 | 1.318 | 34,63 | ||||
| 2026-02-06 | 13F | Creative Financial Designs Inc /adv | 125 | 0,00 | 4 | 0,00 | ||||
| 2026-02-12 | 13F | Rossby Financial, LCC | 134 | 4 | ||||||
| 2026-02-11 | 13F | Gateway Wealth Partners, LLC | 15.613 | 52,78 | 499 | 58,10 | ||||
| 2026-02-11 | 13F | Janney Montgomery Scott LLC | 242.976 | 31,24 | 8 | 40,00 | ||||
| 2026-02-17 | 13F | Signature Equity Partners, LLC | 146 | 5 | ||||||
| 2026-01-14 | 13F | Nova R Wealth, Inc. | 16.821 | -25,02 | 537 | -22,51 | ||||
| 2026-02-04 | 13F | Ameritas Advisory Services, LLC | 0 | -100,00 | 0 | |||||
| 2026-02-12 | 13F | Great Valley Advisor Group, Inc. | 15.746 | 23,35 | 503 | 27,41 | ||||
| 2026-01-26 | 13F | Transcendent Capital Group LLC | 12.780 | 26,80 | 408 | 31,19 | ||||
| 2026-01-13 | 13F | CoreCap Advisors, LLC | 23 | 1 | ||||||
| 2026-02-13 | 13F | Blueprint Financial Advisors LLC | 22.120 | 89,76 | 706 | 96,11 | ||||
| 2026-02-13 | 13F | Mml Investors Services, Llc | 364.110 | 21,87 | 11.626 | 25,95 | ||||
| 2026-02-17 | 13F | LaSalle St. Investment Advisors, LLC | 26.204 | 1 | ||||||
| 2026-02-10 | 13F | Natixis Advisors, L.p. | 56.924 | 423,54 | 2 | |||||
| 2026-01-20 | 13F | Stratos Wealth Partners, LTD. | 130.735 | 59,00 | 4.174 | 64,33 | ||||
| 2026-01-29 | 13F | Concurrent Investment Advisors, LLC | 252.445 | 79,53 | 8.061 | 85,54 | ||||
| 2026-02-17 | 13F | Jones Financial Companies Lllp | 219.619 | 65,37 | 7.012 | 72,45 | ||||
| 2026-02-03 | 13F | International Assets Investment Management, Llc | 7.530 | 240 | ||||||
| 2026-02-17 | 13F | IHT Wealth Management, LLC | 15.951 | 509 | ||||||
| 2026-01-15 | 13F | Lodestone Wealth Management LLC | 20.675 | 45,14 | 660 | 50,00 | ||||
| 2026-01-29 | 13F | Nbc Securities, Inc. | 283 | -1,39 | 9 | 12,50 | ||||
| 2026-02-11 | 13F | Capital Analysts, Inc. | 363.888 | 27,62 | 12 | 37,50 | ||||
| 2026-01-30 | 13F | Canandaigua National Trust Co of Florida | 9.565 | 305 | ||||||
| 2026-02-17 | 13F | Raymond James Financial Inc | 2.119.703 | 66,41 | 67.682 | 71,96 | ||||
| 2026-01-30 | 13F | Strategic Blueprint, LLC | 118.464 | 18,63 | 3.783 | 22,59 | ||||
| 2026-02-17 | 13F | Lantern Wealth Advisors, LLC | 7.228 | 231 | ||||||
| 2026-02-19 | 13F | Birchwood Financial Partners, Inc. | 3.927 | 125 | ||||||
| 2026-02-09 | 13F | Huntington National Bank | 1 | 0,00 | ||||||
| 2026-01-16 | 13F | Tempus Wealth Planning, LLC | 12.019 | 8,07 | 384 | 11,66 | ||||
| 2026-02-17 | 13F | Royal Bank Of Canada | 608.790 | 7,51 | 19.439 | 11,10 | ||||
| 2026-01-05 | 13F | Park Avenue Securities Llc | 23.046 | 15,40 | 1 | |||||
| 2026-01-23 | 13F | Clear Creek Financial Management, LLC | 69.299 | 15,82 | 2.213 | 19,70 | ||||
| 2026-01-21 | 13F | Capital Investment Advisory Services, LLC | 10.142 | 3,60 | 324 | 6,95 | ||||
| 2026-02-10 | 13F | IFG Advisory, LLC | 29.899 | 955 | ||||||
| 2026-02-09 | 13F | Prospera Financial Services Inc | 6.712 | 214 | ||||||
| 2026-02-12 | 13F | Jane Street Group, Llc | 0 | -100,00 | 0 | |||||
| 2026-01-15 | 13F | ERn Financial, LLC | 10.707 | 342 | ||||||
| 2026-02-10 | 13F | Sittner & Nelson, Llc | 8.933 | 80,28 | 304 | 98,04 | ||||
| 2026-02-13 | 13F | Centaurus Financial, Inc. | 5.012 | -0,87 | 0 | |||||
| 2026-01-14 | 13F | Johnson Bixby & Associates, LLC | 466.836 | -8,38 | 14.906 | -5,33 | ||||
| 2026-02-11 | 13F | Capital International Investors | 40.883 | -0,57 | 1.305 | 2,76 | ||||
| 2026-02-13 | 13F | SRS Capital Advisors, Inc. | 201 | 6 | ||||||
| 2026-02-17 | 13F | Cetera Investment Advisers | 2.118.041 | 13,52 | 67.629 | 17,31 | ||||
| 2026-02-04 | 13F | Garrett Wealth Advisory Group, LLC | 466.674 | 9,09 | 14.901 | 12,73 | ||||
| 2025-11-05 | 13F | Moloney Securities Asset Management, LLC | 15.750 | -53,33 | 487 | -50,00 | ||||
| 2026-02-09 | 13F | Rhl Group, Llc | 33 | 1 | ||||||
| 2026-01-09 | 13F | Dynamic Advisor Solutions LLC | 31.573 | 1.008 | ||||||
| 2026-02-05 | 13F | True Blue Financial, LLC | 24.341 | 777 | ||||||
| 2026-02-17 | 13F | Advisor Group Holdings, Inc. | 801.988 | 162,62 | 25.610 | 178,19 | ||||
| 2026-02-05 | 13F | Armor Investment Advisors, LLC | 195.246 | 13,05 | 6.234 | 16,83 | ||||
| 2026-02-17 | 13F | Susquehanna International Group, Llp | 0 | -100,00 | 0 | |||||
| 2026-02-17 | 13F | Main Street Financial Solutions, LLC | 28.494 | 132,21 | 910 | 139,84 | ||||
| 2026-02-10 | 13F | Envestnet Asset Management Inc | 2.557.197 | 15,24 | 81.651 | 19,08 | ||||
| 2026-03-23 | 13F | J. Derek Lewis & Associates Inc. | 105.281 | 3.362 | ||||||
| 2026-01-20 | 13F | AdvisorNet Financial, Inc | 488 | 876,00 | 16 | 1.400,00 | ||||
| 2026-02-02 | 13F | Mutual Advisors, LLC | 8.158 | 1,15 | 260 | 2,77 | ||||
| 2026-02-02 | 13F | CENTRAL TRUST Co | 51 | 2 | ||||||
| 2026-01-29 | 13F | Comerica Bank | 4.915 | 28,13 | 157 | 32,20 | ||||
| 2026-02-09 | 13F | Harbour Investments, Inc. | 70.637 | 35,18 | 2.255 | 39,71 | ||||
| 2026-01-28 | 13F | Financial Perspectives, Inc | 148 | 5 | ||||||
| 2026-02-17 | 13F | Bank Of America Corp /de/ | 562.947 | 2.890,26 | 17.975 | 2.993,63 | ||||
| 2026-01-23 | 13F | Lincoln Capital Corp | 231.396 | 3,56 | 7.388 | 7,01 | ||||
| 2026-02-04 | 13F | Pensionmark Financial Group, Llc | 15.717 | 4,33 | 500 | 7,31 | ||||
| 2026-02-13 | 13F | MAI Capital Management | 13.001 | 21,37 | 415 | 25,38 | ||||
| 2026-01-14 | 13F | Exchange Traded Concepts, Llc | 21 | -65,57 | 1 | -100,00 | ||||
| 2026-02-09 | 13F | William Mack & Associates, Inc. | 11.921 | -1,07 | 381 | 2,15 | ||||
| 2026-01-21 | 13F/A | Main Line Retirement Advisors, LLC | 11.276 | 0,68 | 360 | 4,05 | ||||
| 2026-02-17 | 13F | Citadel Advisors Llc | 0 | -100,00 | 0 | |||||
| 2026-02-03 | 13F | RFG Advisory, LLC | 18.134 | 5,54 | 579 | 9,25 | ||||
| 2026-01-21 | 13F | McNamara Financial Services, Inc. | 59.236 | 1,51 | 1.891 | 4,88 | ||||
| 2026-02-17 | 13F | Cape Investment Advisory, Inc. | 1.681 | 54 | ||||||
| 2026-01-08 | 13F | Sar Wealth Management Group, Llc | 8.595 | 23,90 | 274 | 28,04 | ||||
| 2026-01-28 | 13F | Ai Financial Services Llc | 36.732 | 6,67 | 1.173 | 9,53 | ||||
| 2026-02-05 | 13F | Stephens Inc /ar/ | 316.541 | -13,92 | 10.107 | -11,05 | ||||
| 2026-02-13 | 13F | Gts Securities Llc | 12.464 | -75,65 | 398 | -74,89 | ||||
| 2026-01-26 | 13F | Nations Financial Group Inc, /ia/ /adv | 82.553 | -0,92 | 2.636 | 2,37 | ||||
| 2026-02-10 | 13F | Vantus Wealth LLC | 9.395 | 300 | ||||||
| 2026-02-13 | 13F | Venture Visionary Partners LLC | 29.133 | 171,33 | 930 | 180,97 | ||||
| 2026-01-28 | 13F | SilverOak Wealth Management LLC | 281.216 | 165,16 | 8.979 | 174,00 | ||||
| 2026-02-14 | 13F | Rockefeller Capital Management L.P. | 63.110 | 2.015 | ||||||
| 2026-02-17 | 13F | Equitable Holdings, Inc. | 34.636 | 56,62 | 1.106 | 61,79 | ||||
| 2026-02-13 | 13F | Stifel Financial Corp | 248.205 | 82,88 | 7.925 | 89,01 | ||||
| 2026-02-13 | 13F | Wells Fargo & Company/mn | 692.051 | 334,48 | 22.097 | 349,03 | ||||
| 2026-02-12 | 13F | Richmond Investment Services, LLC | 11.160 | 51,45 | 356 | 56,83 | ||||
| 2026-01-20 | 13F | Cornell Pochily Investment Advisors, Inc. | 44.089 | 5,25 | 1.408 | 8,73 | ||||
| 2026-02-10 | 13F/A | Northwestern Mutual Wealth Management Co | 1.736.735 | 28,15 | 55.454 | 32,42 | ||||
| 2026-02-13 | 13F | Baird Financial Group, Inc. | 253.751 | 51,48 | 8.102 | 56,53 | ||||
| 2026-01-20 | 13F | Stewardship Concepts Financial Services Llc | 86.388 | 2.763 | ||||||
| 2026-01-29 | 13F | Sanctuary Advisors, LLC | 22.586 | -24,61 | 721 | -22,05 | ||||
| 2026-02-02 | 13F | Pines Wealth Management, LLC | 46.406 | 227,08 | 1.482 | 238,13 | ||||
| 2026-02-09 | 13F | Bleakley Financial Group, LLC | 103.408 | 14,82 | 3.302 | 18,66 | ||||
| 2026-01-28 | 13F | Cambridge Capital Management, Llc | 21.070 | 199,72 | 673 | 209,68 | ||||
| 2026-02-18 | 13F | Beacon Pointe Advisors, LLC | 279.944 | 12,17 | 8.939 | 15,91 | ||||
| 2026-01-21 | 13F | Flagship Harbor Advisors, Llc | 1.070 | 34 | ||||||
| 2026-02-10 | 13F | Rothschild Investment Llc | 6.200 | 93,75 | 198 | 101,02 | ||||
| 2026-02-05 | 13F | Western Wealth Management, LLC | 42.464 | 6,69 | 1.356 | 10,25 | ||||
| 2026-01-23 | 13F | Farther Finance Advisors, LLC | 927 | 0,65 | 30 | 3,57 | ||||
| 2026-01-28 | 13F | Confluence Wealth Services, Inc. | 453.794 | 9,13 | 14.490 | 12,76 | ||||
| 2026-01-23 | 13F | U.S. Capital Wealth Advisors, LLC | 68.714 | 2,43 | 2.194 | 5,89 | ||||
| 2026-02-17 | 13F | Ameriflex Group, Inc. | 0 | -100,00 | 0 | |||||
| 2026-02-17 | 13F | Old Mission Capital Llc | 0 | -100,00 | 0 | |||||
| 2026-01-13 | 13F | LongView Wealth Management | 50.896 | 61,43 | 1.707 | 75,15 | ||||
| 2026-02-02 | 13F | Cypress Point Wealth Management, LLC | 28.143 | 33,52 | 899 | 37,94 | ||||
| 2026-01-27 | 13F | Security Financial Services, INC. | 13.882 | 30,14 | 443 | 34,65 | ||||
| 2026-02-10 | 13F | NewCorp Financial Services, Inc. | 133.464 | 4.262 | ||||||
| 2026-02-10 | 13F | Florida Financial Advisors, Llc | 7.951 | 5,83 | 254 | 9,05 | ||||
| 2026-01-14 | 13F | Spire Wealth Management | 8.962 | 0,67 | 286 | 4,00 | ||||
| 2026-02-05 | 13F | Atria Investments Llc | 11.996 | 383 | ||||||
| 2026-01-14 | 13F | Lantz Financial LLC | 94.046 | 18,76 | 3.003 | 22,68 | ||||
| 2026-02-06 | 13F | GPS Wealth Strategies Group, LLC | 0 | -100,00 | 0 | |||||
| 2026-02-06 | 13F | Global Retirement Partners, LLC | 17.821 | 133,50 | 569 | 142,13 | ||||
| 2026-02-10 | 13F | Beckerman Institutional, LLC | 13.158 | 3,90 | 420 | 7,42 | ||||
| 2026-02-12 | 13F | Glaxis Capital Management, LLC | 0 | -100,00 | 0 | |||||
| 2026-01-29 | 13F | UBS Group AG | 255 | 0,00 | 8 | 14,29 | ||||
| 2026-02-06 | 13F | IFP Advisors, Inc | 642 | 0,00 | 20 | 5,26 | ||||
| 2026-02-13 | 13F | Beta Wealth Group, Inc. | 50.497 | -1,75 | 1.612 | 1,51 | ||||
| 2026-02-11 | 13F | Jpmorgan Chase & Co | 3.473 | 843,75 | 111 | 900,00 | ||||
| 2026-01-08 | 13F | Wealth Enhancement Advisory Services, Llc | 427.985 | 1.392,17 | 14.222 | 1.494,28 | ||||
| 2026-01-26 | 13F | Merit Financial Group, LLC | 508.723 | 2,07 | 16.244 | 5,47 | ||||
| 2026-02-12 | 13F | Brinker Capital Investments, LLC | 183.072 | 12,51 | 5.845 | 16,27 | ||||
| 2026-02-17 | 13F | Perennial Investment Advisors, LLC | 85.131 | 26,57 | 2.718 | 30,80 | ||||
| 2026-02-17 | 13F | Private Advisor Group, LLC | 305.546 | 10,74 | 9.756 | 14,44 | ||||
| 2026-01-23 | 13F | Diversify Advisory Services, LLC | 9.921 | 331 | ||||||
| 2026-01-16 | 13F | Balboa Wealth Partners | 7.093 | 226 | ||||||
| 2026-02-17 | 13F | Blueprint Investment Partners LLC | 22.586 | 93,75 | 721 | 100,28 | ||||
| 2025-11-14 | 13F | Flow Traders U.s. Llc | 0 | -100,00 | 0 | |||||
| 2026-02-03 | 13F | Koshinski Asset Management, Inc. | 14.820 | 66,67 | 473 | 72,63 | ||||
| 2026-02-06 | 13F | Vestmark Advisory Solutions, Inc. | 123.775 | 12,68 | 3.952 | 16,44 | ||||
| 2026-01-16 | 13F | Armstrong, Fleming & Moore, Inc | 84.927 | 1,70 | 2.712 | 5,08 | ||||
| 2026-01-22 | 13F | Bfsg, Llc | 38.621 | 3.606,43 | 1.233 | 3.753,13 | ||||
| 2026-01-22 | 13F | Financial Consulate, Inc | 33 | 1 |