Grundlæggende statistik
| Institutionelle aktier (lange) | 133.224.475 - 28,74% (ex 13D/G) - change of 91,97MM shares 222,90% MRQ |
| Institutionel værdi (lang) | $ 108.247 USD ($1000) |
Institutionelt ejerskab og aktionærer
Beyond Meat, Inc. (US:BYND) har 240 institutionelle ejere og aktionærer, der har indsendt 13D/G- eller 13F-formularer til Securities Exchange Commission (SEC). Disse institutioner har i alt 133,224,475 aktier. Største aktionærer omfatter BlackRock, Inc., Vanguard Group Inc, Geode Capital Management, Llc, UBS Group AG, State Street Corp, Group One Trading, L.p., Simplex Trading, Llc, National Bank Of Canada /fi/, Group One Trading, L.p., and Susquehanna International Group, Llp .
Beyond Meat, Inc. (NasdaqGS:BYND) institutionel ejerskabsstruktur viser aktuelle positioner i virksomheden efter institutioner og fonde, samt seneste ændringer i positionsstørrelse. Større aktionærer kan omfatte individuelle investorer, investeringsforeninger, hedgefonde eller institutioner. Skema 13D angiver, at investoren besidder (eller besidder) mere end 5 % af virksomheden og har til hensigt (eller har til hensigt at) aktivt at forfølge en ændring i forretningsstrategi. Skema 13G indikerer en passiv investering på over 5%.
The share price as of April 21, 2026 is 1,05 / share. Previously, on April 22, 2025, the share price was 2,62 / share. This represents a decline of 59,85% over that period.

Fondens stemningsscore
Fund Sentiment Score (fka Ownership Accumulation Score) finder de aktier, der bliver mest købt af fonde. Det er resultatet af en sofistikeret, multi-faktor kvantitativ model, der identificerer virksomheder med de højeste niveauer af institutionel akkumulering. Scoringsmodellen bruger en kombination af den samlede stigning i oplyste ejere, ændringerne i porteføljeallokeringer i disse ejere og andre målinger. Tallet går fra 0 til 100, hvor højere tal indikerer et højere niveau af akkumulering for sine jævnaldrende, og 50 er gennemsnittet.
Opdateringsfrekvens: Dagligt
Se Ownership Explorer, som giver en liste over højest rangerende virksomheder.
AI+ Ask Fintel’s AI assistant about Beyond Meat, Inc..
Select a question to share a public post with an AI-crafted answer.
Thinking of good questions…
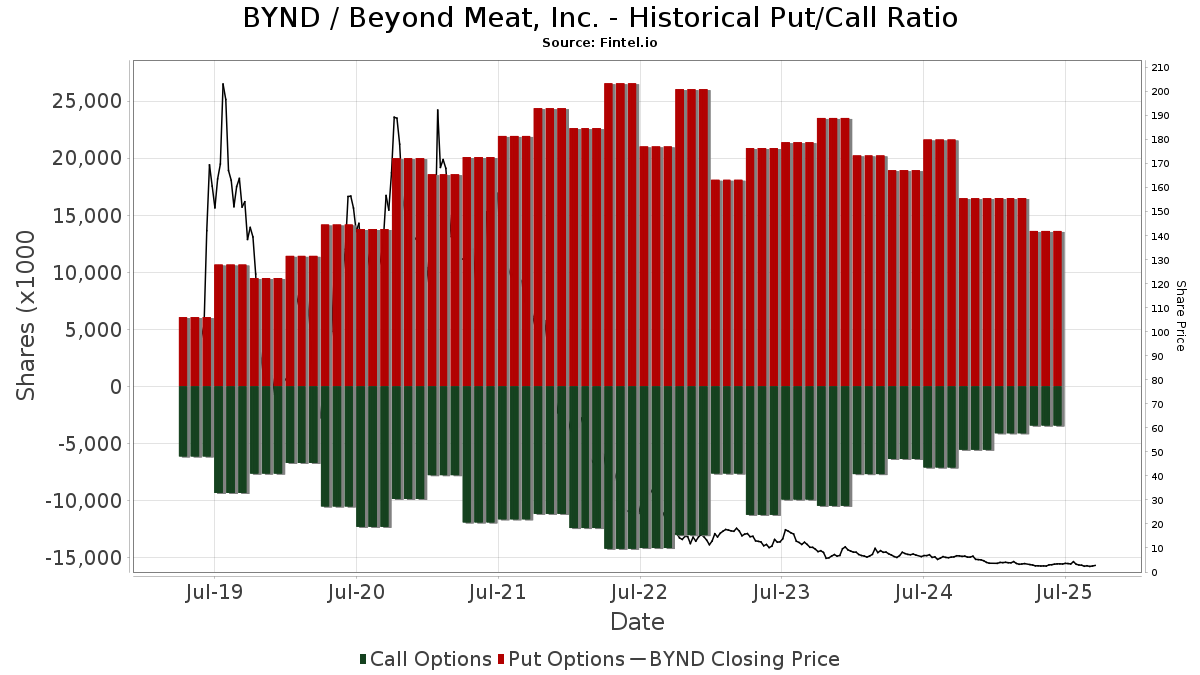
Institutionel Put/Call-forhold
Ud over at indberette standardaktie- og gældsudstedelser skal institutter med mere end 100 mill. aktiver under forvaltning også oplyse deres put- og call-optionsbeholdninger. Da salgsoptioner generelt indikerer negativ stemning, og købsoptioner indikerer positiv stemning, kan vi få en fornemmelse af den overordnede institutionelle stemning ved at plotte forholdet mellem put og kald. Diagrammet til højre viser det historiske put/call-forhold for dette instrument.
Brug af Put/Call Ratio som en indikator for investorernes stemning overvinder en af de vigtigste mangler ved at bruge totalt institutionelt ejerskab, som er, at en betydelig mængde af aktiver under forvaltning investeres passivt for at spore indekser. Passivt forvaltede fonde køber typisk ikke optioner, så indikatoren for put/call-forholdet følger mere nøje følelsen af aktivt forvaltede fonde.
13D/G-arkivering
Vi præsenterer 13D/G ansøgninger separat fra 13F ansøgninger på grund af den forskellige behandling af SEC. 13D/G-ansøgninger kan indgives af grupper af investorer (med én ledende), hvorimod 13F-ansøgninger ikke kan. Dette resulterer i situationer, hvor en investor kan indsende en 13D/G, der rapporterer én værdi for de samlede aktier (der repræsenterer alle de aktier, der ejes af investorgruppen), men derefter indsender en 13F, der rapporterer en anden værdi for de samlede aktier (der udelukkende repræsenterer deres egne) ejendomsret). Det betyder, at aktieejerskab af 13D/G-arkiver og 13F-arkiveringer ofte ikke er direkte sammenlignelige, så vi præsenterer dem separat.
Bemærk: Fra den 16. maj 2021 viser vi ikke længere ejere, der ikke har indsendt en 13D/G inden for det seneste år. Tidligere viste vi den fulde historie af 13D/G-arkiver. Generelt skal enheder, der er forpligtet til at indgive 13D/G-ansøgninger, indgive mindst årligt, før de indsender en afsluttende ansøgning. Dog forlader fonde nogle gange positioner uden at indsende en afsluttende ansøgning (dvs. de afvikler), så visning af den fulde historie resulterede nogle gange i forvirring om det nuværende ejerskab. For at undgå forvirring viser vi nu kun 'aktuelle' ejere - det vil sige - ejere, der har anmeldt inden for det seneste år.
Upgrade to unlock premium data.
| Fil dato | Form | Investor | Forrige Aktier |
Seneste Aktier |
Δ Aktier (Procent) |
Ejendomsret (Procent) |
Δ Ejerskab (Procent) |
|
|---|---|---|---|---|---|---|---|---|
| 2026-02-02 | JANE STREET GROUP, LLC | 22,655,051 | 3,333,450 | -85.29 | 0.70 | -87.72 | ||
| 2026-01-30 | VANGUARD GROUP INC | 4,250,418 | 24,526,646 | 477.04 | 5.40 | -17.30 | ||
| 2025-10-22 | D. E. SHAW & CO, L.P. | 9,000,000 | 2.30 | |||||
| 2025-10-22 | WOLVERINE ASSET MANAGEMENT LLC | 18,934,083 | 4.82 | |||||
| 2025-10-21 | Context Capital Management, LLC | 20,514,535 | 0 | -100.00 | 0.00 | -100.00 | ||
| 2025-09-25 | Unprocessed Foods, LLC | 9,558,635 | 12.50 | |||||
| 2025-07-16 | BlackRock, Inc. | 4,360,807 | 5,228,826 | 19.91 | 6.80 | 19.30 |
13F og NPORT arkivering
Detaljer om 13F-arkivering er gratis. Detaljer om NP-ansøgninger kræver et premium-medlemskab. Grønne rækker angiver nye positioner. Røde rækker angiver lukkede positioner. Klik på linket ikon for at se den fulde transaktionshistorik.
Opgrader
for at låse premium-data op og eksportere til Excel ![]() .
.
| Fil dato | Kilde | Investor | Type | Gennemsnitlig pris (Øst) |
Aktier | Δ Aktier (%) |
Rapporteret Værdi ($1000) |
Δ Værdi (%) |
Port Alloc (%) |
|
|---|---|---|---|---|---|---|---|---|---|---|
| 2026-02-06 | 13F | Addison Advisors LLC | 206 | 0,00 | 0 | |||||
| 2026-02-17 | 13F | Shay Capital LLC | 512.975 | 421 | ||||||
| 2026-02-13 | 13F | MAI Capital Management | 231 | 645,16 | 0 | |||||
| 2026-02-10 | 13F | Peapack Gladstone Financial Corp | 11.144 | 0 | ||||||
| 2026-02-13 | 13F | SRS Capital Advisors, Inc. | 24 | -98,86 | 0 | -100,00 | ||||
| 2026-02-17 | 13F | Raymond James Financial Inc | 24.092 | 97,01 | 20 | -17,39 | ||||
| 2026-02-20 | 13F | Sunbelt Securities, Inc. | 30 | 0,00 | 0 | |||||
| 2026-04-16 | 13F | SG Americas Securities, LLC | 0 | -100,00 | 0 | |||||
| 2026-01-21 | 13F | Albion Financial Group /ut | 130 | 0,00 | 0 | |||||
| 2026-02-13 | 13F | Stifel Financial Corp | 12.861 | 11 | ||||||
| 2026-02-12 | 13F | Xponance, Inc. | 29.893 | 25 | ||||||
| 2026-02-17 | 13F | Cetera Investment Advisers | 39.572 | 23,90 | 32 | -46,67 | ||||
| 2026-02-06 | 13F | Leonteq Securities AG | 40.381 | 25,29 | 33 | -45,00 | ||||
| 2026-02-13 | 13F | Police & Firemen's Retirement System of New Jersey | 97.340 | 372,57 | 80 | 107,89 | ||||
| 2026-02-17 | 13F | Parkwood LLC | 0 | -100,00 | 0 | -100,00 | ||||
| 2026-02-19 | 13F | Invesco Ltd. | 411.729 | 109,81 | 338 | -8,92 | ||||
| 2026-02-05 | 13F | Bank Julius Baer & Co. Ltd, Zurich | 0 | -100,00 | 0 | -100,00 | ||||
| 2026-02-05 | 13F | HighMark Wealth Management LLC | 65 | -98,72 | 0 | -100,00 | ||||
| 2026-02-10 | 13F | Envestnet Asset Management Inc | 19.954 | -1,64 | 16 | -57,89 | ||||
| 2026-01-29 | 13F | Comerica Bank | 15 | -97,95 | 0 | -100,00 | ||||
| 2026-02-13 | 13F | Financial Freedom, LLC | 126 | 0,00 | 0 | |||||
| 2026-02-12 | 13F | Voya Investment Management Llc | 66.827 | 363,69 | 55 | 100,00 | ||||
| 2026-01-23 | 13F | Westside Investment Management, Inc. | 7.300 | -35,40 | 6 | -76,19 | ||||
| 2026-02-09 | 13F | Harbour Investments, Inc. | 803 | 112,43 | 1 | |||||
| 2026-01-30 | 13F | Us Bancorp \de\ | 0 | -100,00 | 0 | |||||
| 2026-02-13 | 13F | Vontobel Holding Ltd. | Call | 24.800 | 20 | |||||
| 2026-04-14 | 13F | Clean Yield Group | 0 | -100,00 | 0 | |||||
| 2026-02-17 | 13F | Toronto Dominion Bank | 0 | -100,00 | 0 | -100,00 | ||||
| 2026-02-17 | 13F | Advisory Services Network, LLC | 0 | -100,00 | 0 | |||||
| 2026-02-13 | 13F | Prudential Financial Inc | 19.545 | 16 | ||||||
| 2026-02-13 | 13F | Rhumbline Advisers | 413.151 | 284,75 | 339 | 67,33 | ||||
| 2026-04-07 | 13F | CoreCap Advisors, LLC | 1.115 | 0,00 | 1 | |||||
| 2026-02-11 | 13F | Cedar Mountain Advisors, LLC | 1 | 0,00 | 0 | |||||
| 2026-02-10 | 13F | Godfrey Financial Associates, Inc. | 115 | 0 | ||||||
| 2025-11-14 | 13F | Wolverine Trading, Llc | 24.349 | 44 | ||||||
| 2025-11-14 | 13F | Wolverine Trading, Llc | Call | 252.000 | 459 | |||||
| 2026-01-21 | 13F | Flagship Harbor Advisors, Llc | 176 | 0 | ||||||
| 2025-11-14 | 13F | Wolverine Trading, Llc | Put | 329.100 | 599 | |||||
| 2026-04-15 | 13F | Regatta Capital Group, Llc | 20.075 | 0,00 | 14 | -12,50 | ||||
| 2026-02-27 | 13F/A | Barclays Plc | Put | 0 | -100,00 | 0 | -100,00 | |||
| 2026-01-07 | 13F | Massmutual Trust Co Fsb/adv | 0 | -100,00 | 0 | -100,00 | ||||
| 2026-01-08 | 13F | Chesapeake Asset Management Llc | 0 | -100,00 | 0 | |||||
| 2026-02-12 | 13F | Mint Tower Capital Management B.V. | Put | 10.000 | 0 | |||||
| 2026-02-17 | 13F | Canada Pension Plan Investment Board | 302.300 | 248 | ||||||
| 2026-02-17 | 13F | Edmond De Rothschild Holding S.a. | 1.295 | 0,00 | 1 | -50,00 | ||||
| 2026-02-17 | 13F | Two Sigma Investments, Lp | Put | 2.791.200 | -8,29 | 2.289 | -60,22 | |||
| 2026-02-17 | 13F | Two Sigma Investments, Lp | 1.496.748 | 1.227 | ||||||
| 2026-02-17 | 13F | Price T Rowe Associates Inc /md/ | 237.772 | 208,09 | 0 | |||||
| 2025-11-14 | 13F | Millennium Management Llc | Call | 0 | -100,00 | 0 | -100,00 | |||
| 2026-02-13 | 13F | Ieq Capital, Llc | 183.522 | 150 | ||||||
| 2026-02-10 | 13F | Axq Capital, Lp | 0 | -100,00 | 0 | |||||
| 2026-02-12 | 13F | Marex Group plc | 41.074 | 34 | ||||||
| 2026-02-10 | 13F | Intech Investment Management Llc | 25.279 | -36,36 | 21 | -73,33 | ||||
| 2026-02-17 | 13F | Alliancebernstein L.p. | 100.666 | 0,00 | 83 | -56,84 | ||||
| 2025-11-06 | 13F | Ameritas Advisory Services, LLC | 0 | -100,00 | 0 | |||||
| 2026-04-08 | 13F | Wealth Enhancement Advisory Services, Llc | 295.029 | 152 | ||||||
| 2026-01-12 | 13F | Salem Investment Counselors Inc | 0 | -100,00 | 0 | |||||
| 2026-01-20 | 13F | SOA Wealth Advisors, LLC. | 12 | 0,00 | 0 | |||||
| 2026-02-10 | 13F | Close Asset Management Ltd | 60 | 0,00 | 0 | |||||
| 2026-02-05 | 13F | Plante Moran Financial Advisors, LLC | 1.964 | 1.471,20 | 2 | |||||
| 2026-02-12 | 13F | Peterson Wealth Services | 25 | 92,31 | 0 | |||||
| 2026-02-13 | 13F | Glen Eagle Advisors, LLC | 1 | 0,00 | 0 | |||||
| 2026-02-17 | 13F | Clear Street Markets Llc | 0 | -100,00 | 0 | -100,00 | ||||
| 2026-02-17 | 13F | Clear Street Markets Llc | Put | 0 | -100,00 | 0 | -100,00 | |||
| 2026-04-17 | 13F | Kaufman Rossin Wealth, LLC | 141.830 | 100 | ||||||
| 2026-04-17 | 13F | Krilogy Financial LLC | 79.233 | 62 | ||||||
| 2026-02-02 | 13F | Wolverine Asset Management Llc | Put | 1.598.500 | -1,22 | 1.311 | -57,16 | |||
| 2026-02-17 | 13F | California State Teachers Retirement System | 23.604 | 412,02 | 19 | 137,50 | ||||
| 2026-04-10 | 13F | Perigon Wealth Management, LLC | 29.766 | 195,12 | 21 | 150,00 | ||||
| 2026-02-05 | 13F | 1620 Investment Advisors, Inc. | 10 | 0,00 | 0 | |||||
| 2026-01-15 | 13F | Nisa Investment Advisors, Llc | 0 | -100,00 | 0 | -100,00 | ||||
| 2026-02-13 | 13F | Vontobel Holding Ltd. | 3.021.875 | 3,56 | 2.478 | -55,09 | ||||
| 2026-02-13 | 13F | Golden State Wealth Management, LLC | 162 | 0,00 | 0 | |||||
| 2025-11-14 | 13F | III Capital Management | Put | 0 | -100,00 | 0 | -100,00 | |||
| 2026-04-06 | 13F | GAMMA Investing LLC | 3.636 | -52,96 | 3 | -66,67 | ||||
| 2026-02-13 | 13F | Sculptor Capital LP | Put | 351.600 | 274,44 | 288 | 62,71 | |||
| 2025-11-14 | 13F/A | Skopos Labs, Inc. | 0 | -100,00 | 0 | -100,00 | ||||
| 2026-02-13 | 13F | Sculptor Capital LP | 258.700 | 25.770,00 | 212 | 21.100,00 | ||||
| 2026-02-06 | 13F | VSM Wealth Advisory, LLC | 33 | 0,00 | 0 | |||||
| 2026-02-13 | 13F | Walleye Capital LLC | Call | 7.700 | 6 | |||||
| 2026-02-13 | 13F | Walleye Capital LLC | Put | 74.400 | 61 | |||||
| 2026-02-17 | 13F | Susquehanna International Group, Llp | Call | 4.776.300 | 151,70 | 3.917 | 9,20 | |||
| 2026-02-03 | 13F | Bokf, Na | 0 | -100,00 | 0 | |||||
| 2026-02-17 | 13F | Susquehanna International Group, Llp | 2.082.601 | 1.708 | ||||||
| 2026-03-20 | 13F/A | Hsbc Holdings Plc | 86.980 | 167,86 | 72 | 28,57 | ||||
| 2026-02-17 | 13F | Susquehanna International Group, Llp | Put | 4.371.900 | 98,01 | 3.585 | -14,09 | |||
| 2025-11-13 | 13F | Bnp Paribas Arbitrage, Sa | Put | 0 | -100,00 | 0 | -100,00 | |||
| 2026-01-29 | 13F | Vanguard Group Inc | 24.526.676 | 413,11 | 20.112 | 122,61 | ||||
| 2026-02-12 | 13F | Bank Of Montreal /can/ | 0 | -100,00 | 0 | -100,00 | ||||
| 2026-02-26 | 13F/A | Alpine Global Management, LLC | Put | 15.118 | 51,18 | 111 | 1.000,00 | |||
| 2026-04-15 | 13F | Signature Estate & Investment Advisors Llc | 15.267 | 0,00 | 11 | -16,67 | ||||
| 2026-02-17 | 13F | Fmr Llc | 36.970 | 389,47 | 30 | 114,29 | ||||
| 2026-01-30 | 13F | Wealthfront Advisers Llc | 131.429 | 1.147,78 | 108 | 463,16 | ||||
| 2026-02-06 | 13F | ProShare Advisors LLC | 70.065 | 456,38 | 57 | 147,83 | ||||
| 2026-02-17 | 13F | Farallon Capital Management Llc | 19.000 | 0,00 | 16 | -57,14 | ||||
| 2026-03-09 | 13F/A | CI Private Wealth, LLC | 23.830 | 0,02 | 20 | -57,78 | ||||
| 2026-04-09 | 13F | Tompkins Financial Corp | 85 | 0,00 | 0 | |||||
| 2026-04-21 | 13F | Chiron Capital Management, Llc | 0 | -100,00 | 0 | |||||
| 2026-02-17 | 13F | XTX Topco Ltd | 0 | -100,00 | 0 | -100,00 | ||||
| 2026-02-11 | 13F | Ameritas Investment Partners, Inc. | 31.122 | 428,21 | 26 | 127,27 | ||||
| 2026-02-17 | 13F | Gotham Asset Management, LLC | 0 | -100,00 | 0 | -100,00 | ||||
| 2026-02-06 | 13F | Pnc Financial Services Group, Inc. | 913 | -59,99 | 1 | -100,00 | ||||
| 2026-02-17 | 13F | Clear Street Markets Llc | Call | 2.900 | 2 | |||||
| 2025-11-06 | 13F | Centerpoint Advisors, LLC | 0 | -100,00 | 0 | |||||
| 2026-02-09 | 13F | Key FInancial Inc | 10 | 0,00 | 0 | |||||
| 2026-02-17 | 13F | Citadel Advisors Llc | Put | 2.262.800 | 402,40 | 1.855 | 117,98 | |||
| 2026-02-17 | 13F | Citadel Advisors Llc | Call | 4.029.800 | 277,25 | 3.304 | 63,73 | |||
| 2026-02-13 | 13F | JustInvest LLC | 11.711 | -19,31 | 10 | -66,67 | ||||
| 2026-02-10 | 13F/A | Northwestern Mutual Wealth Management Co | 3.710 | -2,11 | 3 | -57,14 | ||||
| 2026-02-17 | 13F | SummitTX Capital, L.P. | 16.700 | 14 | ||||||
| 2026-02-17 | 13F | Boothbay Fund Management, Llc | Put | 158.000 | -61,63 | 130 | -83,42 | |||
| 2026-02-17 | 13F | Aristeia Capital Llc | Put | 0 | -100,00 | 0 | ||||
| 2026-02-17 | 13F | Parallax Volatility Advisers, L.P. | Call | 74.100 | 61 | |||||
| 2026-01-16 | 13F | FNY Investment Advisers, LLC | 0 | -100,00 | 0 | |||||
| 2026-02-17 | 13F | Parallax Volatility Advisers, L.P. | Put | 42.000 | 34 | |||||
| 2026-02-17 | 13F | Parallax Volatility Advisers, L.P. | 9.589 | 8 | ||||||
| 2026-01-29 | 13F | Calamos Advisors LLC | 3.400.000 | 2.788 | ||||||
| 2026-02-24 | 13F | Bell Investment Advisors, Inc | 0 | -100,00 | 0 | |||||
| 2026-04-07 | 13F | Farther Finance Advisors, LLC | Call | 28.500 | 18 | |||||
| 2026-02-17 | 13F | Murchinson Ltd. | Put | 327.300 | -61,00 | 268 | -83,10 | |||
| 2026-01-28 | 13F | Geneos Wealth Management Inc. | 0 | -100,00 | 0 | |||||
| 2026-02-17 | 13F | Engineers Gate Manager LP | 336.549 | 1.138,91 | 276 | 439,22 | ||||
| 2026-01-30 | 13F | Catalytic Wealth RIA, LLC | 13.915 | 0,00 | 11 | -57,69 | ||||
| 2026-02-12 | 13F | Federation des caisses Desjardins du Quebec | 7.634 | 183,69 | 6 | 20,00 | ||||
| 2026-02-17 | 13F | Murchinson Ltd. | 105.001 | 86 | ||||||
| 2026-04-08 | 13F | NorthCrest Asset Manangement, LLC | 40.028 | 24 | ||||||
| 2026-02-17 | 13F | AIMZ Investment Advisors, LLC | 10.000 | 8 | ||||||
| 2026-01-21 | 13F | Indiana Trust & Investment Management CO | 75 | 0,00 | 0 | |||||
| 2026-02-11 | 13F | Erste Asset Management GmbH | 85 | 0 | ||||||
| 2026-02-13 | 13F | Mariner, LLC | 18.799 | 15 | ||||||
| 2026-01-15 | 13F | DB Fitzpatrick & Co, Inc | 250 | 0 | ||||||
| 2026-02-17 | 13F | Russell Investments Group, Ltd. | 51.804 | 250,36 | 42 | 55,56 | ||||
| 2025-11-12 | 13F | Pitcairn Co | 0 | -100,00 | 0 | |||||
| 2026-04-07 | 13F | Farther Finance Advisors, LLC | 178.814 | 7,20 | 111 | -19,12 | ||||
| 2026-02-10 | 13F | KERR FINANCIAL PLANNING Corp | 50 | 0 | ||||||
| 2026-02-13 | 13F | Charles Schwab Investment Management Inc | 3.383.511 | 497,02 | 2.774 | 159,01 | ||||
| 2026-02-12 | 13F | Colonial Trust Advisors | 339 | 0 | ||||||
| 2026-02-17 | 13F | Bank Of America Corp /de/ | 2.595.427 | 5.374,54 | 2.128 | 2.291,01 | ||||
| 2026-02-13 | 13F | National Bank Of Canada /fi/ | Put | 56.025 | 514,44 | 4.594 | 166,63 | |||
| 2026-02-17 | 13F | Crawford Fund Management, LLC | Put | 0 | -100,00 | 0 | -100,00 | |||
| 2026-02-17 | 13F | Tower Research Capital LLC (TRC) | 28.986 | 347,11 | 24 | 91,67 | ||||
| 2026-02-13 | 13F | National Bank Of Canada /fi/ | Call | 1.902 | -64,82 | 156 | -84,82 | |||
| 2026-04-13 | 13F | True Wealth Design, LLC | 1.815 | 1 | ||||||
| 2026-02-09 | 13F | Hantz Financial Services, Inc. | 63 | 40,00 | 0 | |||||
| 2026-02-12 | 13F | New York State Common Retirement Fund | 120.900 | 665,19 | 99 | 241,38 | ||||
| 2026-02-12 | 13F | CIBC Private Wealth Group, LLC | 9.266 | 3.436,64 | 8 | |||||
| 2026-02-17 | 13F | Boothbay Fund Management, Llc | 49.760 | 41 | ||||||
| 2025-11-12 | 13F | Simplex Trading, Llc | 0 | -100,00 | 0 | |||||
| 2026-02-13 | 13F | Graney & King, LLC | 45 | 0,00 | 0 | |||||
| 2026-02-13 | 13F | Caitong International Asset Management Co., Ltd | 0 | -100,00 | 0 | |||||
| 2026-01-29 | 13F | UBS Group AG | Put | 0 | -100,00 | 0 | ||||
| 2026-02-18 | 13F | Garton & Associates Financial Advisors LLC | 2.300 | 2 | ||||||
| 2026-02-27 | 13F | Strategic Investment Solutions, Inc. /IL | 50 | 0,00 | 0 | |||||
| 2026-04-21 | 13F | Falcon Wealth Planning | 18.002 | 0,00 | 13 | -14,29 | ||||
| 2026-01-21 | 13F | Sound Income Strategies, LLC | 17 | 0,00 | 0 | |||||
| 2026-02-12 | 13F | Steward Partners Investment Advisory, Llc | 245 | 0,00 | 0 | |||||
| 2026-02-13 | 13F | Van Eck Associates Corp | 115.234 | 586,28 | 0 | |||||
| 2026-02-02 | 13F | Millstone Evans Group, LLC | 1.918 | 0,00 | 2 | -66,67 | ||||
| 2026-02-12 | 13F | Penserra Capital Management LLC | 2.252 | -91,25 | 0 | |||||
| 2026-04-17 | 13F | AdvisorNet Financial, Inc | 615 | 0,00 | 0 | |||||
| 2026-02-17 | 13F | Balyasny Asset Management Llc | 2.485.352 | 2.038 | ||||||
| 2026-02-17 | 13F | Whitebox Advisors Llc | Put | 955.600 | 0,00 | 784 | -56,64 | |||
| 2026-02-17 | 13F | Whitebox Advisors Llc | 855.600 | 702 | ||||||
| 2026-02-13 | 13F | Transamerica Financial Advisors, Inc. | 262 | 0 | ||||||
| 2026-02-17 | 13F | MIRAE ASSET GLOBAL ETFS HOLDINGS Ltd. | 368.707 | 394,32 | 302 | 115,71 | ||||
| 2026-02-11 | 13F | Group One Trading, L.p. | Put | 5.877.700 | 64,58 | 4.820 | -28,60 | |||
| 2026-02-06 | 13F | Larson Financial Group LLC | 5 | 0 | ||||||
| 2026-02-11 | 13F | Group One Trading, L.p. | Call | 4.961.300 | 86,82 | 4.068 | -18,95 | |||
| 2026-02-05 | 13F | Center for Financial Planning, Inc. | 135 | 0,00 | 0 | |||||
| 2026-02-12 | 13F | Groupe la Francaise | 0 | -100,00 | 0 | |||||
| 2026-02-13 | 13F | Morgan Stanley | 3.169.088 | 18,25 | 2.599 | -48,71 | ||||
| 2026-02-12 | 13F | Jane Street Group, Llc | Call | 836.700 | 311,36 | 686 | 78,65 | |||
| 2026-02-12 | 13F | Jane Street Group, Llc | 2.496.750 | 6.347,72 | 2.047 | 2.704,11 | ||||
| 2026-02-12 | 13F | Jane Street Group, Llc | Put | 382.800 | -56,64 | 314 | -81,24 | |||
| 2026-04-13 | 13F | IFP Advisors, Inc | 5.788 | 130,60 | 4 | 100,00 | ||||
| 2026-02-05 | 13F | Td Private Client Wealth Llc | 0 | -100,00 | 0 | -100,00 | ||||
| 2026-02-10 | 13F | Bnp Paribas Arbitrage, Sa | 120.287 | 169,33 | 99 | 16,67 | ||||
| 2026-04-17 | 13F | Murphy & Mullick Capital Management Corp | 200 | 0,00 | 0 | |||||
| 2026-02-05 | 13F | Baader Bank INC | 0 | -100,00 | 0 | -100,00 | ||||
| 2026-01-21 | 13F | SJS Investment Consulting Inc. | 10 | 0,00 | 0 | |||||
| 2026-04-13 | 13F | Mather Group, Llc. | 5 | 0 | ||||||
| 2026-02-11 | 13F | Jpmorgan Chase & Co | 448.938 | 1.294,09 | 368 | 513,33 | ||||
| 2026-04-15 | 13F | Merit Financial Group, LLC | 76.598 | 54 | ||||||
| 2026-02-11 | 13F | Jpmorgan Chase & Co | Call | 58.400 | -91,66 | 48 | -96,45 | |||
| 2026-04-03 | 13F | Investors Research Corp | 50 | 0,00 | 0 | |||||
| 2026-02-11 | 13F | Jpmorgan Chase & Co | Put | 2.500 | 2 | |||||
| 2026-02-13 | 13F | Pinney & Scofield, Inc. | 800 | 0,00 | 1 | -100,00 | ||||
| 2026-02-12 | 13F | Aristides Capital LLC | 186.200 | 153 | ||||||
| 2026-02-13 | 13F | Sterling Capital Management LLC | 20.288 | 334,25 | 17 | 100,00 | ||||
| 2025-10-27 | 13F | Kiker Wealth Management, LLC | 0 | -100,00 | 0 | |||||
| 2025-11-14 | 13F | Dark Forest Capital Management Lp | 31.812 | 0,00 | 111 | 0,00 | ||||
| 2026-02-10 | 13F | Bank of New York Mellon Corp | 942.475 | 282,53 | 773 | 66,02 | ||||
| 2026-02-17 | 13F | Susquehanna Portfolio Strategies, LLC | 0 | -100,00 | 0 | -100,00 | ||||
| 2026-02-02 | 13F | Principal Financial Group Inc | 17.008 | 14 | ||||||
| 2026-02-10 | 13F | Bnp Paribas | 910 | 0,00 | 1 | -100,00 | ||||
| 2026-02-17 | 13F | SageView Advisory Group, LLC | 3 | 0 | ||||||
| 2026-04-15 | 13F | Journey Strategic Wealth Llc | 11.915 | 8 | ||||||
| 2026-01-07 | 13F | Procyon Private Wealth Partners, LLC | 154.432 | 127 | ||||||
| 2026-02-11 | 13F | LPL Financial LLC | 16.992 | -13,00 | 14 | -63,89 | ||||
| 2026-02-12 | 13F | SWAN Capital LLC | 400 | 0,00 | 0 | |||||
| 2026-02-13 | 13F | Centiva Capital, LP | 15.935 | 13 | ||||||
| 2026-02-13 | 13F | Wells Fargo & Company/mn | 431.424 | 640,51 | 354 | 220,91 | ||||
| 2025-11-14 | 13F | D. E. Shaw & Co., Inc. | 0 | -100,00 | 0 | -100,00 | ||||
| 2026-02-13 | 13F | Wells Fargo & Company/mn | Call | 100 | 0 | |||||
| 2026-01-30 | 13F | Torren Management, LLC | 80 | 0 | ||||||
| 2026-02-02 | 13F | Wolverine Asset Management Llc | 0 | -100,00 | 0 | -100,00 | ||||
| 2026-02-11 | 13F | Mirae Asset Securities (usa) Inc. | Put | 995.024 | 2.111,16 | 207 | 143,53 | |||
| 2026-02-11 | 13F | Curio Wealth, Llc | 130 | 0 | ||||||
| 2026-04-14 | 13F | Tradewinds Capital Management, LLC | 20 | 0,00 | 0 | |||||
| 2026-02-17 | 13F | Aqr Capital Management Llc | 484.596 | 776,83 | 397 | 285,44 | ||||
| 2026-04-15 | 13F | QTR Family Wealth, LLC | 13.807 | 10 | ||||||
| 2026-02-04 | 13F | Atlantic Union Bankshares Corp | 35 | -89,86 | 0 | |||||
| 2025-11-14 | 13F | Credit Agricole S A | 0 | -100,00 | 0 | -100,00 | ||||
| 2026-02-05 | 13F | Allworth Financial LP | 0 | -100,00 | 0 | |||||
| 2026-02-13 | 13F | Heritage Wealth Advisors | 23 | 0,00 | 0 | |||||
| 2026-02-17 | 13F | Balyasny Asset Management Llc | Put | 0 | -100,00 | 0 | -100,00 | |||
| 2026-02-12 | 13F | Nuveen, LLC | 168.491 | 0,91 | 138 | -56,19 | ||||
| 2026-01-23 | 13F | Newton One Investments LLC | 10 | 0,00 | 0 | |||||
| 2026-02-17 | 13F | Scarborough Advisors, LLC | 6 | 0,00 | 0 | |||||
| 2025-11-14 | 13F | State Board Of Administration Of Florida Retirement System | 0 | -100,00 | 0 | -100,00 | ||||
| 2026-04-15 | 13F | Fortitude Family Office, LLC | 0 | -100,00 | 0 | |||||
| 2026-04-16 | 13F | Evolve Private Wealth, Llc | 35.488 | 25 | ||||||
| 2026-02-13 | 13F | Verition Fund Management LLC | Call | 14.500 | 12 | |||||
| 2026-02-13 | 13F | Verition Fund Management LLC | 25.190 | 21 | ||||||
| 2026-02-13 | 13F | Verition Fund Management LLC | Put | 233.500 | 191 | |||||
| 2026-02-13 | 13F | Colony Group, LLC | 11.213 | 9 | ||||||
| 2026-01-22 | 13F | Harwood Advisory Group, LLC | 20 | 0,00 | 0 | |||||
| 2026-01-26 | 13F | Private Trust Co Na | 54 | 0,00 | 0 | |||||
| 2026-04-20 | 13F | Ronald Blue Trust, Inc. | 90 | 0,00 | 0 | |||||
| 2026-02-17 | 13F | Tudor Investment Corp Et Al | Call | 67.400 | 55 | |||||
| 2026-01-13 | 13F | Stephens Consulting, LLC | 2.000 | 0,00 | 2 | -66,67 | ||||
| 2026-02-09 | 13F | Geode Capital Management, Llc | 9.927.157 | 445,02 | 8.142 | 136,48 | ||||
| 2026-01-28 | 13F | Loring Wolcott & Coolidge Fiduciary Advisors Llp/ma | 0 | -100,00 | 0 | -100,00 | ||||
| 2026-02-06 | 13F | Global Retirement Partners, LLC | 0 | -100,00 | 0 | -100,00 | ||||
| 2025-11-14 | 13F | Squarepoint Ops LLC | Call | 0 | -100,00 | 0 | -100,00 | |||
| 2026-01-26 | 13F | PayPay Securities Corp | 0 | -100,00 | 0 | -100,00 | ||||
| 2026-02-12 | 13F | Mindset Wealth Management, Llc | 10.900 | 9 | ||||||
| 2026-02-11 | 13F | Mirae Asset Securities (usa) Inc. | 248.756 | 465,70 | 204 | 144,58 | ||||
| 2026-01-15 | 13F | Bernard Wealth Management Corp. | 30 | 0,00 | 0 | |||||
| 2026-02-17 | 13F | DZ BANK AG Deutsche Zentral Genossenschafts Bank, Frankfurt am Main | 24.261 | 47.470,59 | 21 | |||||
| 2026-02-14 | 13F | Rockefeller Capital Management L.P. | 1.000 | 1 | ||||||
| 2026-02-13 | 13F | Natixis | Put | 200.000 | 164 | |||||
| 2025-11-07 | 13F | Beacon Capital Management, LLC | 0 | -100,00 | 0 | -100,00 | ||||
| 2026-02-17 | 13F | Running Point Capital Advisors, LLC | 0 | -100,00 | 0 | -100,00 | ||||
| 2025-10-30 | 13F | Twin Peaks Wealth Advisors, LLC | 0 | -100,00 | 0 | |||||
| 2026-01-27 | 13F | TD Waterhouse Canada Inc. | 18.845 | 2,53 | 16 | -64,29 | ||||
| 2026-02-13 | 13F | Natixis | 200.000 | 164 | ||||||
| 2026-01-20 | 13F | Wall Street Access Asset Management, LLC | 0 | -100,00 | 0 | |||||
| 2026-02-10 | 13F | JTC Employer Solutions Trusteee Ltd | 750 | 0,00 | 0 | |||||
| 2026-02-17 | 13F | Graham Capital Management, L.P. | Put | 0 | -100,00 | 0 | ||||
| 2026-02-10 | 13F | Skaana Management L.P. | Call | 37.600 | 31 | |||||
| 2026-02-09 | 13F | Hartland & Co., LLC | 51 | 0,00 | 0 | |||||
| 2026-02-12 | 13F | Hollencrest Capital Management | 48 | 0,00 | 0 | |||||
| 2026-02-13 | 13F | Victory Capital Management Inc | 49.968 | 41 | ||||||
| 2026-02-10 | 13F | Skaana Management L.P. | Put | 1.520.200 | 469,15 | 1.247 | 147,22 | |||
| 2026-01-27 | 13F | Zurcher Kantonalbank (Zurich Cantonalbank) | 985 | -3,34 | 1 | -100,00 | ||||
| 2026-02-03 | 13F | SBI Securities Co., Ltd. | 158.314 | 57,98 | 130 | -31,75 | ||||
| 2026-02-17 | 13F | Optiver Holding B.V. | 45 | -99,06 | 0 | -100,00 | ||||
| 2026-02-13 | 13F | State Street Corp | 7.934.066 | 120,51 | 6.506 | -4,34 | ||||
| 2026-02-17 | 13F | Mangrove Partners | 261.559 | 214 | ||||||
| 2025-11-05 | 13F | Sherman Asset Management, Inc. | 0 | -100,00 | 0 | |||||
| 2026-02-13 | 13F | Marathon Trading Investment Management LLC | 2.283.940 | 1.873 | ||||||
| 2026-02-13 | 13F | Walleye Trading LLC | Call | 8.300 | -74,46 | 7 | -90,16 | |||
| 2026-02-13 | 13F | Marathon Trading Investment Management LLC | Call | 668.100 | 790,80 | 548 | 287,94 | |||
| 2026-02-13 | 13F | Marathon Trading Investment Management LLC | Put | 105.000 | 86 | |||||
| 2026-01-29 | 13F | Golden State Equity Partners | 20.000 | 0,00 | 16 | -56,76 | ||||
| 2026-02-04 | 13F | Summit Wealth Group Llc / Co | 0 | -100,00 | 0 | -100,00 | ||||
| 2026-02-12 | 13F | Wealthspire Advisors, LLC | 20.015 | 133.333,33 | 16 | |||||
| 2025-11-12 | 13F | Principal Securities, Inc. | 0 | -100,00 | 0 | |||||
| 2026-03-17 | 13F/A | Barclays Plc | Call | 0 | -100,00 | 0 | -100,00 | |||
| 2026-02-10 | 13F | Belvedere Trading LLC | Call | 0 | -100,00 | 0 | ||||
| 2026-02-13 | 13F | Umb Bank N A/mo | 0 | -100,00 | 0 | |||||
| 2026-02-10 | 13F | Belvedere Trading LLC | 0 | -100,00 | 0 | |||||
| 2026-04-20 | 13F | Banque Cantonale Vaudoise | 0 | -100,00 | 0 | |||||
| 2026-02-13 | 13F | Walleye Trading LLC | Put | 15.600 | -65,18 | 13 | -85,71 | |||
| 2026-02-10 | 13F | Belvedere Trading LLC | Put | 0 | -100,00 | 0 | ||||
| 2026-01-29 | 13F | IMC-Chicago, LLC | Put | 1.125.000 | 258,74 | 922 | 55,74 | |||
| 2026-01-29 | 13F | IMC-Chicago, LLC | Call | 2.375.500 | 1.203,79 | 1.948 | 465,99 | |||
| 2026-02-12 | 13F | MetLife Investment Management, LLC | 218.132 | 462,17 | 179 | 143,84 | ||||
| 2026-02-13 | 13F | Pacific Center for Financial Services | 83 | 0,00 | 0 | |||||
| 2026-02-23 | 13F | Virtu Financial LLC | 608.487 | 670,62 | 0 | |||||
| 2026-01-29 | 13F | St. Johns Investment Management Company, LLC | 20 | 0,00 | 0 | |||||
| 2026-02-13 | 13F | Barclays Plc | 657.254 | 117,03 | 539 | -5,94 | ||||
| 2026-02-17 | 13F | Capstone Financial Advisors, Inc. | 10.119 | 8 | ||||||
| 2026-04-14 | 13F | Beacon Investment Advisory Services, Inc. | 14 | 0 | ||||||
| 2026-02-12 | 13F | Hrt Financial Lp | 0 | -100,00 | 0 | |||||
| 2026-02-12 | 13F | Rossby Financial, LCC | 23 | 0,00 | 0 | |||||
| 2026-02-10 | 13F | Savant Capital, LLC | 0 | -100,00 | 0 | -100,00 | ||||
| 2026-02-17 | 13F | Jain Global LLC | 304.793 | 250 | ||||||
| 2026-04-02 | 13F | Byrne Asset Management LLC | 4 | 0,00 | 0 | |||||
| 2026-02-10 | 13F | Root Financial Partners, LLC | 1.333 | 2.797,83 | 1 | |||||
| 2026-02-26 | 13F/A | Alpine Global Management, LLC | 199.997 | 164 | ||||||
| 2026-02-17 | 13F | Wellington Management Group Llp | 863.693 | 708 | ||||||
| 2026-02-10 | 13F | Goldman Sachs Group Inc | Put | 714.600 | -24,78 | 586 | -67,41 | |||
| 2026-02-17 | 13F | Bank Of America Corp /de/ | Put | 0 | -100,00 | 0 | -100,00 | |||
| 2026-02-18 | 13F | GWM Advisors LLC | 12.041 | 2.038,72 | 10 | 800,00 | ||||
| 2026-01-22 | 13F | Apollon Wealth Management, LLC | 0 | -100,00 | 0 | -100,00 | ||||
| 2026-02-17 | 13F | Bank Of America Corp /de/ | Call | 0 | -100,00 | 0 | -100,00 | |||
| 2026-02-13 | 13F | National Bank Of Canada /fi/ | 5.440.966 | 1.407,16 | 4.462 | 554,11 | ||||
| 2026-03-04 | 13F | Leonteq Securities AG | Call | 0 | -100,00 | 0 | -100,00 | |||
| 2026-02-13 | 13F | Kestra Advisory Services, LLC | Call | 0 | -100,00 | 0 | ||||
| 2026-02-13 | 13F | Public Employees Retirement Association Of Colorado | 0 | -100,00 | 0 | |||||
| 2026-02-10 | 13F | Goldman Sachs Group Inc | 1.208.088 | 5,11 | 991 | -54,42 | ||||
| 2026-01-26 | 13F | Asset Dedication, LLC | 0 | -100,00 | 0 | |||||
| 2026-02-17 | 13F | Advisor Group Holdings, Inc. | 334.463 | -21,78 | 274 | -66,21 | ||||
| 2025-11-04 | 13F | Guerra Advisors Inc | 0 | 0 | ||||||
| 2026-02-13 | 13F | Evelyn Partners Investment Management LLP | 85 | 0,00 | 0 | |||||
| 2026-02-17 | 13F | Prelude Capital Management, Llc | 200.000 | 164 | ||||||
| 2026-04-21 | 13F | Pallas Capital Advisors LLC | 153.297 | 108 | ||||||
| 2026-02-13 | 13F | Gmt Capital Corp | 0 | -100,00 | 0 | -100,00 | ||||
| 2026-02-02 | 13F | Fifth Third Bancorp | 150 | 0,00 | 0 | |||||
| 2026-02-11 | 13F | Deutsche Bank Ag\ | 278.515 | 603,96 | 228 | 208,11 | ||||
| 2025-10-28 | 13F | Nbt Bank N A /ny | 0 | -100,00 | 0 | |||||
| 2025-11-14 | 13F | Bridgeway Capital Management Inc | 0 | -100,00 | 0 | -100,00 | ||||
| 2026-01-29 | 13F | UMA Financial Services, Inc. | 50 | 0 | ||||||
| 2026-02-13 | 13F | Banco Santander, S.A. | 57.752 | 338,58 | 47 | 95,83 | ||||
| 2025-11-20 | 13F/A | BRYN MAWR TRUST Co | 0 | -100,00 | 0 | |||||
| 2026-02-13 | 13F | Citigroup Inc | Put | 65.700 | -56,20 | 54 | -81,27 | |||
| 2026-02-09 | 13F | Legal & General Group Plc | 34.357 | 403,10 | 28 | 133,33 | ||||
| 2026-02-17 | 13F | Css Llc/il | Put | 387.300 | 318 | |||||
| 2026-02-13 | 13F | Citigroup Inc | 363.671 | 793,47 | 298 | 292,11 | ||||
| 2026-02-13 | 13F | Citigroup Inc | Call | 134.000 | -60,00 | 110 | -82,78 | |||
| 2026-02-12 | 13F | Cibc World Markets Corp | 25.364 | 21 | ||||||
| 2026-02-17 | 13F | Mpwm Advisory Solutions, Llc | 0 | -100,00 | 0 | |||||
| 2025-11-12 | 13F | Dunhill Financial, LLC | 0 | -100,00 | 0 | |||||
| 2026-02-11 | 13F | Next Capital Management LLC | 0 | -100,00 | 0 | |||||
| 2026-01-07 | 13F | Aventura Private Wealth, LLC | 10 | 0,00 | 0 | |||||
| 2026-02-03 | 13F | McIlrath & Eck, LLC | 0 | -100,00 | 0 | |||||
| 2026-02-11 | 13F | Cerity Partners LLC | 10.682 | -54,61 | 9 | -81,82 | ||||
| 2025-11-13 | 13F | Glenmede Investment Management, LP | 0 | -100,00 | 0 | |||||
| 2026-02-12 | 13F | BlackRock, Inc. | 27.486.268 | 420,12 | 22.539 | 125,67 | ||||
| 2026-02-13 | 13F | Pinnacle Wealth Planning Services, Inc. | 3.976 | 3 | ||||||
| 2026-02-17 | 13F | Jones Financial Companies Lllp | 1.121 | -11,59 | 1 | -100,00 | ||||
| 2026-02-09 | 13F | Huntington National Bank | 1 | -99,91 | 0 | -100,00 | ||||
| 2026-02-17 | 13F | Point72 Asset Management, L.P. | Put | 1.250.000 | -66,83 | 1.025 | -85,61 | |||
| 2026-02-17 | 13F | Millennium Management Llc | Put | 0 | -100,00 | 0 | -100,00 | |||
| 2025-10-27 | 13F | First Horizon Corp | 0 | -100,00 | 0 | -100,00 | ||||
| 2025-11-14 | 13F | MUFG Securities EMEA plc | 0 | -100,00 | 0 | -100,00 | ||||
| 2026-02-06 | 13F/A | Rathbone Brothers plc | 11.949 | 10 | ||||||
| 2026-01-14 | 13F | Spire Wealth Management | 800 | 0,00 | 1 | -100,00 | ||||
| 2026-01-26 | 13F | Cwm, Llc | 17.826 | 172,65 | 0 | |||||
| 2026-02-17 | 13F | Royal Bank Of Canada | Call | 1.000 | 0,00 | 1 | -50,00 | |||
| 2026-02-17 | 13F | Dba Trading, Llc | 671.300 | 550 | ||||||
| 2026-02-17 | 13F | Northern Trust Corp | 2.926.336 | 385,08 | 2.400 | 110,44 | ||||
| 2026-02-17 | 13F | Royal Bank Of Canada | 82.230 | -61,66 | 67 | -83,50 | ||||
| 2026-01-22 | 13F | Bfsg, Llc | 210 | 0,00 | 0 | |||||
| 2026-02-17 | 13F | Millennium Management Llc | 895.918 | 451,47 | 735 | 139,09 | ||||
| 2025-11-07 | 13F | Rothschild Investment Llc | 0 | -100,00 | 0 | |||||
| 2026-02-02 | 13F | Cornerstone Planning Group LLC | 0 | -100,00 | 0 | |||||
| 2026-01-29 | 13F | UBS Group AG | 9.788.528 | 674,69 | 8.027 | 236,10 | ||||
| 2025-10-30 | 13F | Cooksen Wealth, LLC | 0 | -100,00 | 0 | |||||
| 2026-02-05 | 13F | Amalgamated Bank | 12.045 | 460,23 | 0 | |||||
| 2026-02-13 | 13F | Manufacturers Life Insurance Company, The | 0 | -100,00 | 0 | |||||
| 2026-01-27 | 13F | Optas, LLC | 90.426 | -33,91 | 74 | -71,32 | ||||
| 2026-02-11 | 13F | Simplex Trading, Llc | Put | 3.106.300 | 114,08 | 2.547 | 127.250,00 | |||
| 2026-02-06 | 13F | EverSource Wealth Advisors, LLC | 90 | -80,93 | 0 | |||||
| 2026-01-21 | 13F | Westfuller Advisors, LLC | 0 | -100,00 | 0 | |||||
| 2026-02-11 | 13F | Simplex Trading, Llc | Call | 5.835.300 | 745,70 | 4.785 | 478.300,00 | |||
| 2026-02-13 | 13F | Headlands Technologies LLC | 0 | -100,00 | 0 | |||||
| 2026-02-11 | 13F | 111 Capital | 64.368 | 53 | ||||||
| 2026-02-06 | 13F | Covestor Ltd | 20 | -4,76 | 0 | |||||
| 2026-02-17 | 13F | Coatue Management Llc | 0 | -100,00 | 0 | |||||
| 2026-02-11 | 13F | Parallel Advisors, LLC | 9 | -55,00 | 0 | |||||
| 2026-02-13 | 13F | DeepCurrents Investment Group LLC | Put | 0 | -100,00 | 0 | ||||
| 2026-02-17 | 13F | Scientech Research LLC | 11.594 | -90,97 | 10 | -96,28 | ||||
| 2026-02-17 | 13F | Atom Investors LP | 655.779 | 669,31 | 538 | 233,54 | ||||
| 2026-01-21 | 13F | Newbridge Financial Services Group, Inc. | 673 | -33,30 | 1 | -100,00 | ||||
| 2026-02-13 | 13F | Baird Financial Group, Inc. | 200.025 | 164 |