Grundlæggende statistik
| Institutionelle ejere | 275 total, 275 long only, 0 short only, 0 long/short - change of 6,56% MRQ |
| Gennemsnitlig porteføljeallokering | 0.4892 % - change of 13,02% MRQ |
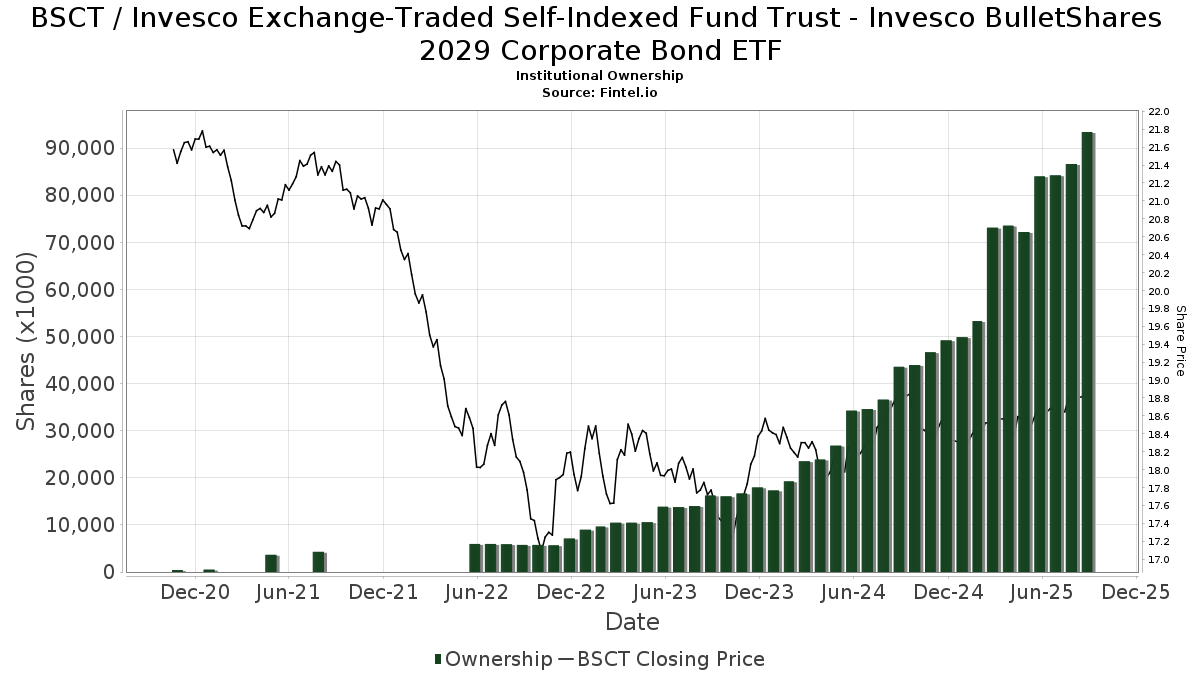
| Institutionelle aktier (lange) | 93.404.648 (ex 13D/G) - change of 10,37MM shares 12,49% MRQ |
| Institutionel værdi (lang) | $ 1.651.565 USD ($1000) |
Institutionelt ejerskab og aktionærer
Invesco Exchange-Traded Self-Indexed Fund Trust - Invesco BulletShares 2029 Corporate Bond ETF (US:BSCT) har 275 institutionelle ejere og aktionærer, der har indsendt 13D/G- eller 13F-formularer til Securities Exchange Commission (SEC). Disse institutioner har i alt 93,404,648 aktier. Største aktionærer omfatter Morgan Stanley, Lido Advisors, LLC, Raymond James Financial Inc, Wells Fargo & Company/mn, LPL Financial LLC, Aptus Capital Advisors, LLC, Hartland & Co., LLC, DRSK - Aptus Defined Risk ETF, Nelson, Van Denburg & Campbell Wealth Management Group, LLC, and Invesco Ltd. .
Invesco Exchange-Traded Self-Indexed Fund Trust - Invesco BulletShares 2029 Corporate Bond ETF (NasdaqGM:BSCT) institutionel ejerskabsstruktur viser aktuelle positioner i virksomheden efter institutioner og fonde, samt seneste ændringer i positionsstørrelse. Større aktionærer kan omfatte individuelle investorer, investeringsforeninger, hedgefonde eller institutioner. Skema 13D angiver, at investoren besidder (eller besidder) mere end 5 % af virksomheden og har til hensigt (eller har til hensigt at) aktivt at forfølge en ændring i forretningsstrategi. Skema 13G indikerer en passiv investering på over 5%.
The share price as of September 15, 2025 is 18,94 / share. Previously, on September 16, 2024, the share price was 18,92 / share. This represents an increase of 0,11% over that period.
Fondens stemningsscore
Fund Sentiment Score (fka Ownership Accumulation Score) finder de aktier, der bliver mest købt af fonde. Det er resultatet af en sofistikeret, multi-faktor kvantitativ model, der identificerer virksomheder med de højeste niveauer af institutionel akkumulering. Scoringsmodellen bruger en kombination af den samlede stigning i oplyste ejere, ændringerne i porteføljeallokeringer i disse ejere og andre målinger. Tallet går fra 0 til 100, hvor højere tal indikerer et højere niveau af akkumulering for sine jævnaldrende, og 50 er gennemsnittet.
Opdateringsfrekvens: Dagligt
Se Ownership Explorer, som giver en liste over højest rangerende virksomheder.
Institutionel Put/Call-forhold
Ud over at indberette standardaktie- og gældsudstedelser skal institutter med mere end 100 mill. aktiver under forvaltning også oplyse deres put- og call-optionsbeholdninger. Da salgsoptioner generelt indikerer negativ stemning, og købsoptioner indikerer positiv stemning, kan vi få en fornemmelse af den overordnede institutionelle stemning ved at plotte forholdet mellem put og kald. Diagrammet til højre viser det historiske put/call-forhold for dette instrument.
Brug af Put/Call Ratio som en indikator for investorernes stemning overvinder en af de vigtigste mangler ved at bruge totalt institutionelt ejerskab, som er, at en betydelig mængde af aktiver under forvaltning investeres passivt for at spore indekser. Passivt forvaltede fonde køber typisk ikke optioner, så indikatoren for put/call-forholdet følger mere nøje følelsen af aktivt forvaltede fonde.
13F og NPORT arkivering
Detaljer om 13F-arkivering er gratis. Detaljer om NP-ansøgninger kræver et premium-medlemskab. Grønne rækker angiver nye positioner. Røde rækker angiver lukkede positioner. Klik på linket ikon for at se den fulde transaktionshistorik.
Opgrader
for at låse premium-data op og eksportere til Excel ![]() .
.
| Fil dato | Kilde | Investor | Type | Gennemsnitlig pris (Øst) |
Aktier | Δ Aktier (%) |
Rapporteret Værdi ($1000) |
Δ Værdi (%) |
Port Alloc (%) |
|
|---|---|---|---|---|---|---|---|---|---|---|
| 2025-07-14 | 13F | CRA Financial Services, LLC | 61.883 | 3,34 | 1.157 | 4,33 | ||||
| 2025-07-24 | 13F | Eastern Bank | 17.049 | -81,06 | 319 | -80,94 | ||||
| 2025-08-06 | 13F | Prospera Financial Services Inc | 141.132 | 5,12 | 2.639 | 6,11 | ||||
| 2025-08-13 | 13F | Colonial Trust Co / SC | 152.255 | 20,43 | 2.847 | 21,56 | ||||
| 2025-07-23 | 13F | Opulen Financial Group LLC | 133.979 | 3,47 | 2.505 | 4,42 | ||||
| 2025-05-09 | 13F | Delta Financial Group, Inc. | 20.014 | 0 | ||||||
| 2025-07-09 | 13F | Central Valley Advisors, Llc | 505.652 | 6,14 | 9.456 | 7,11 | ||||
| 2025-08-13 | 13F | VestGen Advisors, LLC | 261.888 | 16,76 | 4.918 | 18,33 | ||||
| 2025-08-12 | 13F | Proequities, Inc. | 0 | 0 | ||||||
| 2025-03-27 | NP | RLGAX - RiverFront Asset Allocation Growth & Income Investor Shares | 16.718 | -58,27 | 307 | -58,34 | ||||
| 2025-08-07 | 13F | Davis R M Inc | 598.956 | 18,03 | 11.200 | 19,12 | ||||
| 2025-07-28 | 13F | Harbour Investments, Inc. | 42.292 | 1,46 | 791 | 2,33 | ||||
| 2025-03-17 | 13F | Members Wealth Llc | 0 | -100,00 | 0 | -100,00 | ||||
| 2025-07-16 | 13F | Old Port Advisors | 82.021 | 491,78 | 1.534 | 498,83 | ||||
| 2025-08-14 | 13F | Integrated Wealth Concepts LLC | 89.116 | 29,91 | 1.666 | 31,08 | ||||
| 2025-07-31 | 13F | Carrera Capital Advisors | 466.888 | 8.731 | ||||||
| 2025-08-05 | 13F | Pacific Wealth Strategies Group, Inc. | 18.863 | 352 | ||||||
| 2025-08-12 | 13F | RiverFront Investment Group, LLC | 1.128.016 | 11,17 | 21.094 | 12,18 | ||||
| 2025-08-12 | 13F | Fca Corp /tx | 40.198 | 752 | ||||||
| 2025-04-14 | 13F | McCarthy & Cox | 0 | -100,00 | 0 | -100,00 | ||||
| 2025-05-08 | 13F | Savant Capital, LLC | 0 | -100,00 | 0 | |||||
| 2025-07-10 | 13F | Secure Asset Management, LLC | 0 | -100,00 | 0 | |||||
| 2025-07-25 | 13F | Community Bank, N.A. | 380 | 0,00 | 7 | 0,00 | ||||
| 2025-07-29 | 13F | Wingate Wealth Advisors, Inc. | 61.842 | 0,82 | 1.156 | 1,76 | ||||
| 2025-08-11 | 13F | Aptus Capital Advisors, LLC | 3.228.386 | 5,87 | 60.371 | 6,84 | ||||
| 2025-08-14 | 13F | Vista Investment Management | 28.086 | 28,12 | 525 | 29,31 | ||||
| 2025-08-01 | 13F | Redmond Asset Management, LLC | 19.664 | 24,50 | 368 | 25,68 | ||||
| 2025-08-14 | 13F | Wiley Bros.-aintree Capital, Llc | 86.222 | 163,89 | 1.612 | 169,57 | ||||
| 2025-04-23 | 13F | Field & Main Bank | 0 | -100,00 | 0 | |||||
| 2025-08-06 | 13F | Aspect Partners, LLC | 1.056 | 0,00 | 20 | 0,00 | ||||
| 2025-07-21 | 13F | Ameritas Advisory Services, LLC | 851 | 16 | ||||||
| 2025-08-07 | 13F | Kestra Private Wealth Services, Llc | 69.276 | 47,92 | 1.295 | 49,37 | ||||
| 2025-07-29 | 13F | Manchester Financial Inc | 2.294.041 | 42.899 | ||||||
| 2025-08-11 | 13F | Cordatus Wealth Management LLC | 27.449 | 14,81 | 1 | |||||
| 2025-08-12 | 13F | Allen Capital Group, LLC | 31.456 | 7,92 | 588 | 8,89 | ||||
| 2025-08-12 | 13F | Kohmann Bosshard Financial Services, LLC | 63.610 | 0,11 | 1.190 | 1,02 | ||||
| 2025-09-04 | 13F/A | Advisor Group Holdings, Inc. | 947.264 | 6,36 | 17.714 | 7,33 | ||||
| 2025-08-05 | 13F | Ellevest, Inc. | 122.770 | 1,73 | 2.296 | 2,64 | ||||
| 2025-08-19 | 13F | Asset Dedication, LLC | 513.953 | 3,71 | 9.611 | 4,65 | ||||
| 2025-08-01 | 13F | Envestnet Asset Management Inc | 1.721.701 | 0,54 | 32.196 | 1,46 | ||||
| 2025-07-28 | 13F | Tlwm | 21.398 | -21,20 | 400 | -20,48 | ||||
| 2025-07-11 | 13F | Farther Finance Advisors, LLC | 10.434 | 1.986,80 | 195 | 2.066,67 | ||||
| 2025-07-22 | 13F | Marietta Wealth Management, LLC | 341.689 | 2,04 | 6.390 | 2,98 | ||||
| 2025-07-23 | 13F | Roundview Capital LLC | 25.349 | 0,00 | 474 | 1,07 | ||||
| 2025-07-17 | 13F | Janney Montgomery Scott LLC | 894.864 | -9,51 | 17 | -11,11 | ||||
| 2025-08-08 | 13F | Cetera Investment Advisers | 314.164 | 13,65 | 5.875 | 14,68 | ||||
| 2025-08-14 | 13F | Warren Averett Asset Management, LLC | 22.584 | 3,36 | 422 | 4,46 | ||||
| 2025-08-13 | 13F | Baird Financial Group, Inc. | 804.685 | 6,81 | 15.048 | 7,79 | ||||
| 2025-08-12 | 13F | O'shaughnessy Asset Management, Llc | 1.952 | 37 | ||||||
| 2025-08-01 | 13F | Rossby Financial, LCC | 627 | 0,00 | 12 | 0,00 | ||||
| 2025-07-15 | 13F | Accurate Wealth Management, LLC | 28.234 | 527 | ||||||
| 2025-08-11 | 13F | HighTower Advisors, LLC | 47.464 | 7,43 | 888 | 8,44 | ||||
| 2025-07-08 | 13F | Everpar Advisors Llc | 29.295 | 68,15 | 548 | 69,88 | ||||
| 2025-08-15 | 13F | Kestra Advisory Services, LLC | 161.881 | 6,41 | 3.027 | 7,42 | ||||
| 2025-08-08 | 13F | Smithfield Trust Co | 1.133 | -6,29 | 0 | |||||
| 2025-07-21 | 13F | Empirical Financial Services, LLC d.b.a. Empirical Wealth Management | 177.772 | 3,34 | 3.324 | 4,30 | ||||
| 2025-08-14 | 13F | Ameriprise Financial Inc | 352.780 | 40,21 | 6.597 | 41,45 | ||||
| 2025-08-05 | 13F | Hills Bank & Trust Co | 2.143.374 | 2,78 | 40.081 | 3,72 | ||||
| 2025-07-09 | 13F | Dynamic Advisor Solutions LLC | 12.431 | 1,18 | 232 | 2,20 | ||||
| 2025-07-30 | 13F/A | Old Point Trust & Financial Services N A | 17.088 | 92,80 | 320 | 94,51 | ||||
| 2025-07-29 | 13F | Semitam Bonam Llc | 84.803 | 1.586 | ||||||
| 2025-08-12 | 13F | Jpmorgan Chase & Co | 268.490 | 200,38 | 5.021 | 203,14 | ||||
| 2025-07-31 | 13F | Darden Wealth Group Inc | 11.000 | 206 | ||||||
| 2025-08-12 | 13F | Wayfinding Financial, LLC | 0 | -100,00 | 0 | |||||
| 2025-07-15 | 13F | Marquette Asset Management, LLC | 4.240 | 0,00 | 79 | 1,28 | ||||
| 2025-07-10 | 13F | Strathmore Capital Advisors, Inc. | 10.000 | 187 | ||||||
| 2025-08-14 | 13F | Old Mission Capital Llc | 0 | -100,00 | 0 | |||||
| 2025-07-23 | 13F | Ironwood Financial, llc | 131.354 | 0,00 | 2.434 | 0,00 | ||||
| 2025-08-14 | 13F | Comerica Bank | 39.660 | -20,52 | 742 | -19,81 | ||||
| 2025-08-13 | 13F | Congress Wealth Management LLC / DE / | 40.186 | 0,35 | 752 | 1,49 | ||||
| 2025-07-31 | 13F | Topsail Wealth Management, LLC | 1.500 | 0,00 | 28 | 3,70 | ||||
| 2025-08-08 | 13F | IMA Wealth, Inc. | 1.126.366 | 5,63 | 21.063 | 6,60 | ||||
| 2025-08-12 | 13F | J.w. Cole Advisors, Inc. | 66.560 | 7,75 | 1.245 | 8,74 | ||||
| 2025-07-16 | 13F | Tassel Capital Management, Inc. | 14.912 | 1,18 | 279 | 1,83 | ||||
| 2025-08-13 | 13F | Farnam Financial LLC | 189.347 | 31,06 | 3.541 | 32,24 | ||||
| 2025-08-05 | 13F | American Institute for Advanced Investment Management, LLP | 20.845 | 0,00 | 390 | 0,78 | ||||
| 2025-08-14 | 13F | LaSalle St. Investment Advisors, LLC | 17.329 | 0,00 | 0 | |||||
| 2025-07-17 | 13F | HB Wealth Management, LLC | 33.910 | 2,41 | 634 | 3,43 | ||||
| 2025-07-31 | 13F | Optimum Investment Advisors | 3.300 | 62 | ||||||
| 2025-08-13 | 13F | Capital Analysts, Inc. | 46.029 | 2,50 | 1 | |||||
| 2025-07-23 | 13F | True Vision MN LLC | 104.823 | -4,48 | 1.960 | -3,59 | ||||
| 2025-07-28 | 13F | Cypress Wealth Services, LLC | 46.763 | -1,65 | 874 | -0,79 | ||||
| 2025-08-04 | 13F | Atria Investments Llc | 177.031 | 3,41 | 3.310 | 4,35 | ||||
| 2025-08-14 | 13F | Financial Advisory Service, Inc. | 5.824 | 1,18 | 109 | 1,89 | ||||
| 2025-07-10 | 13F | Redhawk Wealth Advisors, Inc. | 21.629 | -3,08 | 404 | -2,18 | ||||
| 2025-07-11 | 13F | Matthew Goff Investment Advisor, LLC | 108.267 | -4,23 | 2.025 | -3,34 | ||||
| 2025-08-05 | 13F | Code Waechter LLC | 0 | -100,00 | 0 | |||||
| 2025-07-01 | 13F | Harbor Investment Advisory, Llc | 1.825 | 0,00 | 34 | 3,03 | ||||
| 2025-07-18 | 13F | SMI Advisory Services, LLC | 0 | -100,00 | 0 | |||||
| 2025-08-14 | 13F | CIBC World Markets Inc. | 0 | -100,00 | 0 | |||||
| 2025-08-05 | 13F | Summit Investment Advisory Services, LLC | 23.516 | 440 | ||||||
| 2025-08-06 | 13F | Atlantic Union Bankshares Corp | 1.071.144 | 8,59 | 20.029 | 9,58 | ||||
| 2025-07-23 | 13F | Sax Wealth Advisors, Llc | 36.162 | 41,63 | 676 | 42,92 | ||||
| 2025-04-11 | 13F | Davis Capital Management | 6.649 | 1,78 | 123 | 3,36 | ||||
| 2025-07-15 | 13F | SJS Investment Consulting Inc. | 3.499 | 0,00 | 65 | 1,56 | ||||
| 2025-07-23 | 13F | BankPlus Trust Department | 2.550 | 48 | ||||||
| 2025-07-24 | 13F | IFP Advisors, Inc | 2.550 | 175,68 | 48 | 176,47 | ||||
| 2025-08-06 | 13F | SOUTH STATE Corp | 62 | 1 | ||||||
| 2025-08-11 | 13F | Principal Securities, Inc. | 19.196 | 36,69 | 359 | 39,30 | ||||
| 2025-07-17 | 13F | Nelson, Van Denburg & Campbell Wealth Management Group, LLC | 2.591.993 | -0,24 | 48.470 | 0,68 | ||||
| 2025-07-30 | 13F | Cookson Peirce & Co Inc | 535.638 | 0,71 | 10.016 | 1,63 | ||||
| 2025-08-08 | 13F | Creative Planning | 57.000 | -10,33 | 1.066 | -9,52 | ||||
| 2025-08-12 | 13F | Heritage Trust Co | 63.447 | 33,19 | 1.186 | 34,47 | ||||
| 2025-08-13 | 13F | Brown Advisory Inc | 16.220 | 303 | ||||||
| 2025-08-18 | 13F | Tyler-Stone Wealth Management | 37.000 | 0,00 | 692 | 0,88 | ||||
| 2025-07-07 | 13F | Horizons Wealth Management | 211.584 | -0,05 | 3.957 | 0,87 | ||||
| 2025-08-14 | 13F | GWM Advisors LLC | 631.184 | 28,91 | 11.803 | 30,10 | ||||
| 2025-07-07 | 13F | Vishria Bird Financial Group, LLC | 447.051 | -0,97 | 8.360 | -0,07 | ||||
| 2025-07-08 | 13F | Nbc Securities, Inc. | 697 | 0 | ||||||
| 2025-08-13 | 13F | Jones Financial Companies Lllp | 283.662 | 40,12 | 5.297 | 41,22 | ||||
| 2025-08-08 | 13F | Advisors Capital Management, LLC | 376.773 | 0,41 | 7.046 | 1,32 | ||||
| 2025-07-14 | 13F | GAMMA Investing LLC | 1.004 | 83,88 | 19 | 80,00 | ||||
| 2025-08-04 | 13F | ArborFi Advisors, LLC | 74.459 | 1,91 | 1.392 | 2,88 | ||||
| 2025-05-12 | 13F | Independent Advisor Alliance | 0 | -100,00 | 0 | |||||
| 2025-08-12 | 13F | Ameritas Investment Partners, Inc. | 333 | -53,03 | 6 | -53,85 | ||||
| 2025-07-29 | 13F | Stephens Inc /ar/ | 143.793 | 1,23 | 2.689 | 2,17 | ||||
| 2025-08-11 | 13F | Nations Financial Group Inc, /ia/ /adv | 10.850 | 0,11 | 203 | 1,00 | ||||
| 2025-08-06 | 13F | Summit Investment Advisors, Inc. | 23.980 | 4,98 | 450 | 6,15 | ||||
| 2025-08-04 | 13F | AlphaStar Capital Management, LLC | 117.050 | 9,40 | 2.189 | 10,39 | ||||
| 2025-08-13 | 13F | River Wealth Advisors LLC | 72.423 | 15,54 | 1.354 | 16,62 | ||||
| 2025-08-08 | 13F | Foundations Investment Advisors, LLC | 31.805 | 0,39 | 595 | 1,19 | ||||
| 2025-08-05 | 13F | Blue Barn Wealth, LLC | 65.601 | 13,76 | 1.227 | 14,79 | ||||
| 2025-08-12 | 13F | Global Retirement Partners, LLC | 668 | 0,00 | 12 | 0,00 | ||||
| 2025-08-08 | 13F | Larson Financial Group LLC | 15.471 | -9,25 | 289 | -8,25 | ||||
| 2025-07-17 | 13F | DiNuzzo Private Wealth, Inc. | 343 | 0,00 | 6 | 0,00 | ||||
| 2025-07-31 | 13F | Insight Wealth Partners, LLC | 28.100 | 8,37 | 525 | 9,38 | ||||
| 2025-08-26 | 13F/A | Thrivent Financial For Lutherans | 507.641 | 9 | ||||||
| 2025-07-17 | 13F | Sound Income Strategies, LLC | 157 | -73,92 | 3 | -81,82 | ||||
| 2025-07-15 | 13F | BCS Wealth Management | 265.130 | 10,23 | 5 | 0,00 | ||||
| 2025-07-22 | 13F | Kickstand Ventures, Llc. | 372.654 | 5,06 | 6.969 | 6,03 | ||||
| 2025-08-11 | 13F | Private Advisor Group, LLC | 215.220 | -19,53 | 4.025 | -18,79 | ||||
| 2025-07-22 | 13F | Comprehensive Financial Consultants Institutional, Inc. | 12.208 | 0,00 | 228 | 0,88 | ||||
| 2025-08-08 | 13F | Sawgrass Asset Management Llc | 79.928 | -5,50 | 1.495 | -4,66 | ||||
| 2025-07-22 | 13F | Duncan Williams Asset Management, LLC | 372.654 | 6.969 | ||||||
| 2025-08-07 | 13F | Meridian Financial Partners LLC | 18.915 | 0,00 | 0 | |||||
| 2025-03-25 | 13F | Higgins & Schmidt Wealth Strategies LLC | 0 | -100,00 | 0 | -100,00 | ||||
| 2025-08-08 | 13F | Hartland & Co., LLC | 2.979.683 | 2,25 | 55.720 | 3,19 | ||||
| 2025-07-24 | 13F | Coordinated Financial Services, Inc. | 31.279 | 85,41 | 585 | 89,00 | ||||
| 2025-07-29 | 13F | Novare Capital Management Llc | 185.446 | 6,82 | 3.468 | 7,80 | ||||
| 2025-07-17 | 13F | Independence Bank of Kentucky | 57.260 | 1,69 | 1.071 | 2,59 | ||||
| 2025-05-12 | 13F | Aveo Capital Partners, LLC | 0 | -100,00 | 0 | |||||
| 2025-07-08 | 13F | Dover Advisors, Llc | 11.929 | -9,31 | 223 | -8,23 | ||||
| 2025-07-15 | 13F | Unified Investment Management | 59.620 | 0,25 | 1.115 | 1,18 | ||||
| 2025-05-16 | 13F | Coordinated Financial Services, Inc./CO | 25.171 | 466 | ||||||
| 2025-08-01 | 13F | Capital Investment Counsel, LLC | 1.075.510 | -2,23 | 20.112 | -1,33 | ||||
| 2025-08-15 | 13F | Equitable Holdings, Inc. | 149.695 | 4,59 | 2.799 | 5,54 | ||||
| 2025-08-12 | 13F | Laurel Wealth Advisors LLC | 803.091 | 1.799,68 | 43 | -94,64 | ||||
| 2025-08-07 | 13F | Addison Advisors LLC | 251.683 | 6,64 | 4.706 | 7,61 | ||||
| 2025-07-09 | 13F | Sarver Vrooman Wealth Advisors | 3.394 | 0,00 | 63 | 1,61 | ||||
| 2025-08-25 | 13F | Silverlake Wealth Management Llc | 62.635 | 3,00 | 1.171 | 4,00 | ||||
| 2025-08-06 | 13F/A | Headland Capital, LLC | 895.534 | 3,60 | 16.747 | 4,55 | ||||
| 2025-07-08 | 13F | Apella Capital, LLC | 46.038 | -1,45 | 858 | -0,58 | ||||
| 2025-07-14 | 13F | AdvisorNet Financial, Inc | 2.924 | 0,00 | 55 | 0,00 | ||||
| 2025-07-16 | 13F | Kathmere Capital Management, LLC | 340.868 | -6,02 | 6.374 | -5,16 | ||||
| 2025-07-25 | 13F | Bill Few Associates, Inc. | 11.600 | 217 | ||||||
| 2025-07-29 | 13F | Private Trust Co Na | 4.127 | 0,00 | 77 | 1,32 | ||||
| 2025-08-14 | 13F | UBS Group AG | 1.948.130 | 10,02 | 36.430 | 11,03 | ||||
| 2025-08-01 | 13F | Motley Fool Wealth Management, LLC | 639.859 | -9,69 | 11.965 | -8,86 | ||||
| 2025-08-13 | 13F | Lido Advisors, LLC | 6.031.301 | 3,52 | 112.785 | 4,47 | ||||
| 2025-07-31 | 13F | Carnegie Capital Asset Management, LLC | 236.260 | 5,20 | 4.418 | 7,21 | ||||
| 2025-08-08 | 13F | Flaharty Asset Management, LLC | 0 | -100,00 | 0 | |||||
| 2025-07-11 | 13F | Pinnacle Bancorp, Inc. | 16.628 | 51,76 | 311 | 52,71 | ||||
| 2025-08-08 | 13F | Avantax Advisory Services, Inc. | 114.966 | -0,07 | 2.150 | 0,84 | ||||
| 2025-07-25 | 13F | Cwm, Llc | 573.769 | 0,62 | 11 | 0,00 | ||||
| 2025-07-17 | 13F | Hengehold Capital Management Llc | 15.039 | 28,32 | 281 | 29,49 | ||||
| 2025-07-01 | 13F | Legacy Wealth Management, LLC / MS | 109.919 | -23,60 | 2.055 | -22,92 | ||||
| 2025-08-01 | 13F | Bessemer Group Inc | 0 | -100,00 | 0 | |||||
| 2025-07-22 | 13F | Net Worth Advisory Group | 16.387 | 45,80 | 306 | 47,12 | ||||
| 2025-08-11 | 13F | Mindset Wealth Management, Llc | 10.070 | 188 | ||||||
| 2025-08-11 | 13F | Goodman Financial Corp | 20.984 | 13,01 | 392 | 13,95 | ||||
| 2025-07-14 | 13F | Oliver Luxxe Assets LLC | 116.012 | 5,21 | 2.169 | 6,17 | ||||
| 2025-07-29 | 13F | Angeles Wealth Management, Llc | 2.087 | 39 | ||||||
| 2025-08-14 | 13F | Royal Bank Of Canada | 1.822.235 | 11,61 | 34.076 | 12,63 | ||||
| 2025-08-15 | 13F | Morgan Stanley | 6.516.929 | 5,61 | 121.867 | 6,58 | ||||
| 2025-07-08 | 13F | Red Spruce Capital, LLC | 187.893 | -2,27 | 3.514 | -1,38 | ||||
| 2025-08-06 | 13F | Commonwealth Equity Services, Llc | 346.456 | -3,39 | 6 | 0,00 | ||||
| 2025-08-11 | 13F | Aspen Investment Management Inc | 149.170 | 3 | ||||||
| 2025-04-15 | 13F | Chris Bulman Inc | 0 | -100,00 | 0 | |||||
| 2025-08-07 | 13F | Hennion & Walsh Asset Management, Inc. | 20.386 | 56,55 | 381 | 58,09 | ||||
| 2025-04-01 | 13F | Cornerstone Planning, LLC | 95.613 | 1.754 | ||||||
| 2025-07-25 | 13F | We Are One Seven, LLC | 137.713 | 37,25 | 2.575 | 38,52 | ||||
| 2025-07-16 | 13F | Kirr Marbach & Co Llc /in/ | 382.662 | 12,95 | 7.156 | 13,99 | ||||
| 2025-06-27 | NP | DRSK - Aptus Defined Risk ETF | 2.926.194 | 9,52 | 54.398 | 10,77 | ||||
| 2025-07-24 | 13F | First Fiduciary Investment Counsel, Inc. | 17.550 | 50,77 | 0 | |||||
| 2025-08-14 | 13F | Wilkins Miller Wealth Management, LLC | 280.049 | 1,91 | 5.237 | 2,85 | ||||
| 2025-08-11 | 13F | Western Wealth Management, LLC | 18.900 | 0,00 | 353 | 0,86 | ||||
| 2025-07-17 | 13F/A | Capital Investment Advisors, LLC | 18.804 | -4,15 | 352 | -3,31 | ||||
| 2025-08-15 | 13F | Nikulski Financial, Inc. | 10.355 | 194 | ||||||
| 2025-08-18 | 13F | Geneos Wealth Management Inc. | 227.701 | 65,65 | 4.258 | 67,14 | ||||
| 2025-07-11 | 13F | First PREMIER Bank | 220 | 0,00 | 0 | |||||
| 2025-07-24 | 13F | Reuter James Wealth Management, Llc | 55.425 | 164,07 | 1.036 | 167,01 | ||||
| 2025-08-12 | 13F | YANKCOM Partnership | 14.784 | 16,56 | 276 | 17,45 | ||||
| 2025-07-18 | 13F | Truist Financial Corp | 78.589 | -29,78 | 1.470 | -29,14 | ||||
| 2025-08-13 | 13F | GeoWealth Management, LLC | 9.325 | 174 | ||||||
| 2025-05-14 | 13F | Monterey Private Wealth, Inc. | 28.171 | 69,03 | 522 | 71,15 | ||||
| 2025-07-21 | 13F | Crews Bank & Trust | 14.400 | 11,63 | 269 | 12,55 | ||||
| 2025-07-11 | 13F | AA Financial Advisors, LLC | 490.584 | 14,97 | 9.174 | 16,03 | ||||
| 2025-07-28 | 13F | Morris Financial Concepts, Inc. | 10.605 | 0,00 | 198 | 1,02 | ||||
| 2025-07-30 | 13F | Brookstone Capital Management | 1.244.446 | -4,67 | 23.271 | -3,79 | ||||
| 2025-08-07 | 13F | Allworth Financial LP | 33.332 | 0,00 | 623 | 1,30 | ||||
| 2025-08-14 | 13F | Jane Street Group, Llc | 127.190 | -72,45 | 2.378 | -72,20 | ||||
| 2025-08-14 | 13F | TCG Advisory Services, LLC | 378.395 | 0,68 | 7.076 | 1,59 | ||||
| 2025-08-05 | 13F | Sensible Money, LLC | 14.786 | 0,09 | 277 | 1,10 | ||||
| 2025-07-22 | 13F | Legacy CG, LLC | 136.870 | -1,74 | 2.559 | -0,85 | ||||
| 2025-08-14 | 13F | Schwallier Wealth Management LLC | 0 | -100,00 | 0 | -100,00 | ||||
| 2025-08-06 | 13F | First Horizon Advisors, Inc. | 23.973 | 0,84 | 448 | 1,82 | ||||
| 2025-08-14 | 13F | Wells Fargo & Company/mn | 3.646.139 | 10,38 | 68.183 | 11,39 | ||||
| 2025-08-05 | 13F | Westside Investment Management, Inc. | 6.208 | 0,00 | 116 | 0,87 | ||||
| 2025-07-11 | 13F | Butensky & Cohen Financial Security, Inc | 69.773 | 3,43 | 1.305 | 4,32 | ||||
| 2025-08-01 | 13F | First Command Advisory Services, Inc. | 54.346 | 19,29 | 1.016 | 20,38 | ||||
| 2025-07-14 | 13F | Whitener Capital Management, Inc. | 19.958 | 4,77 | 373 | 5,97 | ||||
| 2025-07-10 | 13F | Wealth Enhancement Advisory Services, Llc | 175.986 | 3,29 | 3.286 | 4,05 | ||||
| 2025-08-12 | 13F | Steward Partners Investment Advisory, Llc | 12.742 | -7,47 | 238 | -6,67 | ||||
| 2025-08-01 | 13F | Koss-Olinger Consulting, LLC | 0 | -100,00 | 0 | |||||
| 2025-07-25 | 13F | G2 Capital Management, Llc / Oh | 83.486 | 1,18 | 1.561 | 2,09 | ||||
| 2025-08-07 | 13F | Montag A & Associates Inc | 4.361 | 52,43 | 82 | 52,83 | ||||
| 2025-08-13 | 13F | RPg Family Wealth Advisory, LLC | 27.500 | 0,00 | 514 | 0,98 | ||||
| 2025-07-22 | 13F | Kessler Investment Group, LLC | 27.992 | 17,23 | 523 | 18,33 | ||||
| 2025-08-13 | 13F | Morton Community Bank | 284.365 | -0,52 | 5.318 | 0,38 | ||||
| 2025-08-14 | 13F | First International Bank of Israel Ltd. | 540.000 | 10.098 | ||||||
| 2025-08-12 | 13F | Hanover Advisors Inc | 46.305 | 6,84 | 866 | 7,72 | ||||
| 2025-08-01 | 13F | Redwood Park Advisors LLC | 0 | -100,00 | 0 | |||||
| 2025-08-07 | 13F | SFE Investment Counsel | 265.220 | 26,40 | 4.960 | 27,58 | ||||
| 2025-07-31 | 13F | Vaughan David Investments Inc/il | 407.698 | 2,52 | 8 | 0,00 | ||||
| 2025-07-25 | 13F | Hobbs Group Advisors, LLC | 46.239 | -15,33 | 865 | -14,62 | ||||
| 2025-08-04 | 13F | Arkadios Wealth Advisors | 34.773 | -1,26 | 650 | -0,31 | ||||
| 2025-08-11 | 13F | Parr Mcknight Wealth Management Group, Llc | 216.348 | 16,87 | 4.046 | 17,93 | ||||
| 2025-07-29 | 13F | Sigma Investment Counselors Inc | 16.573 | 0,00 | 310 | 0,65 | ||||
| 2025-07-08 | 13F | S.E.E.D. Planning Group LLC | 181.617 | 2,41 | 3.396 | 3,35 | ||||
| 2025-07-31 | 13F | Cambridge Investment Research Advisors, Inc. | 138.810 | 35,77 | 3 | 100,00 | ||||
| 2025-08-14 | 13F | Benjamin Edwards Inc | 11.507 | -0,11 | 215 | 0,94 | ||||
| 2025-07-24 | 13F | Vantage Point Financial LLC | 41.207 | 1,46 | 771 | 2,39 | ||||
| 2025-08-15 | 13F | Captrust Financial Advisors | 144.224 | 19,93 | 2.697 | 21,01 | ||||
| 2025-07-31 | 13F | United Community Bank | 5.500 | 0,00 | 103 | 0,99 | ||||
| 2025-08-14 | 13F | Quartz Partners, LLC | 28.878 | -5,36 | 540 | -4,42 | ||||
| 2025-07-22 | 13F | 4Thought Financial Group Inc. | 39.228 | 2,60 | 734 | 3,53 | ||||
| 2025-08-05 | 13F | Key FInancial Inc | 51.013 | 10,30 | 954 | 11,33 | ||||
| 2025-08-01 | 13F | GPM Growth Investors, Inc. | 542.430 | 5,24 | 10.143 | 6,21 | ||||
| 2025-08-14 | 13F | EP Wealth Advisors, Inc. | 42.754 | 0,00 | 800 | 0,88 | ||||
| 2025-08-14 | 13F | Colony Group, LLC | 606.794 | 6,26 | 11.347 | 7,24 | ||||
| 2025-07-29 | 13F | Stratos Wealth Partners, LTD. | 23.401 | -0,81 | 438 | 0,00 | ||||
| 2025-08-14 | 13F | Hrt Financial Lp | 11.259 | -73,55 | 0 | |||||
| 2025-07-15 | 13F | RVW Wealth, LLC | 11.896 | 0,31 | 222 | 1,37 | ||||
| 2025-08-11 | 13F | United Capital Financial Advisers, Llc | 10.875 | 203 | ||||||
| 2025-08-13 | 13F | Flow Traders U.s. Llc | 0 | -100,00 | 0 | |||||
| 2025-07-22 | 13F | DAVENPORT & Co LLC | 14.143 | -0,17 | 264 | 0,76 | ||||
| 2025-05-02 | 13F | Cullen/frost Bankers, Inc. | 0 | -100,00 | 0 | |||||
| 2025-08-14 | 13F | Mariner, LLC | 24.364 | 6,21 | 456 | 7,06 | ||||
| 2025-08-19 | 13F | Anchor Investment Management, LLC | 7.515 | 96,99 | 141 | 100,00 | ||||
| 2025-04-04 | 13F | Legacy Private Trust Co. | 0 | -100,00 | 0 | |||||
| 2025-08-13 | 13F | Northwestern Mutual Wealth Management Co | 66.230 | 91,15 | 1.238 | 92,83 | ||||
| 2025-07-21 | 13F | Segment Wealth Management, LLC | 52.850 | -0,51 | 988 | 0,41 | ||||
| 2025-07-23 | 13F | Evexia Wealth Llc | 143.785 | 12,20 | 2.689 | 13,51 | ||||
| 2025-08-13 | 13F | Colonial Trust Advisors | 265.049 | 8,81 | 4.956 | 9,82 | ||||
| 2025-07-14 | 13F | Infinity Wealth Counsel, LLC | 185.804 | 2,21 | 3.475 | 3,15 | ||||
| 2025-07-29 | 13F | Straight Path Wealth Management | 165.292 | 24,25 | 3.091 | 25,35 | ||||
| 2025-08-01 | 13F | Clark Asset Management, LLC | 679.021 | 18,65 | 12.698 | 19,74 | ||||
| 2025-08-08 | 13F | ProVise Management Group, LLC | 213.244 | 9,10 | 3.988 | 10,11 | ||||
| 2025-08-14 | 13F | Bank Of America Corp /de/ | 2.012.754 | 3,73 | 37.639 | 4,68 | ||||
| 2025-08-14 | 13F | Atomi Financial Group, Inc. | 11.486 | 215 | ||||||
| 2025-08-05 | 13F | Sigma Planning Corp | 73.014 | 9,08 | 1.365 | 10,08 | ||||
| 2025-08-06 | 13F | Souders Financial Advisors | 203.734 | 5,50 | 3.810 | 6,46 | ||||
| 2025-07-29 | 13F | Carmel Capital Partners, LLC | 316.595 | 7,88 | 5.920 | 8,88 | ||||
| 2025-08-14 | 13F | Stifel Financial Corp | 1.243.788 | 3,93 | 23.259 | 4,88 | ||||
| 2025-07-22 | 13F | Berkshire Money Management, Inc. | 2.726 | 51 | ||||||
| 2025-08-14 | 13F | Ancora Advisors, LLC | 16.364 | 0,00 | 306 | 0,99 | ||||
| 2025-08-11 | 13F | Shufro Rose & Co Llc | 571.796 | -1,38 | 10.595 | -1,39 | ||||
| 2025-08-14 | 13F | Redwood Financial Network Corp | 38.962 | 8,67 | 729 | 9,64 | ||||
| 2025-08-14 | 13F | Mml Investors Services, Llc | 679.026 | 12,01 | 13 | 9,09 | ||||
| 2025-08-11 | 13F | Y.D. More Investments Ltd | 2.100 | 0,00 | 39 | 2,63 | ||||
| 2025-07-30 | 13F | Eqis Capital Management, Inc. | 53.301 | -0,81 | 997 | 0,10 | ||||
| 2025-08-11 | 13F | Oder Investment Management, LLC | 22.549 | 1,18 | 422 | 2,18 | ||||
| 2025-08-14 | 13F | Raymond James Financial Inc | 4.403.485 | 9,21 | 82.345 | 10,21 | ||||
| 2025-08-11 | 13F | Howard Wealth Management, Llc | 202.475 | 0,16 | 3.786 | 1,09 | ||||
| 2025-07-31 | 13F | Gill Capital Partners, Llc | 688.453 | 0,87 | 12.874 | 1,80 | ||||
| 2025-07-15 | 13F | World Equity Group, Inc. | 21.648 | 55,99 | 405 | 56,59 | ||||
| 2025-08-05 | 13F | Huntington National Bank | 2.247 | 9,08 | ||||||
| 2025-08-14 | 13F | Mercer Global Advisors Inc /adv | 19.328 | -2,43 | 361 | -1,63 | ||||
| 2025-07-18 | 13F | Ledgewood Wealth Advisors, LLC | 212.861 | 0,64 | 3.980 | 1,56 | ||||
| 2025-07-17 | 13F | Western Financial Corp/CA | 51.160 | -2,32 | 957 | -1,44 | ||||
| 2025-08-08 | 13F | Kingsview Wealth Management, LLC | 33.245 | 0,87 | 622 | 1,80 | ||||
| 2025-08-13 | 13F | Invesco Ltd. | 2.536.166 | 18,47 | 47.426 | 19,56 | ||||
| 2025-08-13 | 13F | MONECO Advisors, LLC | 1.092.507 | 15,02 | 20.430 | 16,07 | ||||
| 2025-07-24 | 13F | Us Bancorp \de\ | 6.963 | 99,11 | 130 | 103,13 | ||||
| 2025-05-22 | 13F | Mattson Financial Services, LLC | 0 | -100,00 | 0 | |||||
| 2025-08-12 | 13F | Goepper Burkhardt LLC | 513.924 | 10,76 | 9.610 | 11,78 | ||||
| 2025-08-12 | 13F | MAI Capital Management | 1.671.357 | 9,59 | 31.254 | 10,60 | ||||
| 2025-07-21 | 13F | Exchange Capital Management, Inc. | 44.830 | -0,38 | 838 | 0,60 | ||||
| 2025-08-14 | 13F | Fmr Llc | 561 | 11,98 | 10 | 11,11 | ||||
| 2025-08-04 | 13F | Spire Wealth Management | 183 | -13,68 | 3 | 0,00 | ||||
| 2025-08-14 | 13F | Certified Advisory Corp | 12.172 | 228 | ||||||
| 2025-08-05 | 13F | Strategic Financial Concepts, LLC | 0 | -100,00 | 0 | |||||
| 2025-07-23 | 13F | Hager Investment Management Services, Llc | 0 | -100,00 | 0 | |||||
| 2025-08-12 | 13F | Gladstone Institutional Advisory LLC | 231.305 | -0,12 | 4.325 | 0,79 | ||||
| 2025-08-13 | 13F | AMJ Financial Wealth Management | 314.822 | -3,66 | 5.887 | -2,77 | ||||
| 2025-08-12 | 13F | LPL Financial LLC | 3.398.644 | -9,40 | 63.555 | -8,57 | ||||
| 2025-08-06 | 13F | AE Wealth Management LLC | 0 | -100,00 | 0 | |||||
| 2025-08-11 | 13F | Pinnacle Financial Group, LLC / IL | 16.758 | 0,22 | 313 | 1,29 | ||||
| 2025-08-14 | 13F | Guardian Wealth Advisors, Llc / Nc | 154.078 | -4,59 | 2.881 | -3,71 | ||||
| 2025-07-28 | 13F | Brown Financial Advisory | 22.730 | 40,34 | 425 | 41,67 | ||||
| 2025-08-06 | 13F | Financial Advisory Corp /ut/ /adv | 132.407 | -4,06 | 2 | 0,00 | ||||
| 2025-08-07 | 13F | Apeiron RIA LLC | 63.814 | 6,01 | 1.193 | 7,00 | ||||
| 2025-09-11 | 13F | Milestones Private Investment Advisors LLC | 119.190 | 2.229 |