Grundlæggende statistik
| Institutionelle aktier (lange) | 235.322.479 - 63,50% (ex 13D/G) - change of -4,39MM shares -1,83% MRQ |
| Institutionel værdi (lang) | $ 1.615.351 USD ($1000) |
Institutionelt ejerskab og aktionærer
Bausch Health Companies Inc. (US:BHC) har 247 institutionelle ejere og aktionærer, der har indsendt 13D/G- eller 13F-formularer til Securities Exchange Commission (SEC). Disse institutioner har i alt 235,322,479 aktier. Største aktionærer omfatter Paulson & Co. Inc., Goldentree Asset Management Lp, Vanguard Group Inc, Royal Bank Of Canada, Nomura Holdings Inc, Healthcare Of Ontario Pension Plan Trust Fund, MFN Partners Management, LP, National Bank Of Canada /fi/, Kohlberg Kravis Roberts & Co. L.P., and Goldman Sachs Group Inc .
Bausch Health Companies Inc. (NYSE:BHC) institutionel ejerskabsstruktur viser aktuelle positioner i virksomheden efter institutioner og fonde, samt seneste ændringer i positionsstørrelse. Større aktionærer kan omfatte individuelle investorer, investeringsforeninger, hedgefonde eller institutioner. Skema 13D angiver, at investoren besidder (eller besidder) mere end 5 % af virksomheden og har til hensigt (eller har til hensigt at) aktivt at forfølge en ændring i forretningsstrategi. Skema 13G indikerer en passiv investering på over 5%.
The share price as of April 10, 2026 is 5,61 / share. Previously, on April 11, 2025, the share price was 4,32 / share. This represents an increase of 29,86% over that period.

Fondens stemningsscore
Fund Sentiment Score (fka Ownership Accumulation Score) finder de aktier, der bliver mest købt af fonde. Det er resultatet af en sofistikeret, multi-faktor kvantitativ model, der identificerer virksomheder med de højeste niveauer af institutionel akkumulering. Scoringsmodellen bruger en kombination af den samlede stigning i oplyste ejere, ændringerne i porteføljeallokeringer i disse ejere og andre målinger. Tallet går fra 0 til 100, hvor højere tal indikerer et højere niveau af akkumulering for sine jævnaldrende, og 50 er gennemsnittet.
Opdateringsfrekvens: Dagligt
Se Ownership Explorer, som giver en liste over højest rangerende virksomheder.
AI+ Ask Fintel’s AI assistant about Bausch Health Companies Inc..
Select a question to share a public post with an AI-crafted answer.
Thinking of good questions…
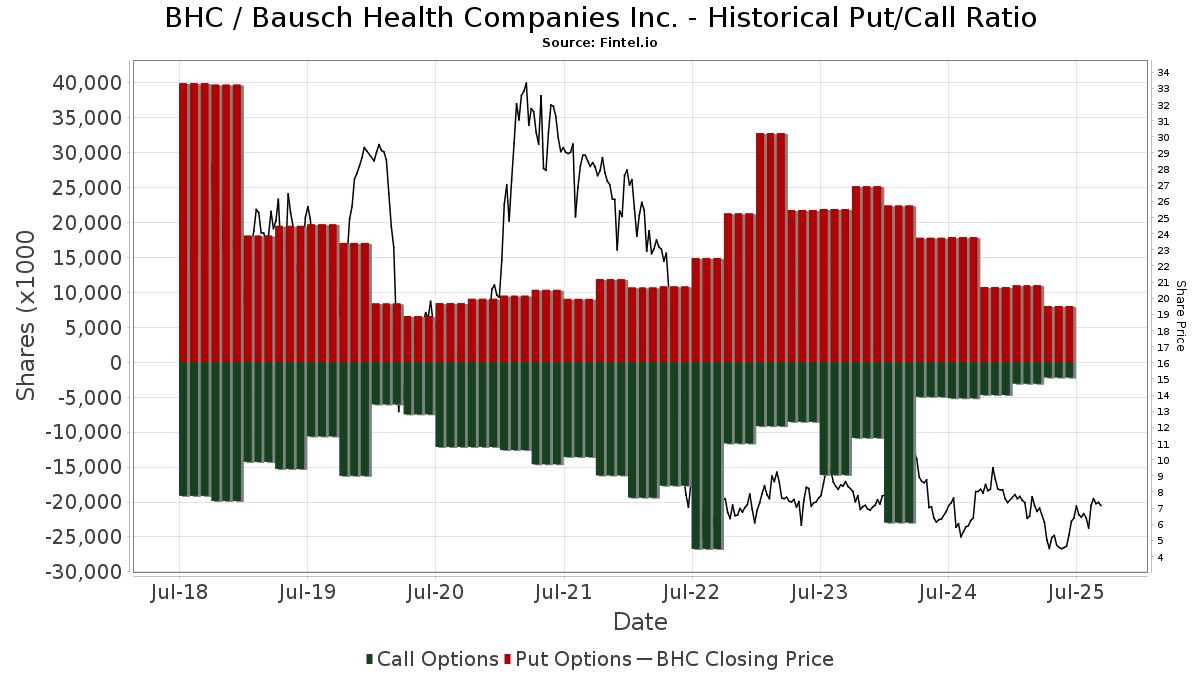
Institutionel Put/Call-forhold
Ud over at indberette standardaktie- og gældsudstedelser skal institutter med mere end 100 mill. aktiver under forvaltning også oplyse deres put- og call-optionsbeholdninger. Da salgsoptioner generelt indikerer negativ stemning, og købsoptioner indikerer positiv stemning, kan vi få en fornemmelse af den overordnede institutionelle stemning ved at plotte forholdet mellem put og kald. Diagrammet til højre viser det historiske put/call-forhold for dette instrument.
Brug af Put/Call Ratio som en indikator for investorernes stemning overvinder en af de vigtigste mangler ved at bruge totalt institutionelt ejerskab, som er, at en betydelig mængde af aktiver under forvaltning investeres passivt for at spore indekser. Passivt forvaltede fonde køber typisk ikke optioner, så indikatoren for put/call-forholdet følger mere nøje følelsen af aktivt forvaltede fonde.
13D/G-arkivering
Vi præsenterer 13D/G ansøgninger separat fra 13F ansøgninger på grund af den forskellige behandling af SEC. 13D/G-ansøgninger kan indgives af grupper af investorer (med én ledende), hvorimod 13F-ansøgninger ikke kan. Dette resulterer i situationer, hvor en investor kan indsende en 13D/G, der rapporterer én værdi for de samlede aktier (der repræsenterer alle de aktier, der ejes af investorgruppen), men derefter indsender en 13F, der rapporterer en anden værdi for de samlede aktier (der udelukkende repræsenterer deres egne) ejendomsret). Det betyder, at aktieejerskab af 13D/G-arkiver og 13F-arkiveringer ofte ikke er direkte sammenlignelige, så vi præsenterer dem separat.
Bemærk: Fra den 16. maj 2021 viser vi ikke længere ejere, der ikke har indsendt en 13D/G inden for det seneste år. Tidligere viste vi den fulde historie af 13D/G-arkiver. Generelt skal enheder, der er forpligtet til at indgive 13D/G-ansøgninger, indgive mindst årligt, før de indsender en afsluttende ansøgning. Dog forlader fonde nogle gange positioner uden at indsende en afsluttende ansøgning (dvs. de afvikler), så visning af den fulde historie resulterede nogle gange i forvirring om det nuværende ejerskab. For at undgå forvirring viser vi nu kun 'aktuelle' ejere - det vil sige - ejere, der har anmeldt inden for det seneste år.
Upgrade to unlock premium data.
| Fil dato | Form | Investor | Forrige Aktier |
Seneste Aktier |
Δ Aktier (Procent) |
Ejendomsret (Procent) |
Δ Ejerskab (Procent) |
|
|---|---|---|---|---|---|---|---|---|
| 2025-11-14 | NOMURA HOLDINGS INC | 23,395,000 | 15,708,085 | -32.86 | 4.20 | -33.33 | ||
| 2025-08-15 | Icahn Partners Master Fund LP | 34,721,118 | 0 | -100.00 | 0.00 | -100.00 | ||
| 2025-08-14 | GOLDENTREE ASSET MANAGEMENT LP | 28,447,644 | 35,243,712 | 23.89 | 9.50 | 21.79 | ||
| 2025-08-14 | PAULSON & CO. INC. | 32,791,702 | 70,755,869 | 115.77 | 19.10 | 114.61 | ||
| 2025-04-07 | MERUELO ALEX | 36,761,788 | 9.99 | 0.20 |
13F og NPORT arkivering
Detaljer om 13F-arkivering er gratis. Detaljer om NP-ansøgninger kræver et premium-medlemskab. Grønne rækker angiver nye positioner. Røde rækker angiver lukkede positioner. Klik på linket ikon for at se den fulde transaktionshistorik.
Opgrader
for at låse premium-data op og eksportere til Excel ![]() .
.
| Fil dato | Kilde | Investor | Type | Gennemsnitlig pris (Øst) |
Aktier | Δ Aktier (%) |
Rapporteret Værdi ($1000) |
Δ Værdi (%) |
Port Alloc (%) |
|
|---|---|---|---|---|---|---|---|---|---|---|
| 2026-01-30 | 13F | North Star Investment Management Corp. | 335 | 0,00 | 2 | 0,00 | ||||
| 2026-02-12 | 13F | MFN Partners Management, LP | 6.000.000 | 0,00 | 41.700 | 7,75 | ||||
| 2026-01-26 | 13F | Merit Financial Group, LLC | 35.537 | 2,49 | 247 | 10,31 | ||||
| 2026-02-19 | 13F | Invesco Ltd. | 178.607 | 5,89 | 1.241 | 14,17 | ||||
| 2026-02-12 | 13F | Jane Street Group, Llc | Call | 0 | -100,00 | 0 | -100,00 | |||
| 2026-02-17 | 13F | Amundi | 14.835 | 103 | ||||||
| 2026-04-03 | 13F | Investors Research Corp | 1.300 | 0,00 | 7 | -22,22 | ||||
| 2026-02-11 | 13F | Fox Run Management, L.l.c. | 36.787 | 256 | ||||||
| 2026-02-13 | 13F | Healthcare Of Ontario Pension Plan Trust Fund | 8.452.119 | -34,98 | 58.742 | -29,94 | ||||
| 2026-02-03 | 13F | SBI Securities Co., Ltd. | 1.575 | 0,32 | 11 | 0,00 | ||||
| 2026-01-09 | 13F | SG Americas Securities, LLC | 14.334 | -99,52 | 0 | -100,00 | ||||
| 2026-01-26 | 13F | Mountain Hill Investment Partners Corp. | 6.000 | 0,00 | 42 | 7,89 | ||||
| 2026-01-29 | 13F | UBS Group AG | Put | 40.000 | -27,16 | 278 | -21,47 | |||
| 2026-01-29 | 13F | UBS Group AG | 607.477 | -88,20 | 4.222 | -87,29 | ||||
| 2026-02-06 | 13F | Leonteq Securities AG | 19.976 | 8.661,40 | 190 | 18.800,00 | ||||
| 2026-02-13 | 13F | Morgan Stanley | 1.054.718 | 89,64 | 7.330 | 104,35 | ||||
| 2026-02-13 | 13F | Financial Freedom, LLC | 17.394 | 0,00 | 121 | 7,14 | ||||
| 2026-01-27 | 13F | WealthCollab, LLC | 268 | 0,00 | 2 | 0,00 | ||||
| 2026-02-02 | 13F | Wolverine Asset Management Llc | Put | 4.600 | 119,05 | 32 | 138,46 | |||
| 2026-02-17 | 13F | Cetera Investment Advisers | 18.663 | 68,67 | 130 | 81,69 | ||||
| 2026-02-13 | 13F | MAI Capital Management | 498 | 6,41 | 3 | 0,00 | ||||
| 2026-01-21 | 13F | Flagship Harbor Advisors, Llc | 61 | 0 | ||||||
| 2025-10-27 | 13F | First Horizon Corp | 0 | -100,00 | 0 | |||||
| 2026-02-13 | 13F | OMERS ADMINISTRATION Corp | 0 | -100,00 | 0 | -100,00 | ||||
| 2026-02-13 | 13F | Aviso Financial Inc. | 740 | 5 | ||||||
| 2026-02-18 | 13F | State of Tennessee, Treasury Department | 46.420 | 62,77 | 266 | 45,36 | ||||
| 2026-01-28 | 13F | Lebenthal Global Advisors, LLC | 80.722 | 26,76 | 561 | 36,83 | ||||
| 2026-02-06 | 13F | Summit Wealth Group, LLC | 11.918 | 0,00 | 83 | 7,89 | ||||
| 2026-02-17 | 13F | Man Group plc | 602.128 | 4.185 | ||||||
| 2026-02-13 | 13F | Inspire Advisors, LLC | 0 | -100,00 | 0 | |||||
| 2026-02-17 | 13F | Aquatic Capital Management LLC | 7.069 | -54,57 | 49 | -51,00 | ||||
| 2026-02-17 | 13F | Canada Pension Plan Investment Board | 809.644 | 0,00 | 5.624 | 7,82 | ||||
| 2026-02-10 | 13F | CIBC Asset Management Inc | 242.169 | -10,38 | 1.682 | -3,17 | ||||
| 2026-02-17 | 13F | Raymond James Financial Inc | 83.539 | -22,38 | 581 | -16,43 | ||||
| 2026-02-12 | 13F | CIBC Private Wealth Group, LLC | 0 | -100,00 | 0 | |||||
| 2026-02-13 | 13F | Mariner, LLC | 55.664 | 146,24 | 387 | 166,21 | ||||
| 2026-02-13 | 13F | Squarepoint Ops LLC | Put | 0 | -100,00 | 0 | -100,00 | |||
| 2026-02-12 | 13F | Hrt Financial Lp | 37.500 | 178,00 | 0 | |||||
| 2026-02-17 | 13F | Two Sigma Investments, Lp | 1.662.680 | 154,77 | 11.556 | 174,53 | ||||
| 2026-02-06 | 13F | Global Retirement Partners, LLC | 3.610 | 0,00 | 25 | 8,70 | ||||
| 2026-02-13 | 13F | Vontobel Holding Ltd. | 23.621 | -16,73 | 164 | -9,89 | ||||
| 2025-11-14 | 13F | Ubs Asset Management Americas Inc | 0 | -100,00 | 0 | |||||
| 2026-02-04 | 13F | LRI Investments, LLC | 188 | 0,00 | 1 | 0,00 | ||||
| 2026-04-07 | 13F | Armstrong Henry H Associates Inc | 44.215 | 0,00 | 239 | -22,48 | ||||
| 2026-02-04 | 13F | Swiss Life Asset Management Ltd | 11.707 | 5,39 | 81 | 14,08 | ||||
| 2026-01-28 | 13F | City State Bank | 100 | 0,00 | 1 | |||||
| 2026-02-11 | 13F | Fore Capital, LLC | 120.000 | 33,33 | 834 | 43,79 | ||||
| 2026-02-17 | 13F | Soviero Asset Management, LP | 240.000 | 1.668 | ||||||
| 2026-04-02 | 13F | Ares Financial Consulting, LLC | 70 | 0 | ||||||
| 2026-02-11 | 13F | Fore Capital, LLC | Call | 120.000 | 834 | |||||
| 2026-02-17 | 13F | Private Advisor Group, LLC | 15.758 | -0,54 | 110 | 6,86 | ||||
| 2026-02-10 | 13F | Bnp Paribas Arbitrage, Sa | Put | 0 | -100,00 | 0 | -100,00 | |||
| 2026-04-10 | 13F | Country Trust Bank | 20 | 0,00 | 0 | |||||
| 2026-02-13 | 13F | Kilter Group LLC | 0 | -100,00 | 0 | |||||
| 2026-02-17 | 13F | Brevan Howard Capital Management LP | 19.740 | 137 | ||||||
| 2026-02-10 | 13F | State of Wyoming | 59.227 | 117,33 | 412 | 134,86 | ||||
| 2026-02-17 | 13F | Clear Street Markets Llc | 0 | -100,00 | 0 | |||||
| 2026-01-28 | 13F | CAPROCK Group, Inc. | 49.740 | 346 | ||||||
| 2026-02-11 | 13F | O'shaughnessy Asset Management, Llc | 331.377 | 2.303 | ||||||
| 2026-01-26 | 13F | Cwm, Llc | 2.000 | 0 | ||||||
| 2026-02-12 | 13F | Wealthspire Advisors, LLC | 0 | -100,00 | 0 | |||||
| 2026-02-11 | 13F | MCF Advisors LLC | 37 | 0,00 | 0 | |||||
| 2026-02-13 | 13F | Headlands Technologies LLC | 31.729 | 221 | ||||||
| 2025-11-13 | 13F | Glenmede Investment Management, LP | 0 | -100,00 | 0 | |||||
| 2026-02-02 | 13F | Academy Capital Management Inc/tx | 42.288 | 0,00 | 294 | 7,72 | ||||
| 2025-11-14 | 13F | Point72 (DIFC) Ltd | 1.385 | 9 | ||||||
| 2026-02-12 | 13F | Brinker Capital Investments, LLC | 14.373 | 100 | ||||||
| 2025-11-14 | 13F | Royal Bank Of Canada | Call | 0 | -100,00 | 0 | -100,00 | |||
| 2026-02-10 | 13F | Quantbot Technologies LP | 46.936 | 23,42 | 326 | 33,06 | ||||
| 2026-02-17 | 13F | Alliancebernstein L.p. | 30.118 | 0,00 | 209 | 7,73 | ||||
| 2026-01-13 | 13F | Kathmere Capital Management, LLC | 12.790 | 89 | ||||||
| 2026-02-17 | 13F | Lazard Asset Management Llc | 46.025 | 15,55 | 320 | 24,61 | ||||
| 2026-02-12 | 13F | Banco BTG Pactual S.A. | 170.700 | 1.186 | ||||||
| 2026-02-10 | 13F/A | Northwestern Mutual Wealth Management Co | 5.409 | 0,00 | 38 | 8,82 | ||||
| 2026-02-13 | 13F/A | Virtus ETF Advisers LLC | 0 | -100,00 | 0 | |||||
| 2026-01-23 | 13F | Ritholtz Wealth Management | 79.796 | 555 | ||||||
| 2026-02-17 | 13F | Graham Capital Management, L.P. | 134.985 | 189,36 | 938 | 212,67 | ||||
| 2026-02-13 | 13F | Walleye Capital LLC | Call | 23.300 | 162 | |||||
| 2026-02-13 | 13F | Walleye Capital LLC | Put | 1.200 | 8 | |||||
| 2026-02-13 | 13F | Truvestments Capital Llc | 109 | 0,00 | 1 | |||||
| 2026-02-13 | 13F | Walleye Capital LLC | 13.884 | 96 | ||||||
| 2026-02-13 | 13F | Bridgewater Associates, LP | 489.441 | 12,11 | 3.402 | 20,82 | ||||
| 2025-11-07 | 13F | Shell Asset Management Co | 4.000 | -71,83 | 0 | |||||
| 2026-02-10 | 13F | Acadian Asset Management Llc | 2.210.403 | 136,28 | 15 | 150,00 | ||||
| 2026-04-10 | 13F | Abound Wealth Management | 8 | 0 | ||||||
| 2026-02-10 | 13F | Lido Advisors, LLC | 371.629 | 2.583 | ||||||
| 2026-01-29 | 13F | Nbc Securities, Inc. | 150 | 0,00 | 1 | |||||
| 2026-02-13 | 13F | Cornerstone Financial Management LLC | 187 | 1 | ||||||
| 2026-02-13 | 13F | Great West Life Assurance Co /can/ | 41.204 | -61,99 | 0 | |||||
| 2026-02-17 | 13F | Creative Planning | 18.622 | -63,23 | 129 | -60,43 | ||||
| 2026-02-17 | 13F | Susquehanna International Group, Llp | Put | 1.701.000 | 42,36 | 11.822 | 53,38 | |||
| 2026-02-13 | 13F | BNP Paribas Asset Management Holding S.A. | 655.055 | 5 | ||||||
| 2026-02-17 | 13F | Susquehanna International Group, Llp | Call | 435.100 | 8,64 | 3.024 | 17,03 | |||
| 2026-02-17 | 13F | Susquehanna International Group, Llp | 418.810 | 101,59 | 2.911 | 117,16 | ||||
| 2026-02-17 | 13F | Biglari Capital Corp. | 41.070 | 0,00 | 285 | 7,95 | ||||
| 2026-02-17 | 13F | XTX Topco Ltd | 61.148 | 55,89 | 425 | 67,59 | ||||
| 2026-02-17 | 13F | Engineers Gate Manager LP | 98.410 | 587,75 | 684 | 642,39 | ||||
| 2026-02-11 | 13F | X-Square Capital, LLC | 17.950 | -4,12 | 0 | |||||
| 2026-02-17 | 13F | PDT Partners, LLC | 50.045 | 19,60 | 348 | 29,00 | ||||
| 2026-02-02 | 13F | Intact Investment Management Inc. | 100.500 | -11,53 | 698 | -4,65 | ||||
| 2026-01-28 | 13F | Universal- Beteiligungs- und Servicegesellschaft mbH | 171.169 | 29,47 | 1.194 | 40,19 | ||||
| 2025-11-06 | 13F | CBIZ Investment Advisory Services, LLC | 0 | -100,00 | 0 | |||||
| 2025-11-14 | 13F | Parallax Volatility Advisers, L.P. | Call | 0 | -100,00 | 0 | -100,00 | |||
| 2026-02-12 | 13F | Renaissance Technologies Llc | 1.432.191 | 20,89 | 9.954 | 30,26 | ||||
| 2026-02-03 | 13F | Credit Industriel Et Commercial | 46.797 | 0,00 | 325 | 7,97 | ||||
| 2026-02-17 | 13F | Parallax Volatility Advisers, L.P. | Put | 0 | -100,00 | 0 | -100,00 | |||
| 2026-01-16 | 13F | FNY Investment Advisers, LLC | 30 | 0 | ||||||
| 2026-02-17 | 13F | SIG North Trading, ULC | Put | 160.400 | 33,00 | 1.115 | 43,37 | |||
| 2026-02-17 | 13F | SIG North Trading, ULC | Call | 277.900 | 47,98 | 1.931 | 59,45 | |||
| 2026-02-12 | 13F | Federation des caisses Desjardins du Quebec | 11.410 | -7,01 | 79 | 1,28 | ||||
| 2026-02-17 | 13F | Tower Research Capital LLC (TRC) | 3.028 | -56,88 | 21 | -53,33 | ||||
| 2025-11-14 | 13F | Wolverine Trading, Llc | 18.553 | 120 | ||||||
| 2026-02-05 | 13F | Bessemer Group Inc | 13.500 | 0 | ||||||
| 2025-11-14 | 13F | Wolverine Trading, Llc | Call | 152.000 | 983 | |||||
| 2025-11-14 | 13F | Wolverine Trading, Llc | Put | 204.700 | 1.324 | |||||
| 2026-02-13 | 13F | JustInvest LLC | 11.431 | 79 | ||||||
| 2025-10-29 | 13F | JCIC Asset Management Inc. | 0 | -100,00 | 0 | |||||
| 2026-02-18 | 13F | Mackenzie Financial Corp | 310.915 | 57,91 | 2.173 | 71,43 | ||||
| 2026-04-07 | 13F | Farther Finance Advisors, LLC | 75 | -91,03 | 0 | -100,00 | ||||
| 2026-02-10 | 13F | Savant Capital, LLC | 38.004 | 264 | ||||||
| 2026-02-12 | 13F | Dimensional Fund Advisors Lp | 3.253.995 | 8,02 | 22.616 | 16,39 | ||||
| 2026-02-06 | 13F | GPS Wealth Strategies Group, LLC | 270 | 0,00 | 2 | 0,00 | ||||
| 2026-02-17 | 13F | Investment Management Corp of Ontario | 32.275 | 224 | ||||||
| 2026-02-06 | 13F | EverSource Wealth Advisors, LLC | 196 | 161,33 | 1 | |||||
| 2026-02-11 | 13F | Simplex Trading, Llc | Put | 141.700 | -72,81 | 985 | 32.700,00 | |||
| 2026-02-12 | 13F | Round Hill Asset Management | 73.687 | -0,54 | 511 | 7,13 | ||||
| 2025-11-06 | 13F | Stratos Wealth Advisors, LLC | 0 | -100,00 | 0 | |||||
| 2026-02-11 | 13F | Simplex Trading, Llc | 6.478 | 45 | ||||||
| 2026-02-11 | 13F | Group One Trading, L.p. | Put | 673.800 | -6,97 | 4.683 | 0,24 | |||
| 2026-01-12 | 13F | CVA Family Office, LLC | 143 | 1 | ||||||
| 2026-02-05 | 13F | Gamco Investors, Inc. Et Al | 874.452 | -3,49 | 6.077 | 4,00 | ||||
| 2026-02-12 | 13F | McMillan Office, Inc. | 300 | 2 | ||||||
| 2026-02-17 | 13F | Goldentree Asset Management Lp | 34.665.731 | -0,48 | 240.639 | 7,23 | ||||
| 2026-02-12 | 13F | Swiss National Bank | 514.160 | 1,64 | 3.577 | 9,79 | ||||
| 2026-02-17 | 13F | Paulson & Co. Inc. | 73.255.869 | 3,53 | 509.128 | 11,56 | ||||
| 2026-02-17 | 13F | Gotham Asset Management, LLC | 57.161 | 0,24 | 397 | 8,17 | ||||
| 2026-02-17 | 13F | Russell Investments Group, Ltd. | 105.363 | 2.010,64 | 733 | 2.187,50 | ||||
| 2026-02-17 | 13F | Qube Research & Technologies Ltd | 636.065 | 4.421 | ||||||
| 2026-02-17 | 13F | Third Point LLC | 350.000 | 250,00 | 2.432 | 277,05 | ||||
| 2026-02-10 | 13F | Td Asset Management Inc | 840.584 | 2,81 | 5.844 | 11,00 | ||||
| 2026-02-12 | 13F | Skopos Labs, Inc. | 20.679 | 147 | ||||||
| 2026-02-13 | 13F | Public Sector Pension Investment Board | 0 | -100,00 | 0 | |||||
| 2026-04-03 | 13F | Global Wealth Strategies & Associates | 137 | 0,00 | 1 | |||||
| 2026-02-17 | 13F | Bank Of America Corp /de/ | 1.507.558 | 4,12 | 10.478 | 12,20 | ||||
| 2026-02-17 | 13F | Caption Management, LLC | Put | 0 | -100,00 | 0 | ||||
| 2026-02-03 | 13F | Coston, McIsaac & Partners | 201 | -10,27 | 0 | |||||
| 2025-11-14 | 13F | ExodusPoint Capital Management, LP | 0 | -100,00 | 0 | |||||
| 2026-02-19 | 13F | First Growth Capital LLC | 32.660 | 199 | ||||||
| 2026-01-29 | 13F | Vanguard Group Inc | 10.679.760 | -12,75 | 74.150 | -5,91 | ||||
| 2026-02-05 | 13F | Gabelli Funds Llc | 56.000 | 0,00 | 389 | 7,76 | ||||
| 2026-02-13 | 13F | Hudson Bay Capital Management LP | 5.000.000 | 0,00 | 34.750 | 7,75 | ||||
| 2026-02-12 | 13F | Quadrant Capital Group Llc | 1.749 | 122,80 | 12 | 140,00 | ||||
| 2026-02-12 | 13F | Nuveen, LLC | 334.156 | 62,39 | 2.323 | 75,32 | ||||
| 2026-02-17 | 13F | Jump Financial, LLC | 776.865 | 1.216,72 | 5.399 | 1.320,79 | ||||
| 2026-02-12 | 13F | Marex Group plc | 30.327 | -43,35 | 211 | -39,13 | ||||
| 2026-02-13 | 13F | Smartleaf Asset Management LLC | 53 | 0 | ||||||
| 2026-02-17 | 13F | Trexquant Investment LP | 233.487 | 1.623 | ||||||
| 2026-02-05 | 13F | Millennium Capital Advisors, LLC | 0 | -100,00 | 0 | |||||
| 2025-11-21 | 13F | Nebula Research & Development LLC | 0 | -100,00 | 0 | |||||
| 2026-02-02 | 13F | Cornerstone Planning Group LLC | 12 | 0,00 | 0 | |||||
| 2026-02-11 | 13F | Winton Capital Group Ltd | 48.857 | 1,82 | 340 | 9,71 | ||||
| 2026-04-09 | 13F | Park Place Capital Corp | 150 | 0,00 | 1 | -100,00 | ||||
| 2026-01-29 | 13F | Concurrent Investment Advisors, LLC | 10.000 | 70 | ||||||
| 2026-01-30 | 13F | Mitsubishi UFJ Trust & Banking Corp | 366.724 | 15,28 | 2.529 | 23,49 | ||||
| 2026-02-17 | 13F | Citadel Advisors Llc | Put | 559.700 | 1,49 | 3.890 | 9,33 | |||
| 2026-04-09 | 13F | Sanders Morris Harris Llc | 28.975 | 156 | ||||||
| 2026-02-17 | 13F | Whitebox Advisors Llc | 544.497 | 55,20 | 3.784 | 67,29 | ||||
| 2026-02-17 | 13F | Balyasny Asset Management Llc | 296.903 | 1.432,32 | 2.063 | 1.563,71 | ||||
| 2026-02-17 | 13F | Public Employees Retirement System Of Ohio | 201.742 | -12,11 | 1.403 | -5,14 | ||||
| 2026-02-13 | 13F | National Bank Of Canada /fi/ | 5.315.669 | -31,17 | 36.902 | -25,90 | ||||
| 2026-02-13 | 13F | Eschler Asset Management LLP | 0 | -100,00 | 0 | |||||
| 2026-02-17 | 13F | Citadel Advisors Llc | Call | 156.200 | -59,37 | 1.086 | -56,23 | |||
| 2026-02-17 | 13F | Citadel Advisors Llc | 1.487.295 | 5.292,66 | 10.337 | 5.739,55 | ||||
| 2026-02-17 | 13F | Royal Bank Of Canada | 9.100.604 | -13,38 | 63.249 | -6,67 | ||||
| 2026-02-11 | 13F | Group One Trading, L.p. | Call | 648.300 | -3,38 | 4.506 | 4,11 | |||
| 2026-02-11 | 13F | Picton Mahoney Asset Management | 91.528 | -1,16 | 636 | |||||
| 2026-02-11 | 13F | Simplex Trading, Llc | Call | 271.600 | -21,98 | 1.888 | 94.250,00 | |||
| 2026-02-02 | 13F | Wolverine Asset Management Llc | Call | 5.400 | 58,82 | 38 | 76,19 | |||
| 2026-02-05 | 13F | Allworth Financial LP | 1.881 | 16,40 | 13 | 30,00 | ||||
| 2026-02-24 | 13F | Bell Investment Advisors, Inc | 148 | 94,74 | 1 | |||||
| 2026-02-13 | 13F | Verition Fund Management LLC | 22.127 | -87,10 | 154 | -86,17 | ||||
| 2025-10-27 | 13F | New Republic Capital, LLC | 0 | -100,00 | 0 | |||||
| 2025-11-07 | 13F | Pnc Financial Services Group, Inc. | 0 | -100,00 | 0 | |||||
| 2026-02-17 | 13F | Capstone Investment Advisors, Llc | 93.469 | 17,29 | 650 | 26,26 | ||||
| 2026-02-13 | 13F | SRS Capital Advisors, Inc. | 28 | 0 | ||||||
| 2026-02-12 | 13F | Steward Partners Investment Advisory, Llc | 43 | 0,00 | 0 | |||||
| 2026-02-17 | 13F | Alpine Global Management, LLC | Put | 0 | -100,00 | 0 | -100,00 | |||
| 2026-02-13 | 13F | Charles Schwab Investment Management Inc | 2.045.737 | 8,01 | 14.223 | 16,61 | ||||
| 2026-01-16 | 13F | Kendall Capital Management | 0 | -100,00 | 0 | |||||
| 2026-02-13 | 13F | National Bank Of Canada /fi/ | Put | 332 | 230 | |||||
| 2026-02-13 | 13F | Colony Group, LLC | 71.016 | 0,26 | 459 | -1,29 | ||||
| 2026-02-13 | 13F | Wells Fargo & Company/mn | 339.313 | 10,41 | 2.358 | 18,97 | ||||
| 2026-02-14 | 13F | Rockefeller Capital Management L.P. | 54 | 0 | ||||||
| 2026-02-12 | 13F | Jane Street Group, Llc | 682.163 | 408,56 | 4.741 | 448,09 | ||||
| 2026-01-30 | 13F | Us Bancorp \de\ | 240 | 0,00 | 2 | 0,00 | ||||
| 2026-02-11 | 13F | Ing Groep Nv | 5.000.000 | 0,00 | 34.750 | 7,75 | ||||
| 2026-02-12 | 13F | Jane Street Group, Llc | Put | 170.400 | 0,95 | 1.184 | 8,82 | |||
| 2026-04-07 | 13F | Signaturefd, Llc | 7.040 | -22,33 | 38 | -38,71 | ||||
| 2026-02-06 | 13F | Poehling Capital Management, LLC | 86.018 | -0,03 | 598 | 7,76 | ||||
| 2026-02-17 | 13F | Alpine Global Management, LLC | 0 | -100,00 | 0 | -100,00 | ||||
| 2026-01-27 | 13F | Clark Asset Management, LLC | 11.628 | 81 | ||||||
| 2026-02-06 | 13F | Larson Financial Group LLC | 815 | 1.214,52 | 6 | |||||
| 2026-01-27 | 13F | TD Waterhouse Canada Inc. | 1.468 | 10,38 | 10 | 25,00 | ||||
| 2026-02-17 | 13F | D. E. Shaw & Co., Inc. | 1.680.629 | 80,21 | 11.678 | 94,26 | ||||
| 2025-10-14 | 13F | Rockwood Wealth Management, LLC | 0 | -100,00 | 0 | -100,00 | ||||
| 2026-02-11 | 13F | Compass Rose Asset Management, LP | 0 | -100,00 | 0 | |||||
| 2025-11-06 | 13F | Gruss & Co., LLC | 0 | -100,00 | 0 | |||||
| 2026-01-27 | 13F | Zurcher Kantonalbank (Zurich Cantonalbank) | 88.971 | 0,00 | 619 | 8,04 | ||||
| 2026-02-17 | 13F | Tudor Investment Corp Et Al | 11.800 | 82 | ||||||
| 2025-11-07 | 13F | Readystate Asset Management Lp | 0 | -100,00 | 0 | |||||
| 2026-02-17 | 13F | Aqr Capital Management Llc | 101.341 | 704 | ||||||
| 2026-03-03 | 13F/A | Caitong International Asset Management Co., Ltd | 10.058 | 25.689,74 | 70 | |||||
| 2026-02-03 | 13F | Sequoia Financial Advisors, LLC | 25.158 | 4,14 | 175 | 12,26 | ||||
| 2026-02-17 | 13F | Blair William & Co/il | 78.002 | -0,98 | 542 | 6,69 | ||||
| 2026-02-03 | 13F | Sequoia Financial Advisors, LLC | Call | 313 | 141,86 | |||||
| 2026-02-06 | 13F | Gsa Capital Partners Llp | 18.872 | 0 | ||||||
| 2026-02-24 | 13F | DGS Capital Management, LLC | 0 | -100,00 | 0 | |||||
| 2026-01-07 | 13F | Marotta Asset Management | 13.225 | 0,00 | 92 | 4,60 | ||||
| 2026-02-10 | 13F | Bank of New York Mellon Corp | 37.504 | -1,78 | 261 | 5,69 | ||||
| 2026-02-10 | 13F | Hillsdale Investment Management Inc. | 524.892 | 3.651 | ||||||
| 2026-02-20 | 13F | Sunbelt Securities, Inc. | 0 | -100,00 | 0 | |||||
| 2026-02-02 | 13F | Alpha Wealth Funds, LLC | 10.000 | 0,00 | 72 | 26,32 | ||||
| 2026-02-13 | 13F | Centiva Capital, LP | 0 | -100,00 | 0 | |||||
| 2026-02-26 | 13F/A | Aristides Capital LLC | 28.639 | 199 | ||||||
| 2026-02-12 | 13F | Commonwealth Equity Services, Llc | 14.067 | 14,79 | 98 | |||||
| 2026-01-30 | 13F | Activest Wealth Management | 1.900 | 0,00 | 13 | 8,33 | ||||
| 2025-11-12 | 13F | GABELLI & Co INVESTMENT ADVISERS, INC. | 0 | -100,00 | 0 | |||||
| 2026-01-29 | 13F | IMC-Chicago, LLC | Put | 72.200 | 24,48 | 502 | 33,96 | |||
| 2026-01-29 | 13F | IMC-Chicago, LLC | Call | 35.100 | -51,92 | 244 | -48,30 | |||
| 2026-02-13 | 13F | Manufacturers Life Insurance Company, The | 0 | -100,00 | 0 | |||||
| 2026-02-17 | 13F | Tang Capital Management Llc | 0 | -100,00 | 0 | |||||
| 2026-02-10 | 13F | Bnp Paribas Arbitrage, Sa | 53.236 | -95,96 | 370 | -95,66 | ||||
| 2026-02-13 | 13F | Umb Bank N A/mo | 1.770 | 0,00 | 12 | 9,09 | ||||
| 2026-02-11 | 13F | Jpmorgan Chase & Co | 253.640 | 3,62 | 1.763 | 11,66 | ||||
| 2026-02-17 | 13F | DZ BANK AG Deutsche Zentral Genossenschafts Bank, Frankfurt am Main | 784.523 | 47,21 | 5.452 | 58,63 | ||||
| 2026-02-11 | 13F | Jpmorgan Chase & Co | Call | 50.200 | 349 | |||||
| 2025-11-12 | 13F | HAP Trading, LLC | Put | 372.500 | 212 | |||||
| 2026-02-13 | 13F | Arrowstreet Capital, Limited Partnership | 2.723.655 | 1.224,79 | 18.914 | 1.327,47 | ||||
| 2026-01-21 | 13F | SJS Investment Consulting Inc. | 30 | 0,00 | 0 | |||||
| 2026-02-17 | 13F | Susquehanna Advisors Group, Inc. | 15.800 | -75,16 | 110 | -73,41 | ||||
| 2026-01-30 | 13F | Harbor Advisors LLC | 10.000 | 0,00 | 70 | 7,81 | ||||
| 2026-02-11 | 13F | LPL Financial LLC | 144.104 | 134,44 | 1.002 | 152,78 | ||||
| 2026-01-20 | 13F | Toth Financial Advisory Corp | 400 | 0,00 | 3 | 0,00 | ||||
| 2026-02-13 | 13F | Macquarie Group Ltd | 3.250.000 | 0,00 | 22.588 | 7,75 | ||||
| 2026-02-02 | 13F | Truist Financial Corp | 61.398 | 132,11 | 390 | 128,82 | ||||
| 2026-02-02 | 13F | Wolverine Asset Management Llc | 82.718 | -1,05 | 575 | 6,49 | ||||
| 2025-11-14 | 13F | Quarry LP | 0 | -100,00 | 0 | |||||
| 2026-02-17 | 13F | Two Sigma Securities, Llc | 11.473 | 80 | ||||||
| 2026-02-17 | 13F | Fountainhead AM, LLC | 0 | -100,00 | 0 | |||||
| 2026-02-17 | 13F | Maple Rock Capital Partners Inc. | 0 | -100,00 | 0 | |||||
| 2026-02-17 | 13F | Crawford Fund Management, LLC | Put | 198.500 | -26,48 | 1.380 | -20,79 | |||
| 2026-01-15 | 13F | Range Financial Group LLC | 175.996 | 8,79 | 1.223 | 17,26 | ||||
| 2026-02-12 | 13F | Federated Hermes, Inc. | 134.030 | 7,52 | 932 | 15,80 | ||||
| 2026-02-13 | 13F | Walleye Trading LLC | 31.813 | 221 | ||||||
| 2026-02-17 | 13F | Nomura Holdings Inc | 8.699.533 | -44,62 | 60.462 | -40,32 | ||||
| 2025-11-14 | 13F | Icahn Carl C | 0 | -100,00 | 0 | -100,00 | ||||
| 2026-02-11 | 13F | Deutsche Bank Ag\ | 20.544 | 0,00 | 143 | 7,58 | ||||
| 2026-02-11 | 13F | Cerity Partners LLC | 70.178 | -0,96 | 488 | 6,56 | ||||
| 2025-11-17 | 13F | GWM Advisors LLC | 0 | -100,00 | 0 | |||||
| 2026-02-13 | 13F | Walleye Trading LLC | Put | 79.100 | 28,62 | 550 | 38,64 | |||
| 2026-02-13 | 13F | Stifel Financial Corp | 14.206 | -12,34 | 99 | -5,77 | ||||
| 2026-02-13 | 13F | Walleye Trading LLC | Call | 60.700 | -37,16 | 422 | -32,42 | |||
| 2026-02-11 | 13F | Franklin Resources Inc | 69.531 | -4,22 | 483 | -50,00 | ||||
| 2026-02-17 | 13F | Advisory Services Network, LLC | 0 | -100,00 | 0 | |||||
| 2026-01-29 | 13F | Pictet Asset Management Holding SA | 52.055 | 0,00 | 362 | 7,76 | ||||
| 2026-02-13 | 13F | National Bank Of Canada /fi/ | Call | 550 | 216,09 | 382 | 240,18 | |||
| 2026-02-11 | 13F | Private Management Group Inc | 1.892.895 | 16,72 | 13.156 | 25,76 | ||||
| 2026-02-13 | 13F | Neuberger Berman Group LLC | 31.050 | 0,16 | 216 | 8,04 | ||||
| 2026-02-17 | 13F/A | Northwest & Ethical Investments L.P. | 59.984 | 52,27 | 417 | 64,43 | ||||
| 2026-03-06 | 13F | Hsbc Holdings Plc | 0 | -100,00 | 0 | |||||
| 2026-02-09 | 13F | Legal & General Group Plc | 341.678 | 6,57 | 2.375 | 15,07 | ||||
| 2026-02-17 | 13F | Oxford Asset Management Llp | 60.736 | 422 | ||||||
| 2026-02-17 | 13F | Oaktree Capital Management Lp | 1.270.000 | 0,00 | 8.826 | 7,75 | ||||
| 2026-02-13 | 13F | Fort Point Capital Partners LLC | 0 | -100,00 | 0 | |||||
| 2026-02-13 | 13F/A | Alberta Investment Management Corp | 0 | -100,00 | 0 | |||||
| 2026-02-09 | 13F | Geode Capital Management, Llc | 1.723.682 | 18,74 | 15.995 | 26,68 | ||||
| 2026-01-16 | 13F | Ronald Blue Trust, Inc. | 50 | -66,67 | 0 | -100,00 | ||||
| 2026-02-17 | 13F | Cinctive Capital Management LP | 0 | -100,00 | 0 | |||||
| 2026-02-13 | 13F | Barclays Plc | 19.965 | -87,73 | 139 | -89,61 | ||||
| 2026-02-06 | 13F | Handelsbanken Fonder AB | 48.600 | -19,40 | 0 | |||||
| 2026-02-17 | 13F | Kohlberg Kravis Roberts & Co. L.P. | 5.235.000 | 0,00 | 36.383 | 7,75 | ||||
| 2026-02-17 | 13F | Advisor Group Holdings, Inc. | 48.291 | 19,46 | 336 | 23,62 | ||||
| 2025-11-14 | 13F | Point72 Asia (Singapore) Pte. Ltd. | 132 | 1 | ||||||
| 2026-03-05 | 13F | Gunpowder Capital Management, LLC dba Oliver Wealth Management | 1.000 | 7 | ||||||
| 2026-02-10 | 13F | MUFG Securities EMEA plc | 0 | -100,00 | 0 | |||||
| 2026-02-13 | 13F | Dynamic Technology Lab Private Ltd | 0 | -100,00 | 0 | |||||
| 2026-02-13 | 13F | Van Eck Associates Corp | 206.438 | 78,75 | 1 | |||||
| 2026-02-11 | 13F | Viewpoint Capital Management LLC | 0 | -100,00 | 0 | -100,00 | ||||
| 2026-02-17 | 13F | New Vernon Capital Holdings II LLC | 10.951 | 0,00 | 104 | 48,57 | ||||
| 2026-02-17 | 13F | Quadrature Capital Ltd | 336.712 | 2.341 | ||||||
| 2026-01-22 | 13F | Bfsg, Llc | 15.095 | 4,36 | 105 | 11,83 | ||||
| 2026-01-14 | 13F | Spire Wealth Management | 1.353 | -73,43 | 9 | -71,87 | ||||
| 2026-02-13 | 13F | American Century Companies Inc | 41.260 | 51,49 | 286 | 63,43 | ||||
| 2026-02-17 | 13F | SIG North Trading, ULC | 0 | -100,00 | 0 | |||||
| 2025-11-14 | 13F | Cubist Systematic Strategies, LLC | 24.340 | 157 | ||||||
| 2026-02-13 | 13F | Gendell Jeffrey L | 1.298.275 | 9.023 | ||||||
| 2026-02-05 | 13F | Cambridge Investment Research Advisors, Inc. | 0 | -100,00 | 0 | |||||
| 2026-02-13 | 13F | Toroso Investments, LLC | 50.465 | -2,45 | 351 | 5,11 | ||||
| 2026-02-10 | 13F | CIBC World Markets Inc. | 73.098 | -55,61 | 507 | -52,12 | ||||
| 2026-02-11 | 13F | Parallel Advisors, LLC | 1.607 | 0,00 | 11 | 10,00 | ||||
| 2026-02-13 | 13F | Citigroup Inc | 205.863 | 38,02 | 1.431 | 49,06 | ||||
| 2026-02-13 | 13F | Citigroup Inc | Put | 220.000 | 0,00 | 1.530 | 7,98 | |||
| 2026-02-12 | 13F | Bank Of Montreal /can/ | 832.267 | 2,19 | 5.779 | 10,23 | ||||
| 2026-02-10 | 13F | Gifford Fong Associates | 100.000 | 0,00 | 1 | |||||
| 2026-01-21 | 13F | Nexus Investment Management ULC | 8.500 | -34,62 | 59 | -28,92 | ||||
| 2026-02-13 | 13F | Y-Intercept (Hong Kong) Ltd | 212.231 | 218,86 | 1.475 | 243,82 | ||||
| 2026-02-17 | 13F | Lombard Odier Asset Management (USA) Corp | Put | 666.000 | -61,19 | 4.629 | -58,19 | |||
| 2026-02-17 | 13F | Jones Financial Companies Lllp | 45 | -92,01 | 0 | -100,00 | ||||
| 2026-02-13 | 13F | BRITISH COLUMBIA INVESTMENT MANAGEMENT Corp | 139.610 | -8,84 | 969 | -1,62 | ||||
| 2026-02-13 | 13F | Squarepoint Ops LLC | 78.715 | -22,77 | 547 | -16,74 | ||||
| 2025-11-07 | 13F | Murphy & Mullick Capital Management Corp | 0 | -100,00 | 0 | |||||
| 2026-02-04 | 13F | Plato Investment Management Ltd | 2.941 | 0,00 | 21 | 11,11 | ||||
| 2026-02-17 | 13F | Caption Management, LLC | 4.464 | -71,52 | 31 | -69,31 | ||||
| 2026-01-29 | 13F | Camelot Portfolios, LLC | 8.500 | 59 | ||||||
| 2026-02-12 | 13F | BlackRock, Inc. | 136.075 | 3,87 | 946 | 11,97 | ||||
| 2026-02-13 | 13F | Aigen Investment Management, Lp | 11.199 | -71,03 | 78 | -69,08 | ||||
| 2026-02-17 | 13F | Schonfeld Strategic Advisors LLC | 147.083 | 902,34 | 1.022 | 987,23 | ||||
| 2026-02-17 | 13F | Toronto Dominion Bank | 147.956 | 702,19 | 1.027 | 770,34 | ||||
| 2026-02-17 | 13F | Millennium Management Llc | 1.836.137 | 290,78 | 12.758 | 321,16 | ||||
| 2026-02-17 | 13F | Toronto Dominion Bank | Call | 600 | -75,00 | 4 | -73,33 | |||
| 2026-02-13 | 13F | Marshall Wace, Llp | 604.481 | 4.201 | ||||||
| 2026-04-08 | 13F | Thompson Investment Management, Inc. | 0 | -100,00 | 0 | |||||
| 2026-01-22 | 13F | Glass Jacobson Investment Advisors llc | 372 | 0,00 | 3 | 0,00 | ||||
| 2026-02-10 | 13F | Norges Bank | 3.682.488 | 25.592 | ||||||
| 2026-02-17 | 13F | Two Sigma Advisers, Lp | 1.059.939 | 118,62 | 7.367 | 135,56 | ||||
| 2026-01-12 | 13F | Salem Investment Counselors Inc | 0 | -100,00 | 0 | |||||
| 2026-02-17 | 13F | Point72 Asset Management, L.P. | 1.359.740 | 403,61 | 9.450 | 442,79 | ||||
| 2026-02-10 | 13F | Goldman Sachs Group Inc | 5.143.641 | 65,67 | 35.748 | 78,51 | ||||
| 2026-02-12 | 13F | Brown Brothers Harriman & Co | 0 | -100,00 | 0 | |||||
| 2026-02-12 | 13F | Principal Securities, Inc. | 17.030 | 0,00 | 118 | 8,26 |