Grundlæggende statistik
| Institutionelle ejere | 151 total, 147 long only, 0 short only, 4 long/short - change of -6,21% MRQ |
| Gennemsnitlig porteføljeallokering | 0.5884 % - change of 21,79% MRQ |
| Institutionelle aktier (lange) | 33.678.508 (ex 13D/G) - change of -1,21MM shares -3,46% MRQ |
| Institutionel værdi (lang) | $ 481.507 USD ($1000) |
Institutionelt ejerskab og aktionærer
Bain Capital Specialty Finance, Inc. (US:BCSF) har 151 institutionelle ejere og aktionærer, der har indsendt 13D/G- eller 13F-formularer til Securities Exchange Commission (SEC). Disse institutioner har i alt 33,678,508 aktier. Største aktionærer omfatter Bain Capital Credit, LP, Bank Of America Corp /de/, UBS Group AG, Morgan Stanley, Cresset Asset Management, LLC, Van Eck Associates Corp, Melia Wealth LLC, BIZD - VanEck Vectors BDC Income ETF, Dimension Capital Management Llc, and Muzinich & Co., Inc. .
Bain Capital Specialty Finance, Inc. (NYSE:BCSF) institutionel ejerskabsstruktur viser aktuelle positioner i virksomheden efter institutioner og fonde, samt seneste ændringer i positionsstørrelse. Større aktionærer kan omfatte individuelle investorer, investeringsforeninger, hedgefonde eller institutioner. Skema 13D angiver, at investoren besidder (eller besidder) mere end 5 % af virksomheden og har til hensigt (eller har til hensigt at) aktivt at forfølge en ændring i forretningsstrategi. Skema 13G indikerer en passiv investering på over 5%.
The share price as of September 10, 2025 is 15,48 / share. Previously, on September 11, 2024, the share price was 16,62 / share. This represents a decline of 6,86% over that period.

Fondens stemningsscore
Fund Sentiment Score (fka Ownership Accumulation Score) finder de aktier, der bliver mest købt af fonde. Det er resultatet af en sofistikeret, multi-faktor kvantitativ model, der identificerer virksomheder med de højeste niveauer af institutionel akkumulering. Scoringsmodellen bruger en kombination af den samlede stigning i oplyste ejere, ændringerne i porteføljeallokeringer i disse ejere og andre målinger. Tallet går fra 0 til 100, hvor højere tal indikerer et højere niveau af akkumulering for sine jævnaldrende, og 50 er gennemsnittet.
Opdateringsfrekvens: Dagligt
Se Ownership Explorer, som giver en liste over højest rangerende virksomheder.
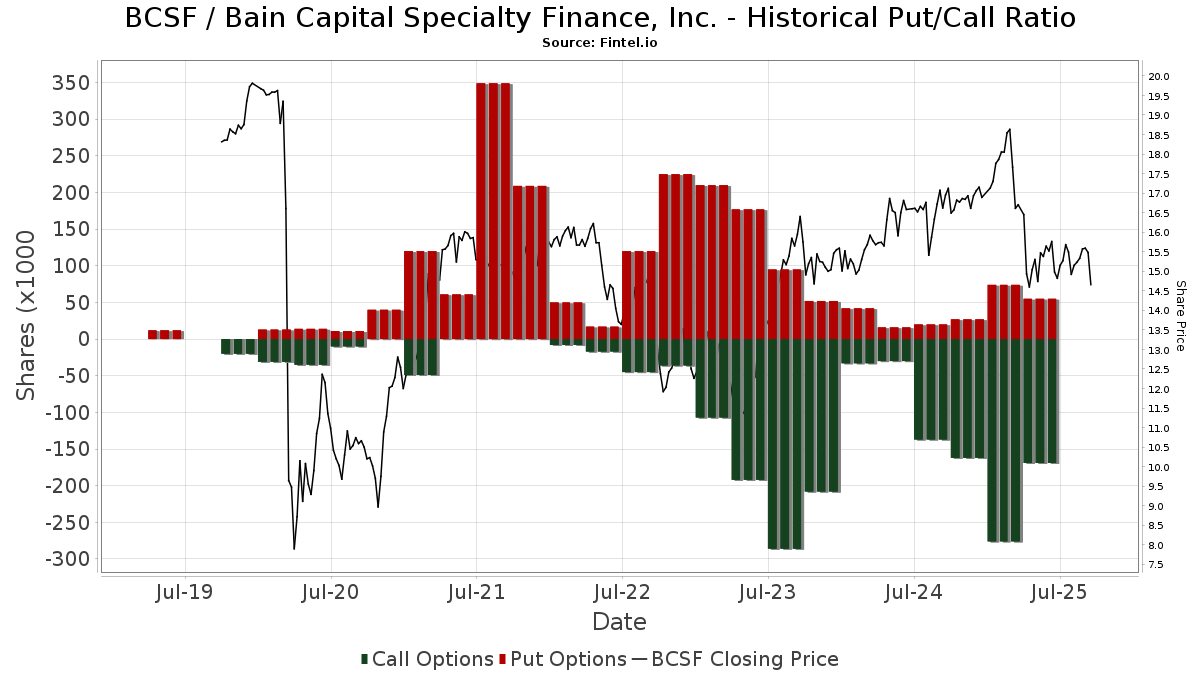
Institutionel Put/Call-forhold
Ud over at indberette standardaktie- og gældsudstedelser skal institutter med mere end 100 mill. aktiver under forvaltning også oplyse deres put- og call-optionsbeholdninger. Da salgsoptioner generelt indikerer negativ stemning, og købsoptioner indikerer positiv stemning, kan vi få en fornemmelse af den overordnede institutionelle stemning ved at plotte forholdet mellem put og kald. Diagrammet til højre viser det historiske put/call-forhold for dette instrument.
Brug af Put/Call Ratio som en indikator for investorernes stemning overvinder en af de vigtigste mangler ved at bruge totalt institutionelt ejerskab, som er, at en betydelig mængde af aktiver under forvaltning investeres passivt for at spore indekser. Passivt forvaltede fonde køber typisk ikke optioner, så indikatoren for put/call-forholdet følger mere nøje følelsen af aktivt forvaltede fonde.
13F og NPORT arkivering
Detaljer om 13F-arkivering er gratis. Detaljer om NP-ansøgninger kræver et premium-medlemskab. Grønne rækker angiver nye positioner. Røde rækker angiver lukkede positioner. Klik på linket ikon for at se den fulde transaktionshistorik.
Opgrader
for at låse premium-data op og eksportere til Excel ![]() .
.
| Fil dato | Kilde | Investor | Type | Gennemsnitlig pris (Øst) |
Aktier | Δ Aktier (%) |
Rapporteret Værdi ($1000) |
Δ Værdi (%) |
Port Alloc (%) |
|
|---|---|---|---|---|---|---|---|---|---|---|
| 2025-08-14 | 13F | Van Eck Associates Corp | 1.124.640 | 7,71 | 17 | -5,88 | ||||
| 2025-07-10 | 13F | Oliver Lagore Vanvalin Investment Group | 166 | 5,06 | 3 | 0,00 | ||||
| 2025-08-14 | 13F | Two Sigma Investments, Lp | 119.394 | -56,94 | 1.796 | -61,00 | ||||
| 2025-07-17 | 13F | Janney Montgomery Scott LLC | 84.060 | 8,87 | 1 | 0,00 | ||||
| 2025-08-14 | 13F | Boston Private Wealth Llc | 0 | -100,00 | 0 | -100,00 | ||||
| 2025-07-14 | 13F | AdvisorNet Financial, Inc | 500 | 0,00 | 8 | -12,50 | ||||
| 2025-07-16 | 13F | Eagle Global Advisors Llc | 19.910 | 0,00 | 299 | -9,39 | ||||
| 2025-07-31 | 13F | Cambridge Investment Research Advisors, Inc. | 54.527 | -0,04 | 1 | |||||
| 2025-08-12 | 13F | Trexquant Investment LP | 33.945 | -43,86 | 511 | -49,15 | ||||
| 2025-07-15 | 13F | Norden Group Llc | 24.259 | 9,20 | 365 | -1,09 | ||||
| 2025-08-12 | 13F | MAI Capital Management | 5.181 | 0,00 | 78 | -10,47 | ||||
| 2025-08-06 | 13F | First Horizon Advisors, Inc. | 0 | -100,00 | 0 | |||||
| 2025-07-29 | 13F | International Assets Investment Management, Llc | 31.839 | 0,00 | 479 | -9,47 | ||||
| 2025-08-14 | 13F | Qube Research & Technologies Ltd | 173.102 | 65,26 | 2.603 | 49,77 | ||||
| 2025-05-12 | 13F | Connor, Clark & Lunn Investment Management Ltd. | 0 | -100,00 | 0 | |||||
| 2025-08-14 | 13F | Tudor Investment Corp Et Al | 0 | -100,00 | 0 | |||||
| 2025-08-13 | 13F | Invesco Ltd. | 84.111 | 12,01 | 1.265 | 1,52 | ||||
| 2025-07-14 | 13F | Gries Financial Llc | 207.443 | -3,45 | 3.120 | -12,54 | ||||
| 2025-08-15 | 13F | Great West Life Assurance Co /can/ | 51.245 | 1,43 | 1 | |||||
| 2025-08-14 | 13F | Aquatic Capital Management LLC | 9.587 | -81,05 | 144 | -82,84 | ||||
| 2025-07-28 | 13F | Harbour Investments, Inc. | 0 | -100,00 | 0 | |||||
| 2025-07-18 | 13F | Rogco, Lp | 340 | 0,00 | 5 | 0,00 | ||||
| 2025-08-08 | 13F | Starr Indemnity & Liability Co | 0 | -100,00 | 0 | |||||
| 2025-08-14 | 13F | Citadel Advisors Llc | Call | 32.300 | -72,74 | 486 | -75,34 | |||
| 2025-08-14 | 13F | Citadel Advisors Llc | Put | 27.400 | -8,05 | 412 | -16,60 | |||
| 2025-07-24 | 13F | Us Bancorp \de\ | 0 | -100,00 | 0 | |||||
| 2025-09-10 | NP | Putnam ETF Trust - Putnam BDC ETF - | 453.844 | 10,18 | 6.808 | 8,01 | ||||
| 2025-08-14 | 13F | Citadel Advisors Llc | 46.225 | -76,68 | 695 | -78,88 | ||||
| 2025-08-04 | 13F | Muzinich & Co., Inc. | 553.802 | 52,97 | 8.329 | 38,61 | ||||
| 2025-08-14 | 13F | Mariner, LLC | 169.657 | 1,25 | 2.552 | -8,30 | ||||
| 2025-09-04 | 13F/A | Advisor Group Holdings, Inc. | 42.763 | -4,39 | 643 | -13,34 | ||||
| 2025-07-28 | 13F | Melia Wealth LLC | 990.732 | 6,31 | 14.901 | -3,68 | ||||
| 2025-08-19 | 13F | National Asset Management, Inc. | 20.067 | 302 | ||||||
| 2025-08-11 | 13F | HighTower Advisors, LLC | 71.167 | 0,21 | 1.070 | -9,17 | ||||
| 2025-07-15 | 13F | Graypoint LLC | 112.253 | 2,39 | 1.688 | -7,20 | ||||
| 2025-08-13 | 13F | PharVision Advisers, LLC | 13.839 | -26,89 | 208 | -33,76 | ||||
| 2025-08-06 | 13F | Texas Yale Capital Corp. | 146.832 | -8,66 | 2.208 | -17,24 | ||||
| 2025-08-08 | 13F | Creative Planning | 10.565 | 3,83 | 159 | -5,95 | ||||
| 2025-08-14 | 13F | Group One Trading, L.p. | Call | 17.700 | 55,26 | 266 | 40,74 | |||
| 2025-07-25 | 13F | Cwm, Llc | 383 | 19,69 | 0 | |||||
| 2025-08-14 | 13F | Group One Trading, L.p. | Put | 7.900 | -31,30 | 119 | -37,89 | |||
| 2025-08-14 | 13F | Verition Fund Management LLC | 0 | -100,00 | 0 | |||||
| 2025-08-13 | 13F | Lansforsakringar Fondforvaltning AB (publ) | 0 | -100,00 | 0 | |||||
| 2025-08-14 | 13F | Hrt Financial Lp | 97.681 | 114,58 | 1 | |||||
| 2025-08-12 | 13F | Jpmorgan Chase & Co | 172.508 | -34,24 | 2.595 | -40,42 | ||||
| 2025-08-13 | 13F | Mackenzie Financial Corp | 0 | -100,00 | 0 | |||||
| 2025-08-13 | 13F | Townsquare Capital Llc | 0 | -100,00 | 0 | |||||
| 2025-08-01 | 13F | Y-Intercept (Hong Kong) Ltd | 52.743 | 793 | ||||||
| 2025-08-14 | 13F | Jane Street Group, Llc | 18.645 | 280 | ||||||
| 2025-08-11 | 13F | United Advisor Group, LLC | 75.169 | -2,69 | 1.131 | -11,86 | ||||
| 2025-04-28 | 13F | Strategic Financial Concepts, LLC | 0 | -100,00 | 0 | -100,00 | ||||
| 2025-06-30 | NP | PSP - Invesco Global Listed Private Equity ETF This fund is a listed as child fund of Invesco Ltd. and if that institution has disclosed ownership in this security, then these positions will not be double counted when calculating total shares and total value | 34.659 | -21,60 | 530 | -34,00 | ||||
| 2025-07-22 | 13F | Mascoma Wealth Management LLC | 0 | -100,00 | 0 | |||||
| 2025-08-06 | 13F | Ethos Financial Group, LLC | 35.077 | 0,00 | 528 | -9,45 | ||||
| 2025-07-14 | 13F | GAMMA Investing LLC | 54 | 0,00 | 1 | |||||
| 2025-08-12 | 13F | Heritage Trust Co | 91.150 | 1.371 | ||||||
| 2025-07-31 | 13F | Sumitomo Mitsui Trust Holdings, Inc. | 446.968 | 27,98 | 6.722 | 15,96 | ||||
| 2025-08-14 | 13F | Wells Fargo & Company/mn | 135.826 | -61,88 | 2.043 | -65,47 | ||||
| 2025-08-12 | 13F | Virtu Financial LLC | 18.487 | 17,07 | 0 | |||||
| 2025-08-11 | 13F | Nomura Asset Management Co Ltd | 0 | -100,00 | 0 | |||||
| 2025-08-15 | 13F | Tower Research Capital LLC (TRC) | 81 | -92,20 | 1 | -94,12 | ||||
| 2025-08-12 | 13F | Advisors Asset Management, Inc. | 244.664 | -3,89 | 3.680 | -12,92 | ||||
| 2025-05-15 | 13F | Cura Wealth Advisors, Llc | 0 | -100,00 | 0 | |||||
| 2025-05-12 | 13F | Simplex Trading, Llc | 0 | -100,00 | 0 | |||||
| 2025-08-14 | 13F | PDT Partners, LLC | 13.556 | -76,45 | 204 | -78,74 | ||||
| 2025-08-14 | 13F | Quarry LP | 4.570 | -24,12 | 69 | -31,31 | ||||
| 2025-08-13 | 13F | Jones Financial Companies Lllp | 500 | 0,00 | 7 | -12,50 | ||||
| 2025-07-14 | 13F | U.S. Capital Wealth Advisors, LLC | 12.300 | 185 | ||||||
| 2025-04-24 | 13F | Mirae Asset Global Investments Co., Ltd. | 0 | -100,00 | 0 | |||||
| 2025-07-23 | 13F | Columbus Macro, LLC | 0 | -100,00 | 0 | |||||
| 2025-07-25 | NP | First Trust Specialty Finance & Financial Opportunities Fund This fund is a listed as child fund of First Trust Advisors Lp and if that institution has disclosed ownership in this security, then these positions will not be double counted when calculating total shares and total value | 100.000 | 0,00 | 1.572 | -17,57 | ||||
| 2025-08-15 | 13F | CI Private Wealth, LLC | 15.419 | -39,32 | 232 | -45,13 | ||||
| 2025-08-13 | 13F | Marshall Wace, Llp | 65.181 | 980 | ||||||
| 2025-08-15 | 13F | Kestra Advisory Services, LLC | 119.311 | 1,62 | 1.794 | -7,95 | ||||
| 2025-08-07 | 13F | Allworth Financial LP | 163.010 | -33,48 | 2.452 | -35,21 | ||||
| 2025-08-14 | 13F | Comerica Bank | 19.149 | 5,45 | 288 | -4,32 | ||||
| 2025-08-14 | 13F | Diversify Advisory Services, LLC | 23.143 | 5,44 | 351 | 3,24 | ||||
| 2025-05-15 | 13F | Talon Private Wealth, LLC | 0 | -100,00 | 0 | -100,00 | ||||
| 2025-07-25 | 13F | Concurrent Investment Advisors, LLC | 13.370 | -22,94 | 201 | -29,97 | ||||
| 2025-08-06 | 13F | Commonwealth Equity Services, Llc | 102.594 | 0,79 | 2 | 0,00 | ||||
| 2025-07-11 | 13F | Seacrest Wealth Management, Llc | 30.940 | 90,40 | 465 | 72,86 | ||||
| 2025-07-31 | 13F | MQS Management LLC | 19.171 | 81,29 | 288 | 64,57 | ||||
| 2025-08-15 | 13F | WFA of San Diego, LLC | 100 | 0,00 | 2 | 0,00 | ||||
| 2025-08-11 | 13F | Anfield Capital Management, LLC | 7.995 | 0,00 | 120 | -9,09 | ||||
| 2025-08-13 | 13F | ExodusPoint Capital Management, LP | 0 | -100,00 | 0 | |||||
| 2025-08-14 | 13F | Bain Capital Credit, LP | 11.822.433 | 0,00 | 177.809 | -9,40 | ||||
| 2025-08-14 | 13F | Federation des caisses Desjardins du Quebec | 75 | -86,96 | 1 | -88,89 | ||||
| 2025-08-14 | 13F | Ameriprise Financial Inc | 178.463 | 15,70 | 2.639 | 2,97 | ||||
| 2025-04-21 | 13F | Beacon Capital Management, LLC | 0 | -100,00 | 0 | |||||
| 2025-08-14 | 13F | BI Asset Management Fondsmaeglerselskab A/S | 43.977 | 2,99 | 1 | |||||
| 2025-08-14 | 13F | Lazard Asset Management Llc | 0 | -100,00 | 0 | |||||
| 2025-08-14 | 13F | Colony Group, LLC | 17.231 | 0,00 | 259 | -9,44 | ||||
| 2025-08-14 | 13F | Two Sigma Advisers, Lp | 413.700 | -15,88 | 6.222 | -23,78 | ||||
| 2025-05-14 | 13F | Northwestern Mutual Wealth Management Co | 0 | -100,00 | 0 | -100,00 | ||||
| 2025-08-13 | 13F | Lido Advisors, LLC | 55.524 | -4,97 | 835 | -13,83 | ||||
| 2025-08-08 | 13F | CFO4Life Group, LLC | 30.908 | 2,78 | 465 | -7,01 | ||||
| 2025-08-15 | 13F | Resources Management Corp /ct/ /adv | 0 | -100,00 | 0 | |||||
| 2025-08-25 | 13F/A | Neuberger Berman Group LLC | 128.823 | 10,83 | 1.937 | 0,41 | ||||
| 2025-08-14 | 13F/A | Rockefeller Capital Management L.P. | 366.542 | 12,96 | 5.513 | 2,34 | ||||
| 2025-08-18 | 13F | Wolverine Trading, Llc | Call | 17.700 | -1,12 | 264 | -11,71 | |||
| 2025-07-16 | 13F | Formidable Asset Management, LLC | 29.447 | 0,00 | 489 | 0,00 | ||||
| 2025-08-01 | 13F | Envestnet Asset Management Inc | 0 | -100,00 | 0 | |||||
| 2025-07-18 | 13F | First Pacific Financial | 0 | -100,00 | 0 | |||||
| 2025-08-07 | 13F | Hennion & Walsh Asset Management, Inc. | 433.062 | -4,82 | 6.513 | -13,77 | ||||
| 2025-08-12 | 13F | Steward Partners Investment Advisory, Llc | 3.604 | 52,52 | 54 | 38,46 | ||||
| 2025-08-13 | 13F | Centiva Capital, LP | 0 | -100,00 | 0 | |||||
| 2025-08-18 | 13F/A | National Bank Of Canada /fi/ | 134 | 2 | ||||||
| 2025-08-14 | 13F | Mml Investors Services, Llc | 26.417 | 14,13 | 0 | |||||
| 2025-08-04 | 13F | Canton Hathaway, LLC | 27.375 | 4,58 | 0 | |||||
| 2025-08-14 | 13F | Financial Network Wealth Advisors LLC | 556 | 0,00 | 8 | -11,11 | ||||
| 2025-08-14 | 13F | Dimension Capital Management Llc | 610.523 | 12,57 | 9.182 | 2,00 | ||||
| 2025-08-12 | 13F | SRS Capital Advisors, Inc. | 5.000 | 75 | ||||||
| 2025-05-08 | 13F | XTX Topco Ltd | 0 | -100,00 | 0 | |||||
| 2025-08-14 | 13F | Advisor OS, LLC | 21.026 | 2,78 | 316 | -6,78 | ||||
| 2025-08-05 | 13F | Seelaus Asset Management LLC | 13.300 | 0,00 | 200 | -9,09 | ||||
| 2025-04-21 | 13F | Nelson, Van Denburg & Campbell Wealth Management Group, LLC | 0 | -100,00 | 0 | |||||
| 2025-07-23 | 13F | Hager Investment Management Services, Llc | 164.142 | 6,81 | 2.469 | -3,22 | ||||
| 2025-08-08 | 13F | Cetera Investment Advisers | 0 | -100,00 | 0 | |||||
| 2025-06-27 | NP | LBO - WHITEWOLF Publicly Listed Private Equity ETF | 6.870 | 14,27 | 105 | -3,67 | ||||
| 2025-08-14 | 13F | Cubist Systematic Strategies, LLC | 16.405 | -86,55 | 247 | -87,85 | ||||
| 2025-08-13 | 13F | Mount Yale Investment Advisors, LLC | 63.673 | -0,67 | 958 | -10,06 | ||||
| 2025-08-19 | 13F | Advisory Services Network, LLC | 13.435 | 10,28 | 202 | -0,50 | ||||
| 2025-08-14 | 13F | Ares Management Llc | 68.595 | 0,00 | 1.032 | -9,40 | ||||
| 2025-08-07 | 13F | Campbell & CO Investment Adviser LLC | 65.559 | 22,60 | 986 | 11,16 | ||||
| 2025-07-15 | 13F | Foster Victor Wealth Advisors, LLC | 22.000 | 0,00 | 336 | 7,03 | ||||
| 2025-07-30 | 13F | Onyx Bridge Wealth Group LLC | 23.482 | -28,65 | 353 | -35,35 | ||||
| 2025-05-14 | 13F | Van Hulzen Asset Management, LLC | 0 | -100,00 | 0 | -100,00 | ||||
| 2025-08-14 | 13F | Bnp Paribas Arbitrage, Sa | 900 | 14 | ||||||
| 2025-08-21 | NP | BIZD - VanEck Vectors BDC Income ETF | 837.686 | 1,48 | 12.599 | -8,06 | ||||
| 2025-08-13 | 13F | Garner Asset Management Corp | 76.515 | 162,60 | 1.151 | 138,10 | ||||
| 2025-08-14 | 13F | KKM Financial LLC | 19.428 | 15,45 | 292 | 4,66 | ||||
| 2025-07-01 | 13F | Confluence Investment Management Llc | 120.930 | 0,40 | 1.819 | -9,05 | ||||
| 2025-08-12 | 13F | Dynamic Technology Lab Private Ltd | 32.526 | -3,05 | 489 | -12,21 | ||||
| 2025-08-11 | 13F | Mill Creek Capital Advisors, LLC | 12.092 | 0,00 | 182 | -9,50 | ||||
| 2025-08-15 | 13F | WealthCollab, LLC | 0 | -100,00 | 0 | |||||
| 2025-08-07 | 13F | Acadian Asset Management Llc | 1.587 | -11,14 | 0 | |||||
| 2025-05-13 | 13F | GKV Capital Management Co., Inc. | 0 | -100,00 | 0 | |||||
| 2025-08-05 | 13F | GPS Wealth Strategies Group, LLC | 2.682 | 38,82 | 40 | 25,00 | ||||
| 2025-08-08 | 13F | SG Americas Securities, LLC | 19.048 | 0 | ||||||
| 2025-08-13 | 13F | Cresset Asset Management, LLC | 1.201.483 | -8,53 | 18.070 | -17,12 | ||||
| 2025-08-14 | 13F | Raymond James Financial Inc | 94.791 | 8,78 | 1.426 | -1,45 | ||||
| 2025-08-11 | 13F | Citigroup Inc | 12.723 | 286,83 | 191 | 253,70 | ||||
| 2025-07-16 | 13F | Register Financial Advisors LLC | 8.404 | 1,20 | 126 | -8,03 | ||||
| 2025-08-12 | 13F | One Charles Private Wealth Services, LLC | 11.552 | 3,00 | 174 | -6,99 | ||||
| 2025-07-21 | 13F | Catalina Capital Group, LLC | 19.306 | 290 | ||||||
| 2025-08-12 | 13F | Bokf, Na | 9.750 | 0,00 | 147 | -9,32 | ||||
| 2025-07-24 | 13F | Ronald Blue Trust, Inc. | 9.422 | 3,00 | 142 | -6,62 | ||||
| 2025-08-13 | 13F | Jump Financial, LLC | 60.622 | 402,63 | 912 | 355,50 | ||||
| 2025-08-14 | 13F | Bank Of America Corp /de/ | 4.393.528 | -0,39 | 66.079 | -9,75 | ||||
| 2025-07-10 | 13F | Wealth Enhancement Advisory Services, Llc | 0 | -100,00 | 0 | |||||
| 2025-08-01 | 13F | First National Trust Co | 121.720 | 0,00 | 1.831 | -9,41 | ||||
| 2025-07-28 | 13F | Mutual Advisors, LLC | 14.890 | -5,53 | 228 | -6,97 | ||||
| 2025-05-14 | 13F | Virtus ETF Advisers LLC | 0 | -100,00 | 0 | |||||
| 2025-08-14 | 13F | State Street Corp | 61.814 | 257,76 | 930 | 224,83 | ||||
| 2025-07-29 | 13F | Harbor Asset Planning, Inc. | 622 | 9 | ||||||
| 2025-05-15 | 13F | Keel Point, LLC | 0 | -100,00 | 0 | |||||
| 2025-08-14 | 13F | Susquehanna International Group, Llp | 11.854 | 178 | ||||||
| 2025-08-14 | 13F | Susquehanna International Group, Llp | Put | 17.600 | -33,33 | 265 | -39,73 | |||
| 2025-08-14 | 13F | UBS Group AG | 1.449.926 | 17,75 | 21.807 | 6,68 | ||||
| 2025-08-12 | 13F | Proequities, Inc. | Put | 0 | 0 | |||||
| 2025-08-14 | 13F | Susquehanna International Group, Llp | Call | 84.200 | -8,68 | 1.266 | -17,25 | |||
| 2025-07-16 | 13F | Beaumont Financial Advisors, LLC | 62.291 | 0,30 | 937 | -9,13 | ||||
| 2025-08-12 | 13F | Proequities, Inc. | Call | 0 | 0 | |||||
| 2025-08-12 | 13F | Proequities, Inc. | 0 | 0 | ||||||
| 2025-07-31 | 13F | Caitong International Asset Management Co., Ltd | 180 | 3 | ||||||
| 2025-08-12 | 13F | BlackRock, Inc. | 302.162 | 28,23 | 4.545 | 16,19 | ||||
| 2025-08-12 | 13F | Pathstone Holdings, LLC | 179.111 | 0,00 | 2.694 | -9,42 | ||||
| 2025-08-12 | 13F | LPL Financial LLC | 27.642 | 1,87 | 416 | -7,78 | ||||
| 2025-08-01 | 13F | Transcend Wealth Collective, Llc | 23.280 | 350 | ||||||
| 2025-05-14 | 13F | CIBC Private Wealth Group, LLC | 0 | -100,00 | 0 | |||||
| 2025-08-14 | 13F | Millennium Management Llc | 140.608 | -29,89 | 2.115 | -36,50 | ||||
| 2025-08-13 | 13F | Northern Trust Corp | 129.721 | 666,26 | 1.951 | 594,31 | ||||
| 2025-08-13 | 13F | Quantbot Technologies LP | 8.061 | 121 | ||||||
| 2025-06-25 | NP | VPC - Virtus Private Credit Strategy ETF | 44.467 | -12,69 | 680 | -26,49 | ||||
| 2025-08-13 | 13F | Virtus Investment Advisers, Inc. | 51.043 | 4,86 | 768 | -5,07 | ||||
| 2025-05-13 | 13F | Global Endowment Management, LP | 0 | -100,00 | 0 | |||||
| 2025-07-30 | 13F | Denali Advisors Llc | 35.359 | -2,55 | 532 | -11,79 | ||||
| 2025-08-14 | 13F | Wiley Bros.-aintree Capital, Llc | 35.379 | 8,95 | 532 | -1,85 | ||||
| 2025-08-05 | 13F | Simplex Trading, Llc | Put | 2.100 | -70,00 | 0 | ||||
| 2025-05-28 | NP | LUSIX - Lazard US Systematic Small Cap Equity Portfolio Institutional Shares | 5.616 | -12,00 | 93 | -16,22 | ||||
| 2025-08-12 | 13F | Legal & General Group Plc | 424.915 | -1,33 | 6.382 | -10,75 | ||||
| 2025-07-24 | 13F | Blair William & Co/il | 10.339 | 0,00 | 155 | -9,36 | ||||
| 2025-08-12 | 13F | Kimelman & Baird, LLC | 800 | 0,00 | 12 | -7,69 | ||||
| 2025-08-12 | 13F | Franklin Resources Inc | 448.139 | 23,84 | 6.740 | 12,22 | ||||
| 2025-07-29 | NP | SVYAX - SIIT U.S. Managed Volatility Fund - Class A | 13.021 | 205 | ||||||
| 2025-07-11 | 13F | Farther Finance Advisors, LLC | 14.560 | 13,26 | 219 | 1,87 | ||||
| 2025-07-16 | 13F | Prairiewood Capital, LLC | 14.267 | -3,67 | 215 | -12,65 | ||||
| 2025-08-05 | 13F | Simplex Trading, Llc | Call | 17.900 | -50,69 | 0 | ||||
| 2025-08-11 | 13F | Perennial Investment Advisors, LLC | 12.500 | 0,00 | 188 | -9,18 | ||||
| 2025-07-22 | 13F | Dougherty Wealth Advisers LLC | 50 | 0,00 | 1 | |||||
| 2025-05-05 | 13F | Transce3nd, LLC | 0 | -100,00 | 0 | |||||
| 2025-08-14 | 13F | Royal Bank Of Canada | 141.045 | 0,17 | 2.121 | -9,24 | ||||
| 2025-07-09 | 13F | Triumph Capital Management | 54.126 | 3,37 | 814 | -6,33 | ||||
| 2025-07-10 | 13F | Redhawk Wealth Advisors, Inc. | 91.521 | -3,41 | 1.376 | -12,47 | ||||
| 2025-08-15 | 13F | Morgan Stanley | 1.326.221 | 4,33 | 19.946 | -5,48 | ||||
| 2025-07-16 | 13F | Meridian Investment Counsel Inc. | 18.101 | -5,24 | 272 | -14,20 | ||||
| 2025-08-12 | 13F | Global Retirement Partners, LLC | 2.500 | 0,00 | 38 | -13,95 | ||||
| 2025-08-13 | 13F | Barclays Plc | 0 | -100,00 | 0 | |||||
| 2025-08-13 | 13F | Employees Retirement System of Texas | 14.064 | 0,00 | 0 | |||||
| 2025-07-18 | 13F | Cooper Financial Group | 13.597 | 14,44 | 205 | 3,55 | ||||
| 2025-08-12 | 13F | Magnetar Financial LLC | 0 | -100,00 | 0 | |||||
| 2025-08-14 | 13F | Balyasny Asset Management Llc | 0 | -100,00 | 0 |