Grundlæggende statistik
| Institutionelle aktier (lange) | 298.293.364 - 103,79% (ex 13D/G) - change of -22,13MM shares -6,91% MRQ |
| Institutionel værdi (lang) | $ 491.551 USD ($1000) |
Institutionelt ejerskab og aktionærer
Optimum Communications, Inc. (US:ATUS) har 177 institutionelle ejere og aktionærer, der har indsendt 13D/G- eller 13F-formularer til Securities Exchange Commission (SEC). Disse institutioner har i alt 298,293,364 aktier. Største aktionærer omfatter Vanguard Group Inc, Empyrean Capital Partners, LP, BlackRock, Inc., Deutsche Bank Ag\, Millennium Management Llc, D. E. Shaw & Co., Inc., Redwood Capital Management, Llc, King Street Capital Management, L.p., Goldman Sachs Group Inc, and Oaktree Capital Management Lp .
Optimum Communications, Inc. (NYSE:ATUS) institutionel ejerskabsstruktur viser aktuelle positioner i virksomheden efter institutioner og fonde, samt seneste ændringer i positionsstørrelse. Større aktionærer kan omfatte individuelle investorer, investeringsforeninger, hedgefonde eller institutioner. Skema 13D angiver, at investoren besidder (eller besidder) mere end 5 % af virksomheden og har til hensigt (eller har til hensigt at) aktivt at forfølge en ændring i forretningsstrategi. Skema 13G indikerer en passiv investering på over 5%.
The share price as of November 18, 2025 is 1,79 / share. Previously, on April 1, 2025, the share price was 2,69 / share. This represents a decline of 33,46% over that period.

Fondens stemningsscore
Fund Sentiment Score (fka Ownership Accumulation Score) finder de aktier, der bliver mest købt af fonde. Det er resultatet af en sofistikeret, multi-faktor kvantitativ model, der identificerer virksomheder med de højeste niveauer af institutionel akkumulering. Scoringsmodellen bruger en kombination af den samlede stigning i oplyste ejere, ændringerne i porteføljeallokeringer i disse ejere og andre målinger. Tallet går fra 0 til 100, hvor højere tal indikerer et højere niveau af akkumulering for sine jævnaldrende, og 50 er gennemsnittet.
Opdateringsfrekvens: Dagligt
Se Ownership Explorer, som giver en liste over højest rangerende virksomheder.
AI+ Ask Fintel’s AI assistant about Optimum Communications, Inc..
Select a question to share a public post with an AI-crafted answer.
Thinking of good questions…
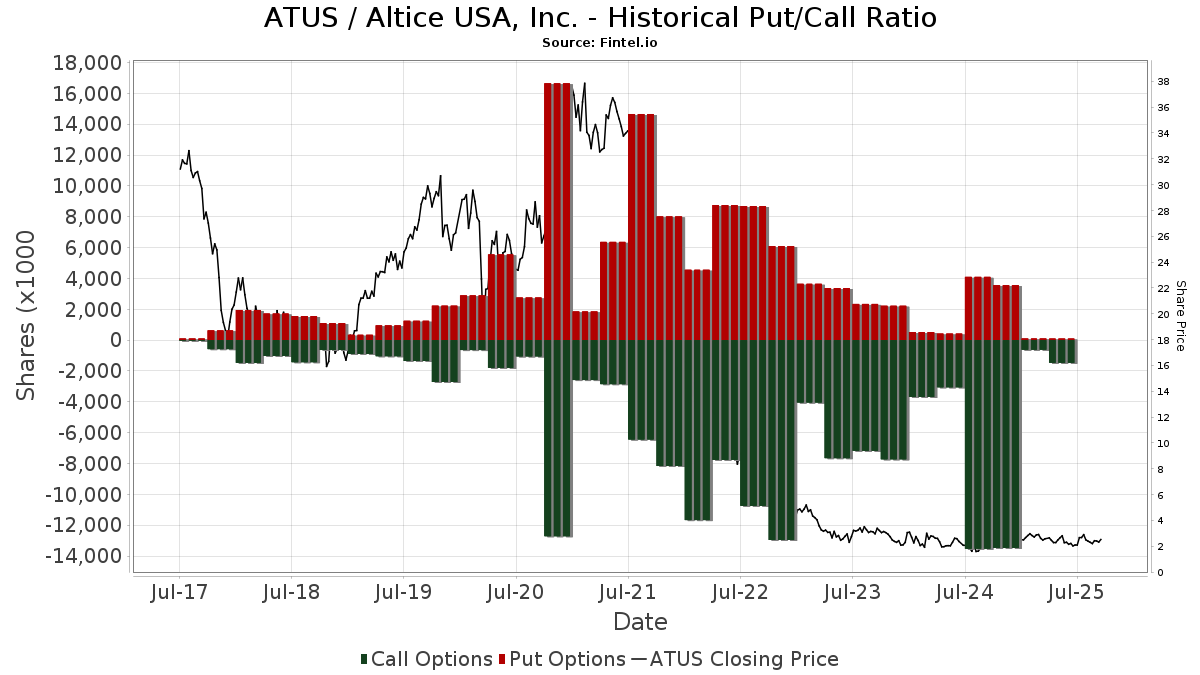
Institutionel Put/Call-forhold
Ud over at indberette standardaktie- og gældsudstedelser skal institutter med mere end 100 mill. aktiver under forvaltning også oplyse deres put- og call-optionsbeholdninger. Da salgsoptioner generelt indikerer negativ stemning, og købsoptioner indikerer positiv stemning, kan vi få en fornemmelse af den overordnede institutionelle stemning ved at plotte forholdet mellem put og kald. Diagrammet til højre viser det historiske put/call-forhold for dette instrument.
Brug af Put/Call Ratio som en indikator for investorernes stemning overvinder en af de vigtigste mangler ved at bruge totalt institutionelt ejerskab, som er, at en betydelig mængde af aktiver under forvaltning investeres passivt for at spore indekser. Passivt forvaltede fonde køber typisk ikke optioner, så indikatoren for put/call-forholdet følger mere nøje følelsen af aktivt forvaltede fonde.
13F og NPORT arkivering
Detaljer om 13F-arkivering er gratis. Detaljer om NP-ansøgninger kræver et premium-medlemskab. Grønne rækker angiver nye positioner. Røde rækker angiver lukkede positioner. Klik på linket ikon for at se den fulde transaktionshistorik.
Opgrader
for at låse premium-data op og eksportere til Excel ![]() .
.
| Fil dato | Kilde | Investor | Type | Gennemsnitlig pris (Øst) |
Aktier | Δ Aktier (%) |
Rapporteret Værdi ($1000) |
Δ Værdi (%) |
Port Alloc (%) |
|
|---|---|---|---|---|---|---|---|---|---|---|
| 2026-02-13 | 13F | First Trust Advisors Lp | 0 | -100,00 | 0 | |||||
| 2026-02-17 | 13F | Canada Pension Plan Investment Board | 131.400 | 147,92 | 217 | 70,08 | ||||
| 2026-02-13 | 13F | Ares Management Llc | 0 | -100,00 | 0 | |||||
| 2026-02-17 | 13F | Empyrean Capital Partners, LP | 25.028.407 | 8,35 | 41.297 | -25,82 | ||||
| 2026-02-17 | 13F | Diameter Capital Partners LP | 3.188.947 | -67,36 | 5.262 | -77,66 | ||||
| 2026-01-09 | 13F | SG Americas Securities, LLC | 46.414 | -3,39 | 0 | |||||
| 2026-02-03 | 13F | International Assets Investment Management, Llc | 24 | 0 | ||||||
| 2026-01-23 | 13F | Farther Finance Advisors, LLC | 97 | 0 | ||||||
| 2026-02-12 | 13F | New York State Common Retirement Fund | 23.800 | -71,22 | 39 | -80,40 | ||||
| 2025-11-06 | 13F | Ameritas Advisory Services, LLC | 0 | -100,00 | 0 | |||||
| 2026-02-11 | 13F | Primecap Management Co/ca/ | 0 | -100,00 | 0 | -100,00 | ||||
| 2025-11-13 | 13F | Total Investment Management Inc | 0 | -100,00 | 0 | |||||
| 2026-02-17 | 13F | Tower Research Capital LLC (TRC) | 13.022 | -47,18 | 21 | -64,41 | ||||
| 2026-02-17 | 13F | Clear Street Markets Llc | 0 | -100,00 | 0 | |||||
| 2026-02-12 | 13F | Nuveen, LLC | 571.757 | -11,60 | 943 | -39,47 | ||||
| 2026-02-13 | 13F | Ieq Capital, Llc | 70.252 | 12,09 | 116 | -23,84 | ||||
| 2025-11-10 | 13F | MAI Capital Management | 0 | -100,00 | 0 | |||||
| 2026-02-17 | 13F | DoubleLine ETF Adviser LP | 26.002 | 66,44 | 43 | 13,51 | ||||
| 2026-02-13 | 13F | Sterling Capital Management LLC | 13.055 | -15,32 | 22 | -43,24 | ||||
| 2026-02-13 | 13F | Ubs Asset Management Americas Inc | 552.695 | 5,43 | 912 | -27,87 | ||||
| 2026-02-10 | 13F | Quantbot Technologies LP | 96.035 | -42,55 | 158 | -60,70 | ||||
| 2025-10-30 | 13F | Ridgewood Investments LLC | 0 | -100,00 | 0 | |||||
| 2025-11-14 | 13F | Aristeia Capital Llc | 0 | -100,00 | 0 | |||||
| 2026-02-17 | 13F | Equitable Holdings, Inc. | 30.000 | 50 | ||||||
| 2026-02-17 | 13F | Balyasny Asset Management Llc | 0 | -100,00 | 0 | |||||
| 2026-02-17 | 13F | Kite Lake Capital Management (uk) Llp | 2.489.335 | 4.107 | ||||||
| 2026-02-13 | 13F | Pin Oak Investment Advisors Inc | 1.890 | -1,82 | 0 | -100,00 | ||||
| 2026-02-05 | 13F | Amalgamated Bank | 8.214 | -8,01 | 0 | |||||
| 2026-01-08 | 13F | Wealth Enhancement Advisory Services, Llc | 13.977 | -8,65 | 24 | -41,03 | ||||
| 2026-02-11 | 13F | Franklin Resources Inc | 0 | -100,00 | 0 | -100,00 | ||||
| 2026-02-11 | 13F | Group One Trading, L.p. | Call | 157.100 | -33,35 | 259 | -54,40 | |||
| 2026-02-11 | 13F | Group One Trading, L.p. | Put | 8.400 | -22,22 | 14 | -50,00 | |||
| 2026-02-06 | 13F | ProShare Advisors LLC | 47.778 | 6,88 | 79 | -27,10 | ||||
| 2026-02-17 | 13F | Optiver Holding B.V. | 3.023 | 37,97 | 5 | -20,00 | ||||
| 2026-01-28 | 13F | Teacher Retirement System Of Texas | 0 | -100,00 | 0 | |||||
| 2026-02-17 | 13F | Creative Planning | 36.769 | -0,38 | 61 | -31,82 | ||||
| 2026-01-14 | 13F | Pallas Capital Advisors LLC | 12.424 | 20 | ||||||
| 2026-02-13 | 13F | 140 Summer Partners LP | 3.095.473 | -2,03 | 5.108 | -32,93 | ||||
| 2025-11-14 | 13F | AXA Investment Managers S.A. | 28.200 | 68 | ||||||
| 2026-02-13 | 13F | Brooklands Fund Management Ltd | Call | 0 | -100,00 | 0 | ||||
| 2026-02-10 | 13F | Norges Bank | 4.623.111 | 7.628 | ||||||
| 2026-02-17 | 13F | Taconic Capital Advisors LP | 662.759 | -36,24 | 1.094 | -56,37 | ||||
| 2026-02-02 | 13F | Principal Financial Group Inc | 11.714 | -35,72 | 19 | -55,81 | ||||
| 2026-02-13 | 13F | Helix Partners Management LP | 1.250.000 | 2.062 | ||||||
| 2026-02-11 | 13F | Alta Fundamental Advisers LLC | 750.000 | 1.238 | ||||||
| 2026-02-17 | 13F | Russell Investments Group, Ltd. | 38.322 | 76,97 | 63 | 21,15 | ||||
| 2025-11-14 | 13F | Axa S.a. | 0 | -100,00 | 0 | -100,00 | ||||
| 2026-02-17 | 13F | MIRAE ASSET GLOBAL ETFS HOLDINGS Ltd. | 121.407 | -1,10 | 200 | -32,20 | ||||
| 2026-02-13 | 13F | State Street Corp | 6.161.091 | 7,15 | 10.166 | -26,64 | ||||
| 2026-02-17 | 13F | Susquehanna Fundamental Investments, Llc | 27.014 | -87,56 | 45 | -91,59 | ||||
| 2025-11-14 | 13F | Lazard Asset Management Llc | 0 | -100,00 | 0 | |||||
| 2026-02-09 | 13F | Optimize Financial Inc | 671.334 | 1,46 | 1.108 | -30,55 | ||||
| 2026-02-12 | 13F | Jane Street Group, Llc | 0 | -100,00 | 0 | -100,00 | ||||
| 2026-02-18 | 13F | Beacon Pointe Advisors, LLC | 10.000 | 16 | ||||||
| 2026-02-13 | 13F | Barclays Plc | 427.382 | -72,02 | 705 | -81,24 | ||||
| 2026-02-09 | 13F | Legal & General Group Plc | 264.244 | -0,58 | 436 | -31,87 | ||||
| 2026-02-12 | 13F | DRW Securities, LLC | 25.318 | 42 | ||||||
| 2026-02-06 | 13F | EverSource Wealth Advisors, LLC | 1.185 | 51,15 | 2 | 0,00 | ||||
| 2026-02-10 | 13F | Lido Advisors, LLC | 113.509 | 0,00 | 274 | 0,00 | ||||
| 2026-02-17 | 13F | Advisor Group Holdings, Inc. | 2.100 | -0,43 | 3 | -25,00 | ||||
| 2026-02-13 | 13F | Caitong International Asset Management Co., Ltd | 0 | -100,00 | 0 | |||||
| 2026-02-11 | 13F | Ameritas Investment Partners, Inc. | 21.842 | 36 | ||||||
| 2026-02-09 | 13F | Morningstar Investment Management LLC | 0 | -100,00 | 0 | |||||
| 2025-11-07 | 13F | May Hill Capital, LLC | 0 | -100,00 | 0 | -100,00 | ||||
| 2026-02-17 | 13F | Redwood Capital Management, Llc | 8.189.270 | 0,00 | 13.512 | -31,54 | ||||
| 2025-11-14 | 13F | Raymond James Financial Inc | 0 | -100,00 | 0 | -100,00 | ||||
| 2026-02-13 | 13F | Public Employees Retirement Association Of Colorado | 26.896 | 0,00 | 0 | |||||
| 2026-02-06 | 13F | Pnc Financial Services Group, Inc. | 0 | -100,00 | 0 | |||||
| 2026-02-17 | 13F | King Street Capital Management, L.p. | 8.032.126 | 98,89 | 13.253 | 36,18 | ||||
| 2026-02-13 | 13F | Great West Life Assurance Co /can/ | 43.905 | 0,00 | 0 | |||||
| 2026-02-11 | 13F | Jpmorgan Chase & Co | 7.333.165 | -16,70 | 12.100 | -42,97 | ||||
| 2026-02-17 | 13F | Fmr Llc | 4.120 | -15,85 | 7 | -45,45 | ||||
| 2025-11-21 | 13F/A | CIBC Bancorp USA Inc. | 27.870 | 67 | ||||||
| 2026-02-10 | 13F | BW Gestao de Investimentos Ltda. | 980.797 | 1.618 | ||||||
| 2026-02-17 | 13F | Advisory Services Network, LLC | 0 | -100,00 | 0 | |||||
| 2026-02-03 | 13F | SBI Securities Co., Ltd. | 114 | -42,71 | 0 | |||||
| 2025-11-12 | 13F | Neuberger Berman Group LLC | 0 | -100,00 | 0 | -100,00 | ||||
| 2026-02-17 | 13F | Jones Financial Companies Lllp | 172 | 0,00 | 0 | |||||
| 2026-02-17 | 13F | Paloma Partners Management Co | 2.347.922 | 4,45 | 3.874 | -28,48 | ||||
| 2026-02-10 | 13F | Intech Investment Management Llc | 92.631 | 0,00 | 153 | -31,84 | ||||
| 2026-02-13 | 13F | Y-Intercept (Hong Kong) Ltd | 10.871 | 18 | ||||||
| 2025-10-27 | 13F | Obermeyer Wood Investment Counsel, Lllp | 0 | -100,00 | 0 | -100,00 | ||||
| 2026-02-17 | 13F | Apollo Management Holdings, L.P. | 6.104.649 | -44,25 | 10.073 | -61,84 | ||||
| 2026-02-17 | 13F | J. Goldman & Co LP | 275.000 | 454 | ||||||
| 2026-02-17 | 13F | State Of Wisconsin Investment Board | 13.095 | -42,09 | 22 | -61,11 | ||||
| 2025-11-14 | 13F | Man Group plc | 0 | -100,00 | 0 | -100,00 | ||||
| 2026-02-13 | 13F | Squarepoint Ops LLC | 44.591 | -80,60 | 74 | -86,80 | ||||
| 2026-02-10 | 13F/A | Northwestern Mutual Wealth Management Co | 43.315 | -17,60 | 71 | -43,65 | ||||
| 2026-02-10 | 13F | Savant Capital, LLC | 0 | -100,00 | 0 | |||||
| 2026-01-16 | 13F | FNY Investment Advisers, LLC | 1.200 | 0 | ||||||
| 2026-02-17 | 13F | Susquehanna Portfolio Strategies, LLC | 243.688 | -29,06 | 402 | -51,39 | ||||
| 2026-02-13 | 13F | Sei Investments Co | 31.173 | 0,00 | 51 | -32,00 | ||||
| 2026-02-13 | 13F | Prudential Financial Inc | 15.330 | -52,12 | 25 | -67,53 | ||||
| 2025-11-14 | 13F | Credit Agricole S A | 0 | -100,00 | 0 | -100,00 | ||||
| 2026-02-13 | 13F | Rokos Capital Management LLP | 1.000.000 | 1.655 | ||||||
| 2025-11-14 | 13F | Graham Capital Management, L.P. | 0 | -100,00 | 0 | -100,00 | ||||
| 2026-02-02 | 13F | Wolverine Asset Management Llc | 475.441 | 0,00 | 784 | -31,53 | ||||
| 2026-02-17 | 13F | Oaktree Capital Management Lp | 7.500.000 | 0,00 | 12.375 | -31,54 | ||||
| 2026-01-28 | 13F | Arizona State Retirement System | 68.128 | -4,46 | 112 | -34,50 | ||||
| 2026-01-29 | 13F | Quent Capital, LLC | 0 | -100,00 | 0 | |||||
| 2026-02-13 | 13F | Rafferty Asset Management, LLC | 0 | -100,00 | 0 | |||||
| 2026-01-29 | 13F | UBS Group AG | 1.227.562 | 39,55 | 2.025 | -4,48 | ||||
| 2026-02-17 | 13F | Janus Henderson Group Plc | 94.299 | 0,00 | 156 | -31,28 | ||||
| 2026-02-13 | 13F | Rhumbline Advisers | 275.496 | -14,79 | 455 | -41,72 | ||||
| 2026-02-13 | 13F | Hudson Bay Capital Management LP | 6.249.991 | -7,41 | 10.312 | -36,61 | ||||
| 2026-02-17 | 13F | Northern Trust Corp | 1.971.618 | -7,69 | 3.253 | -36,80 | ||||
| 2026-02-13 | 13F | National Bank Of Canada /fi/ | 150 | 0,00 | 0 | |||||
| 2026-02-11 | 13F | Deseret Mutual Benefit Administrators | 1.201 | 0,00 | 2 | -50,00 | ||||
| 2026-02-13 | 13F | Mariner, LLC | 23.775 | 39 | ||||||
| 2026-02-13 | 13F | Wells Fargo & Company/mn | 394.643 | 85,42 | 651 | 27,15 | ||||
| 2026-02-13 | 13F | Senator Investment Group LP | 5.000.000 | 8.250 | ||||||
| 2026-02-10 | 13F | Eurizon Capital SGR S.p.A. | 13 | 0 | ||||||
| 2026-02-17 | 13F | Captrust Financial Advisors | 10.409 | 17 | ||||||
| 2026-02-17 | 13F | nVerses Capital, LLC | 44.686 | 74 | ||||||
| 2026-02-17 | 13F | Susquehanna International Group, Llp | Put | 0 | -100,00 | 0 | ||||
| 2026-02-17 | 13F | ExodusPoint Capital Management, LP | 0 | -100,00 | 0 | -100,00 | ||||
| 2026-02-17 | 13F | Dark Forest Capital Management Lp | 888.946 | -49,25 | 1.467 | -65,27 | ||||
| 2026-02-12 | 13F | Xponance, Inc. | 20.436 | 0,29 | 34 | -32,65 | ||||
| 2025-11-14 | 13F | Fiduciary Trust Co | 0 | -100,00 | 0 | -100,00 | ||||
| 2026-02-17 | 13F | Foursixthree Capital Lp | 4.639.586 | 14,40 | 7.655 | -21,68 | ||||
| 2025-11-04 | 13F | State of Wyoming | 0 | -100,00 | 0 | -100,00 | ||||
| 2026-02-10 | 13F | CIBC Asset Management Inc | 35.607 | 59 | ||||||
| 2026-02-13 | 13F | P Schoenfeld Asset Management Lp | 0 | -100,00 | 0 | |||||
| 2026-02-10 | 13F | Shenkman Capital Management Inc | 863.189 | -52,08 | 1.444 | -66,99 | ||||
| 2026-01-30 | 13F | Mitsubishi UFJ Trust & Banking Corp | 441.553 | -28,72 | 729 | -51,21 | ||||
| 2026-02-12 | 13F | Groupe la Francaise | 0 | -100,00 | 0 | |||||
| 2026-02-18 | 13F | Guardian Capital Lp | 0 | -100,00 | 0 | |||||
| 2026-02-17 | 13F | Algert Global Llc | 0 | -100,00 | 0 | |||||
| 2026-02-13 | 13F | Manufacturers Life Insurance Company, The | 0 | -100,00 | 0 | |||||
| 2026-02-23 | 13F | Virtu Financial LLC | 0 | -100,00 | 0 | |||||
| 2026-01-28 | 13F | Eos Management, L.P. | 58.800 | 0,00 | 97 | -31,21 | ||||
| 2026-02-13 | 13F | Victory Capital Management Inc | 28.256 | 5,34 | 47 | -28,12 | ||||
| 2026-02-13 | 13F | Police & Firemen's Retirement System of New Jersey | 72.472 | 0,00 | 120 | -31,61 | ||||
| 2026-02-19 | 13F | Invesco Ltd. | 446.106 | 2,48 | 736 | -29,84 | ||||
| 2026-02-13 | 13F | BNP Paribas Asset Management Holding S.A. | 32.212 | 1.267,81 | 0 | |||||
| 2026-02-13 | 13F | Citigroup Inc | 110.645 | -11,02 | 183 | -39,13 | ||||
| 2026-02-17 | 13F | Millennium Management Llc | 14.834.914 | 29,41 | 24.478 | -11,40 | ||||
| 2026-02-17 | 13F | Engineers Gate Manager LP | 0 | -100,00 | 0 | |||||
| 2026-02-06 | 13F | Leonteq Securities AG | 71.999 | 0,00 | 119 | -31,79 | ||||
| 2026-01-28 | 13F | Universal- Beteiligungs- und Servicegesellschaft mbH | 11.037 | 0,00 | 18 | -30,77 | ||||
| 2026-02-12 | 13F | Cibc World Markets Corp | 17.296 | -46,31 | 29 | -58,82 | ||||
| 2026-01-29 | 13F | Vanguard Group Inc | 27.879.788 | 1,74 | 46.002 | -30,35 | ||||
| 2025-11-14 | 13F | Two Sigma Advisers, Lp | 0 | -100,00 | 0 | -100,00 | ||||
| 2026-02-17 | 13F | Alliancebernstein L.p. | 236.500 | -13,97 | 390 | -41,09 | ||||
| 2026-03-05 | 13F | Sentinel Dome Partners, LLC | 200.000 | 330 | ||||||
| 2026-02-17 | 13F | Aqr Capital Management Llc | 1.347.744 | 34,15 | 2.204 | -6,06 | ||||
| 2026-02-12 | 13F | Federated Hermes, Inc. | 250.645 | 31,25 | 414 | -10,22 | ||||
| 2026-02-13 | 13F | Peak6 Llc | 242.600 | 400 | ||||||
| 2026-02-17 | 13F | Aquatic Capital Management LLC | 125.257 | 8,75 | 207 | -25,63 | ||||
| 2026-02-09 | 13F | Hartland & Co., LLC | 0 | -100,00 | 0 | |||||
| 2026-02-04 | 13F | Swiss Life Asset Management Ltd | 10.937 | 0,00 | 18 | -30,77 | ||||
| 2026-02-11 | 13F | Simplex Trading, Llc | Put | 10.600 | -53,71 | 17 | ||||
| 2026-02-11 | 13F | Allianz Asset Management GmbH | 302.601 | 11,36 | 499 | -23,70 | ||||
| 2025-10-27 | 13F | First Horizon Corp | 0 | -100,00 | 0 | |||||
| 2025-11-07 | 13F | Fifth Third Bancorp | 0 | -100,00 | 0 | |||||
| 2026-02-17 | 13F | HG Vora Capital Management, LLC | 2.300.000 | -25,81 | 3.795 | -49,20 | ||||
| 2026-02-17 | 13F | Readystate Asset Management Lp | 995.210 | 5.937,80 | 1.642 | 4.110,26 | ||||
| 2026-02-11 | 13F | Simplex Trading, Llc | 10.075 | 17 | ||||||
| 2026-02-11 | 13F | Simplex Trading, Llc | Call | 71.800 | -37,46 | 118 | ||||
| 2026-02-12 | 13F | Jane Street Group, Llc | Call | 108.600 | 69,95 | 179 | 16,99 | |||
| 2026-02-17 | 13F | Point72 Asset Management, L.P. | 1.886.212 | 59,17 | 3.112 | 9,00 | ||||
| 2026-02-12 | 13F | BlackRock, Inc. | 20.427.393 | 6,01 | 33.705 | -27,42 | ||||
| 2026-02-12 | 13F | Voya Investment Management Llc | 49.483 | 0,00 | 82 | -31,93 | ||||
| 2026-02-17 | 13F | D. E. Shaw & Co., Inc. | 9.508.306 | 0,76 | 15.689 | -31,01 | ||||
| 2026-02-20 | 13F | Sunbelt Securities, Inc. | 49 | 0 | ||||||
| 2026-02-17 | 13F | XTX Topco Ltd | 199.423 | 329 | ||||||
| 2026-02-17 | 13F | Cerberus Capital Management, L.P. | 3.940.785 | 0,00 | 6.502 | -31,54 | ||||
| 2026-02-17 | 13F | Saba Capital Management, L.P. | 1.356.888 | 1.026,51 | 2.239 | 671,72 | ||||
| 2026-02-13 | 13F | JustInvest LLC | 0 | -100,00 | 0 | |||||
| 2026-01-26 | 13F | Cwm, Llc | 29.132 | 25,22 | 0 | |||||
| 2026-03-30 | 13F/A | Barclays Plc | Call | 0 | -100,00 | 0 | ||||
| 2026-01-28 | 13F | Klp Kapitalforvaltning As | 88.500 | 102,52 | 146 | 39,05 | ||||
| 2026-01-29 | 13F | Pictet Asset Management Holding SA | 26.746 | 0,00 | 44 | -31,25 | ||||
| 2026-02-17 | 13F | California State Teachers Retirement System | 243.320 | -0,10 | 401 | -31,57 | ||||
| 2026-01-08 | 13F | True Wealth Design, LLC | 156 | -85,41 | 0 | -100,00 | ||||
| 2026-02-17 | 13F | Aster Capital Management (DIFC) Ltd | 618 | -61,01 | 1 | -66,67 | ||||
| 2026-02-17 | 13F | Citadel Advisors Llc | 3.298.726 | 65,06 | 5.443 | 13,00 | ||||
| 2026-02-05 | 13F | Tucker Asset Management Llc | 100 | 0 | ||||||
| 2026-03-06 | 13F | Hsbc Holdings Plc | 129.373 | 35,69 | 213 | -6,99 | ||||
| 2026-02-17 | 13F | Citadel Advisors Llc | Put | 46.300 | -0,86 | 76 | -32,14 | |||
| 2026-02-12 | 13F | MetLife Investment Management, LLC | 104.302 | -26,32 | 172 | -49,56 | ||||
| 2026-02-17 | 13F | Citadel Advisors Llc | Call | 124.500 | 75,60 | 205 | 20,59 | |||
| 2025-11-12 | 13F | South Dakota Investment Council | 0 | -100,00 | 0 | |||||
| 2026-02-12 | 13F | EntryPoint Capital, LLC | 69.037 | 114 | ||||||
| 2026-01-30 | 13F | R Squared Ltd | 0 | -100,00 | 0 | |||||
| 2026-02-13 | 13F | Verition Fund Management LLC | 440.292 | -12,12 | 726 | -39,85 | ||||
| 2026-02-17 | 13F | Silver Rock Financial LP | 2.800.000 | 133,33 | 4.620 | 59,75 | ||||
| 2026-02-13 | 13F | Carronade Capital Management, LP | 6.015.682 | 4,28 | 9.926 | -28,61 | ||||
| 2026-02-17 | 13F | Greenland Capital Management LP | 10.000 | 16 | ||||||
| 2026-02-12 | 13F | Renaissance Technologies Llc | 3.960.000 | -20,73 | 6.534 | -45,72 | ||||
| 2026-01-20 | 13F | Harbor Capital Advisors, Inc. | 29.905 | -1,68 | 0 | |||||
| 2026-02-17 | 13F | Nomura Holdings Inc | 7.420.520 | -27,96 | 12.244 | -50,68 | ||||
| 2025-11-14 | 13F | Wolverine Trading, Llc | Call | 10.900 | 1,87 | 26 | 13,64 | |||
| 2026-02-11 | 13F | Compass Rose Asset Management, LP | 500.000 | -80,00 | 825 | -86,31 | ||||
| 2026-02-17 | 13F | Voleon Capital Management Lp | 14.193 | 11,99 | 23 | -23,33 | ||||
| 2026-02-13 | 13F | SRS Capital Advisors, Inc. | 0 | -100,00 | 0 | |||||
| 2026-02-11 | 13F | Mount Capital Ltd | 3.889.664 | 0,00 | 6.418 | -31,54 | ||||
| 2026-02-17 | 13F | Mhr Fund Management Llc | 1.070.800 | 538,14 | 1.767 | 337,13 | ||||
| 2026-02-17 | 13F | Jain Global LLC | 0 | -100,00 | 0 | |||||
| 2026-02-09 | 13F | Jefferies Financial Group Inc. | Call | 261.900 | 432 | |||||
| 2026-02-09 | 13F | Jefferies Financial Group Inc. | 243.559 | -16,01 | 402 | -42,55 | ||||
| 2026-02-13 | 13F | Morgan Stanley | 4.307.488 | 3,37 | 7.107 | -29,23 | ||||
| 2026-02-11 | 13F | Deutsche Bank Ag\ | 16.445.267 | 26,82 | 27.135 | -13,18 | ||||
| 2026-02-12 | 13F | Dimensional Fund Advisors Lp | 2.695.189 | -10,02 | 4.447 | -38,40 | ||||
| 2026-02-18 | 13F | Mackenzie Financial Corp | 928.803 | 16,03 | 1.520 | -21,20 | ||||
| 2026-02-17 | 13F | Two Sigma Securities, Llc | 16.807 | 28 | ||||||
| 2026-02-10 | 13F | Goldman Sachs Group Inc | 7.596.080 | 8,46 | 12.534 | -25,74 | ||||
| 2025-10-29 | 13F | Massachusetts Financial Services Co /ma/ | 0 | -100,00 | 0 | |||||
| 2026-01-15 | 13F | Nisa Investment Advisors, Llc | 4.436 | 1.025,89 | 7 | |||||
| 2026-02-13 | 13F | Charles Schwab Investment Management Inc | 7.413.357 | 34,21 | 12.232 | -8,11 | ||||
| 2026-01-29 | 13F | Dunhill Financial, LLC | 7 | 0 | ||||||
| 2026-02-17 | 13F | Price T Rowe Associates Inc /md/ | 195.452 | 0,00 | 0 | |||||
| 2026-02-17 | 13F | CastleKnight Management LP | 5.104.410 | 40,86 | 8.422 | -3,56 | ||||
| 2026-02-09 | 13F | Geode Capital Management, Llc | 6.255.567 | 0,76 | 10.324 | -31,01 | ||||
| 2026-02-17 | 13F | Bank Of America Corp /de/ | 1.039.097 | 233,37 | 1.715 | 128,23 | ||||
| 2026-01-29 | 13F | Calamos Advisors LLC | 82.405 | 0,00 | 136 | -31,82 | ||||
| 2026-02-17 | 13F | Brevan Howard Capital Management LP | 0 | -100,00 | 0 | |||||
| 2026-02-10 | 13F | Bank of New York Mellon Corp | 717.510 | -5,35 | 1.184 | -35,25 | ||||
| 2026-02-17 | 13F | Royal Bank Of Canada | 1.715.434 | -73,73 | 2.830 | -82,01 | ||||
| 2026-02-19 | 13F | CI Private Wealth, LLC | 211.056 | 348 | ||||||
| 2026-01-27 | 13F | Zurcher Kantonalbank (Zurich Cantonalbank) | 119.001 | 46,75 | 196 | 0,51 | ||||
| 2026-01-23 | 13F | Ritholtz Wealth Management | 23.038 | 0,00 | 38 | -30,91 | ||||
| 2026-02-13 | 13F | AlTi Global, Inc. | 150.000 | 0,00 | 248 | -31,58 | ||||
| 2026-02-10 | 13F | Bnp Paribas Arbitrage, Sa | 57.160 | 7,93 | 94 | -25,98 | ||||
| 2026-02-06 | 13F | IFP Advisors, Inc | 127 | -41,20 | 0 | |||||
| 2026-02-17 | 13F | Susquehanna International Group, Llp | 103.184 | -14,57 | 170 | -41,58 | ||||
| 2026-02-06 | 13F | Covestor Ltd | 224 | 0 | ||||||
| 2026-02-17 | 13F | Susquehanna International Group, Llp | Call | 53.900 | -69,60 | 89 | -79,39 | |||
| 2026-02-17 | 13F | Sona Asset Management (us) Llc | 0 | -100,00 | 0 | |||||
| 2026-02-12 | 13F | Swiss National Bank | 467.200 | 0,00 | 771 | -31,56 | ||||
| 2026-01-26 | 13F | Merit Financial Group, LLC | 12.008 | 20 | ||||||
| 2026-02-05 | 13F | Allworth Financial LP | 0 | -100,00 | 0 | |||||
| 2025-12-09 | 13F/A | Tudor Investment Corp Et Al | 0 | -100,00 | 0 | -100,00 | ||||
| 2026-01-09 | 13F | Assenagon Asset Management S.A. | 0 | -100,00 | 0 | |||||
| 2026-02-05 | 13F | Pinnacle Associates Ltd | 101.880 | 0,21 | 168 | -31,43 | ||||
| 2026-02-17 | 13F | Bracebridge Capital, LLC | 3.131.018 | -45,33 | 5.166 | -62,57 | ||||
| 2026-02-10 | 13F | Bruni J V & Co /co | 0 | -100,00 | 0 | |||||
| 2026-02-14 | 13F | Rockefeller Capital Management L.P. | 400 | 0,00 | 1 | |||||
| 2026-02-12 | 13F | Loomis Sayles & Co L P | 5.084.853 | -0,14 | 8.390 | -31,63 | ||||
| 2026-02-17 | 13F | LMR Partners LLP | Call | 820.700 | 0,00 | 1.354 | -31,51 | |||
| 2026-02-17 | 13F | LMR Partners LLP | 978.034 | 95,61 | 1.614 | 33,86 | ||||
| 2026-02-17 | 13F | Two Sigma Investments, Lp | 108.663 | -93,26 | 179 | -95,39 | ||||
| 2026-02-17 | 13F | Mirabella Financial Services Llp | 90.000 | 148 |