Grundlæggende statistik
| Institutionelle ejere | 164 total, 160 long only, 0 short only, 4 long/short - change of 7,19% MRQ |
| Gennemsnitlig porteføljeallokering | 0.3865 % - change of 20,74% MRQ |
| Institutionelle aktier (lange) | 41.483.608 (ex 13D/G) - change of 25,05MM shares 152,37% MRQ |
| Institutionel værdi (lang) | $ 1.571.088 USD ($1000) |
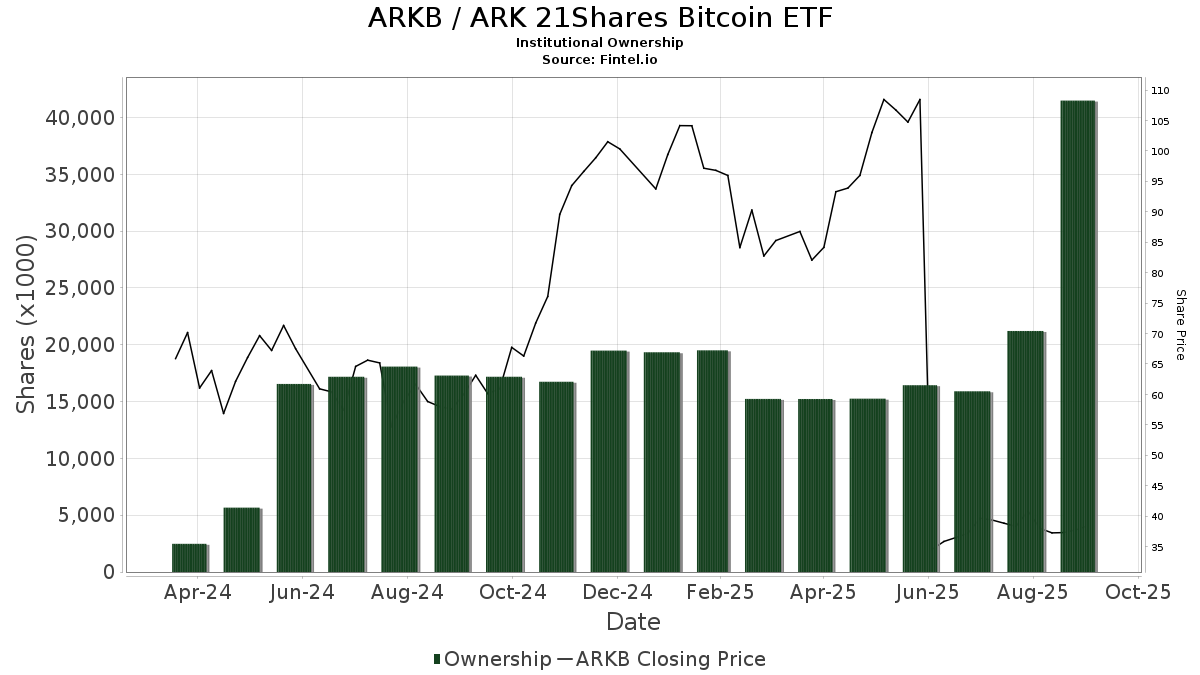
Institutionelt ejerskab og aktionærer
ARK 21Shares Bitcoin ETF (US:ARKB) har 164 institutionelle ejere og aktionærer, der har indsendt 13D/G- eller 13F-formularer til Securities Exchange Commission (SEC). Disse institutioner har i alt 41,483,608 aktier. Største aktionærer omfatter Jane Street Group, Llc, ARK Investment Management LLC, Millennium Management Llc, Schonfeld Strategic Advisors LLC, Hbk Investments L P, ARKW - ARK Next Generation Internet ETF, Apollo Management Holdings, L.P., Susquehanna International Group, Llp, Kaleidoscope Capital Lp, and ARKF - ARK Fintech Innovation ETF .
ARK 21Shares Bitcoin ETF (BATS:ARKB) institutionel ejerskabsstruktur viser aktuelle positioner i virksomheden efter institutioner og fonde, samt seneste ændringer i positionsstørrelse. Større aktionærer kan omfatte individuelle investorer, investeringsforeninger, hedgefonde eller institutioner. Skema 13D angiver, at investoren besidder (eller besidder) mere end 5 % af virksomheden og har til hensigt (eller har til hensigt at) aktivt at forfølge en ændring i forretningsstrategi. Skema 13G indikerer en passiv investering på over 5%.
The share price as of September 16, 2025 is 38,85 / share. Previously, on September 17, 2024, the share price was 19,97 / share. This represents an increase of 94,57% over that period.
Fondens stemningsscore
Fund Sentiment Score (fka Ownership Accumulation Score) finder de aktier, der bliver mest købt af fonde. Det er resultatet af en sofistikeret, multi-faktor kvantitativ model, der identificerer virksomheder med de højeste niveauer af institutionel akkumulering. Scoringsmodellen bruger en kombination af den samlede stigning i oplyste ejere, ændringerne i porteføljeallokeringer i disse ejere og andre målinger. Tallet går fra 0 til 100, hvor højere tal indikerer et højere niveau af akkumulering for sine jævnaldrende, og 50 er gennemsnittet.
Opdateringsfrekvens: Dagligt
Se Ownership Explorer, som giver en liste over højest rangerende virksomheder.
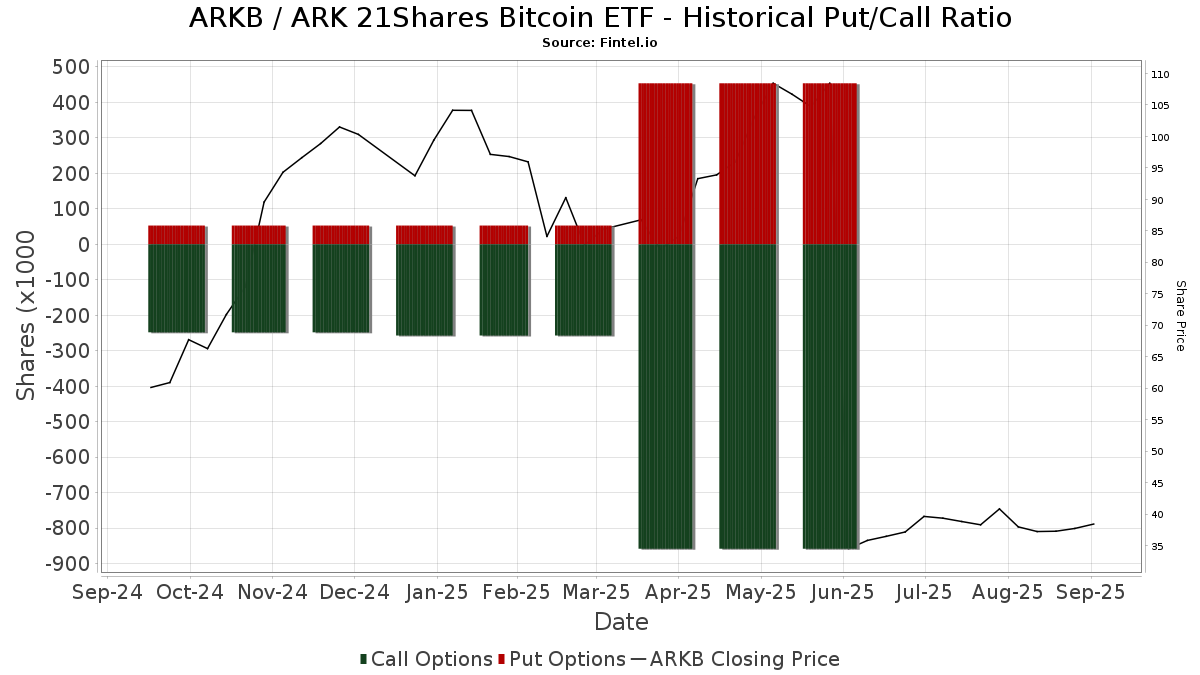
Institutionel Put/Call-forhold
Ud over at indberette standardaktie- og gældsudstedelser skal institutter med mere end 100 mill. aktiver under forvaltning også oplyse deres put- og call-optionsbeholdninger. Da salgsoptioner generelt indikerer negativ stemning, og købsoptioner indikerer positiv stemning, kan vi få en fornemmelse af den overordnede institutionelle stemning ved at plotte forholdet mellem put og kald. Diagrammet til højre viser det historiske put/call-forhold for dette instrument.
Brug af Put/Call Ratio som en indikator for investorernes stemning overvinder en af de vigtigste mangler ved at bruge totalt institutionelt ejerskab, som er, at en betydelig mængde af aktiver under forvaltning investeres passivt for at spore indekser. Passivt forvaltede fonde køber typisk ikke optioner, så indikatoren for put/call-forholdet følger mere nøje følelsen af aktivt forvaltede fonde.
13F og NPORT arkivering
Detaljer om 13F-arkivering er gratis. Detaljer om NP-ansøgninger kræver et premium-medlemskab. Grønne rækker angiver nye positioner. Røde rækker angiver lukkede positioner. Klik på linket ikon for at se den fulde transaktionshistorik.
Opgrader
for at låse premium-data op og eksportere til Excel ![]() .
.
| Fil dato | Kilde | Investor | Type | Gennemsnitlig pris (Øst) |
Aktier | Δ Aktier (%) |
Rapporteret Værdi ($1000) |
Δ Værdi (%) |
Port Alloc (%) |
|
|---|---|---|---|---|---|---|---|---|---|---|
| 2025-08-06 | 13F | Prospera Financial Services Inc | 71.631 | 2.564 | ||||||
| 2025-08-13 | 13F | Certior Financial Group, Llc | 15.000 | 193,54 | 537 | 27,62 | ||||
| 2025-08-14 | 13F | CIBC World Markets Inc. | 10.650 | 199,16 | 381 | 30,48 | ||||
| 2025-07-01 | 13F | Harbor Investment Advisory, Llc | 1.155 | 208,00 | 41 | 36,67 | ||||
| 2025-08-14 | 13F | Old Mission Capital Llc | 0 | -100,00 | 0 | |||||
| 2025-05-07 | 13F | Atlas Legacy Advisors, LLC | 0 | -100,00 | 0 | |||||
| 2025-08-14 | 13F | Two Sigma Securities, Llc | 12.137 | 210,57 | 434 | 35,20 | ||||
| 2025-08-08 | 13F | Woodley Farra Manion Portfolio Management Inc | 9.000 | 322 | ||||||
| 2025-05-16 | 13F/A | Kestra Investment Management, LLC | 0 | -100,00 | 0 | |||||
| 2025-08-14 | 13F | Citadel Advisors Llc | Put | 224.500 | 1.033,84 | 8.035 | 393,79 | |||
| 2025-08-12 | 13F | Titleist Asset Management, Llc | 478.234 | 197,86 | 17.116 | 29,69 | ||||
| 2025-08-18 | 13F | Geneos Wealth Management Inc. | 40.158 | 1.531,11 | 1.437 | 611,39 | ||||
| 2025-08-11 | 13F | HighTower Advisors, LLC | 90.336 | 214,43 | 3.233 | 36,93 | ||||
| 2025-07-15 | 13F | Well Done, LLC | 75.870 | 200,00 | 2.715 | 15,14 | ||||
| 2025-07-24 | 13F | Ronald Blue Trust, Inc. | 81.041 | 247,00 | 2.900 | 51,12 | ||||
| 2025-06-25 | NP | ARKF - ARK Fintech Innovation ETF | 636.601 | 0,00 | 59.770 | -7,34 | ||||
| 2025-08-13 | 13F | Hsbc Holdings Plc | 180.000 | 200,00 | 6.442 | 30,62 | ||||
| 2025-05-05 | 13F | Transce3nd, LLC | 0 | -100,00 | 0 | |||||
| 2025-04-30 | 13F | Kedalion Capital Management LLP | 0 | -100,00 | 0 | |||||
| 2025-08-05 | 13F | State Of Michigan Retirement System | 300.000 | 200,00 | 10.737 | 30,62 | ||||
| 2025-07-25 | 13F | Cwm, Llc | 7.045 | 231,06 | 0 | |||||
| 2025-04-18 | 13F | Pacific Capital Wealth Advisors, Inc | 0 | -100,00 | 0 | -100,00 | ||||
| 2025-08-14 | 13F | Mercer Global Advisors Inc /adv | 0 | -100,00 | 0 | |||||
| 2025-08-12 | 13F | Clark Financial Services Group Inc /bd | 12.229 | 202,17 | 438 | 31,63 | ||||
| 2025-08-04 | 13F | Hantz Financial Services, Inc. | 1.884 | 223,71 | 0 | |||||
| 2025-07-17 | 13F | Global Trust Asset Management, LLC | 600 | 21 | ||||||
| 2025-05-09 | 13F | Pnc Financial Services Group, Inc. | 0 | -100,00 | 0 | -100,00 | ||||
| 2025-07-24 | 13F | Cyndeo Wealth Partners, LLC | 385.551 | 205,69 | 13.799 | 33,10 | ||||
| 2025-08-14 | 13F | Sunbelt Securities, Inc. | 0 | -100,00 | 0 | |||||
| 2025-04-29 | 13F | Element Wealth, LLC | 0 | -100,00 | 0 | |||||
| 2025-08-14 | 13F | Q Fund Management (Hong Kong) Ltd | 24.000 | 200,00 | 859 | 30,59 | ||||
| 2025-04-29 | 13F | Hm Payson & Co | 30 | 0,00 | 2 | 0,00 | ||||
| 2025-08-08 | 13F | Creative Planning | 54.938 | 199,73 | 1.966 | 30,54 | ||||
| 2025-04-17 | 13F | Dynamic Advisor Solutions LLC | 0 | -100,00 | 0 | |||||
| 2025-07-17 | 13F | Mustard Seed Financial, LLC | 37.791 | 183,95 | 1.353 | 23,58 | ||||
| 2025-08-11 | 13F | NewEdge Wealth, LLC | 32.781 | 191,33 | 1.282 | 38,64 | ||||
| 2025-07-30 | 13F | ARK Investment Management LLC | 6.622.008 | 130,77 | 237.002 | 0,48 | ||||
| 2025-08-11 | 13F | Elequin Capital Lp | 280.830 | 94.138,26 | 10.051 | 41.775,00 | ||||
| 2025-09-04 | 13F/A | Advisor Group Holdings, Inc. | 2.754 | 225,15 | 99 | 42,03 | ||||
| 2025-08-04 | 13F | Grant Street Asset Management, Inc. | 9.000 | 322 | ||||||
| 2025-08-06 | 13F | Commonwealth Equity Services, Llc | 57.587 | 172,83 | 2 | 100,00 | ||||
| 2025-04-24 | 13F | Decker Retirement Planning Inc. | 0 | -100,00 | 0 | |||||
| 2025-07-11 | 13F | OxenFree Capital LLC | 24.990 | 200,00 | 894 | 23,14 | ||||
| 2025-08-14 | 13F | Paragon Private Wealth Management, LLC | 15.487 | 135,76 | 554 | 2,78 | ||||
| 2025-07-23 | 13F | MADDEN SECURITIES Corp | 221.784 | 211,11 | 7.938 | 35,47 | ||||
| 2025-08-14 | 13F | Wealth Preservation Advisors, LLC | 31.749 | 214,88 | 1.136 | 37,20 | ||||
| 2025-08-14 | 13F | Citadel Advisors Llc | 194.250 | 455,25 | 6.952 | 141,81 | ||||
| 2025-08-11 | 13F | Rpo Llc | 77.070 | 315,70 | 2.758 | 81,09 | ||||
| 2025-08-14 | 13F | Citadel Advisors Llc | Call | 340.700 | 143,18 | 12.194 | 5,88 | |||
| 2025-07-28 | 13F | Kiker Wealth Management, LLC | 900 | 200,00 | 32 | 33,33 | ||||
| 2025-08-01 | 13F | Koss-Olinger Consulting, LLC | 60.000 | 2.147 | ||||||
| 2025-08-14 | 13F | Wells Fargo & Company/mn | 1 | 0,00 | 0 | |||||
| 2025-07-15 | 13F | Missouri Trust & Investment Co | 300 | 200,00 | 11 | 25,00 | ||||
| 2025-08-05 | 13F | Chase Investment Counsel Corp | 44.676 | 200,00 | 2 | 0,00 | ||||
| 2025-07-23 | 13F | Richardson Capital Management LLC | 7.647 | 200,00 | 274 | 30,62 | ||||
| 2025-08-07 | 13F | Encompass More Asset Management | 6.745 | 241 | ||||||
| 2025-08-14 | 13F | Farringdon Capital, Ltd. | 128.870 | 195,65 | 4.612 | 28,75 | ||||
| 2025-08-14 | 13F | Susquehanna International Group, Llp | 999.300 | 4.565,27 | 35.765 | 1.932,05 | ||||
| 2025-08-14 | 13F | Susquehanna International Group, Llp | Put | 175.400 | 790,36 | 6.278 | 287,71 | |||
| 2025-08-14 | 13F | Susquehanna International Group, Llp | Call | 352.600 | 316,29 | 12.620 | 81,26 | |||
| 2025-08-14 | 13F | Verition Fund Management LLC | 150.000 | 200,00 | 5.368 | 30,61 | ||||
| 2025-08-18 | 13F | Hollencrest Capital Management | 6.300 | 200,00 | 225 | 30,81 | ||||
| 2025-08-05 | 13F | Optivise Advisory Services LLC | 10.519 | 161,34 | 376 | 13,94 | ||||
| 2025-07-25 | 13F | Concurrent Investment Advisors, LLC | 127.579 | 157,87 | 4.566 | 12,30 | ||||
| 2025-05-14 | 13F | Flow Traders U.s. Llc | 0 | -100,00 | 0 | |||||
| 2025-05-16 | 13F | Jones Financial Companies Lllp | 0 | -100,00 | 0 | |||||
| 2025-07-23 | 13F | Indiana Trust & Investment Management CO | 2.610 | 200,00 | 93 | 30,99 | ||||
| 2025-08-14 | 13F | Millennium Management Llc | 4.228.533 | 206,81 | 151.339 | 33,58 | ||||
| 2025-07-28 | 13F | Axxcess Wealth Management, Llc | 26.213 | 161,82 | 938 | 14,11 | ||||
| 2025-08-15 | 13F | CI Private Wealth, LLC | 11.645 | 417 | ||||||
| 2025-08-12 | 13F | Virtu Financial LLC | 193.212 | 7 | ||||||
| 2025-08-13 | 13F/A | Claudia M.p. Batlle, Crp (r) Llc | 10.000 | 358 | ||||||
| 2025-08-06 | 13F | Vestmark Advisory Solutions, Inc. | 15.750 | 445,74 | 564 | 137,55 | ||||
| 2025-08-05 | 13F | Carolinas Wealth Consulting Llc | 0 | -100,00 | 0 | |||||
| 2025-08-05 | 13F | Harel Insurance Investments & Financial Services Ltd. | 661 | 0 | ||||||
| 2025-08-13 | 13F | Brown Advisory Inc | 30.525 | 200,00 | 1.092 | 30,62 | ||||
| 2025-07-31 | 13F | Buckingham Strategic Partners | 7.152 | 256 | ||||||
| 2025-08-05 | 13F | Simplex Trading, Llc | 200.964 | 230,32 | 7 | 40,00 | ||||
| 2025-07-10 | 13F | Oliver Lagore Vanvalin Investment Group | 0 | -100,00 | 0 | |||||
| 2025-08-05 | 13F | Bank Of Montreal /can/ | 15.950 | -69,52 | 571 | -86,75 | ||||
| 2025-08-12 | 13F | Centric Wealth Management | 5.226 | 202 | ||||||
| 2025-08-01 | 13F | Envestnet Asset Management Inc | 157.818 | 157,47 | 5.648 | 12,11 | ||||
| 2025-08-13 | 13F | Lauer Wealth, LLC | 9.600 | 276,47 | 380 | 56,61 | ||||
| 2025-08-13 | 13F | Walleye Trading LLC | Put | 5.400 | 1.700,00 | 193 | 704,17 | |||
| 2025-08-14 | 13F | Modern Wealth Management, LLC | 27.189 | 294,56 | 973 | 71,91 | ||||
| 2025-08-13 | 13F | Walleye Trading LLC | Call | 1.500 | 150,00 | 54 | 8,16 | |||
| 2025-08-13 | 13F | Lido Advisors, LLC | 16.573 | 272,34 | 593 | 62,47 | ||||
| 2025-08-08 | 13F | Empower Advisory Group, LLC | 8.946 | 172,49 | 320 | 18,96 | ||||
| 2025-08-13 | 13F | Walleye Trading LLC | 1.077 | -83,58 | 39 | -92,95 | ||||
| 2025-08-14 | 13F | Vivaldi Capital Management, LLC | 25.086 | 54,58 | 898 | -32,71 | ||||
| 2025-08-15 | 13F | Morgan Stanley | 29.218 | 137,78 | 1.046 | 3,47 | ||||
| 2025-08-07 | 13F | Kestra Private Wealth Services, Llc | 9.315 | 127,14 | 333 | -1,19 | ||||
| 2025-05-14 | 13F | Walleye Capital LLC | 0 | -100,00 | 0 | |||||
| 2025-07-25 | 13F | Meritage Portfolio Management | 27.351 | 200,00 | 979 | 30,57 | ||||
| 2025-08-14 | 13F | Raymond James Financial Inc | 1.767 | 63 | ||||||
| 2025-08-14 | 13F | Freedom Financial Partners LLC | 50.575 | 195,73 | 1.810 | 28,83 | ||||
| 2025-07-24 | 13F | IFP Advisors, Inc | 6 | 0 | ||||||
| 2025-07-31 | 13F | Richards, Merrill & Peterson, Inc. | 0 | -100,00 | 0 | |||||
| 2025-05-09 | 13F | CoreCap Advisors, LLC | 0 | -100,00 | 0 | |||||
| 2025-05-07 | 13F | Nkcfo Llc | 0 | -100,00 | 0 | |||||
| 2025-08-11 | 13F | EMC Capital Management | 0 | -100,00 | 0 | |||||
| 2025-08-13 | 13F | Aristides Capital LLC | 195.030 | 200,00 | 6.980 | 30,64 | ||||
| 2025-07-17 | 13F | Avondale Wealth Management | 9.119 | 199,97 | 326 | 30,92 | ||||
| 2025-08-14 | 13F | Vienna Asset Management LLC | 6.111 | 219 | ||||||
| 2025-08-08 | 13F | Advyzon Investment Management, LLC | 14.731 | 47,47 | 527 | -35,81 | ||||
| 2025-08-14 | 13F | Comerica Bank | 482 | 46,50 | 17 | -37,04 | ||||
| 2025-08-15 | 13F | Kestra Advisory Services, LLC | 89.512 | 209,38 | 3.204 | 34,69 | ||||
| 2025-08-18 | 13F/A | Apollo Management Holdings, L.P. | 1.275.000 | 13,84 | 45.632 | -50,43 | ||||
| 2025-07-15 | 13F | Surience Private Wealth Llc | 38.375 | 642,84 | 1.373 | 223,82 | ||||
| 2025-08-12 | 13F | Vestor Capital, Llc | 619.370 | 18 | ||||||
| 2025-07-30 | 13F | Avidian Wealth Solutions, LLC | 11.037 | 200,00 | 395 | 30,79 | ||||
| 2025-07-08 | 13F | Nbc Securities, Inc. | 1.155 | 200,00 | 0 | |||||
| 2025-08-15 | 13F | First Heartland Consultants, Inc. | 17.663 | 215,81 | 632 | 37,69 | ||||
| 2025-07-15 | 13F | Garrett Investment Advisors LLC | 6.858 | 245 | ||||||
| 2025-08-14 | 13F | GWM Advisors LLC | 50.024 | 219,19 | 1.790 | 38,98 | ||||
| 2025-08-14 | 13F | Fmr Llc | 0 | -100,00 | 0 | |||||
| 2025-07-17 | 13F | Venture Visionary Partners LLC | 36.705 | 169,41 | 1.314 | 17,34 | ||||
| 2025-07-25 | 13F | NorthRock Partners, LLC | 11.795 | 204,78 | 422 | 32,39 | ||||
| 2025-07-09 | 13F | Pallas Capital Advisors LLC | 9.335 | 182,37 | 334 | 23,25 | ||||
| 2025-08-14 | 13F | Arete Wealth Advisors, LLC | 18.671 | 203,00 | 1 | |||||
| 2025-08-19 | 13F | Advisory Services Network, LLC | 24.299 | 363,54 | 942 | 119,07 | ||||
| 2025-07-16 | 13F | American National Bank | 315 | 200,00 | 11 | 37,50 | ||||
| 2025-08-12 | 13F | LPL Financial LLC | 59.458 | 149,46 | 2.128 | 8,63 | ||||
| 2025-08-08 | 13F | Everett Harris & Co /ca/ | 6.000 | 215 | ||||||
| 2025-08-14 | 13F | Jane Street Group, Llc | 11.436.418 | 128,36 | 409.309 | -0,57 | ||||
| 2025-08-14 | 13F | Jane Street Group, Llc | Put | 48.800 | 269,70 | 1.747 | 60,92 | |||
| 2025-07-15 | 13F | Cordant, Inc. | 0 | -100,00 | 0 | |||||
| 2025-08-14 | 13F | Jane Street Group, Llc | Call | 163.900 | 527,97 | 5.866 | 173,43 | |||
| 2025-07-17 | 13F | Campion Asset Management LLC | 0 | -100,00 | 0 | |||||
| 2025-08-14 | 13F | Headlands Technologies LLC | 100 | -93,56 | 4 | -97,64 | ||||
| 2025-08-13 | 13F | StoneX Group Inc. | 0 | -100,00 | 0 | -100,00 | ||||
| 2025-07-30 | 13F | Strategic Blueprint, LLC | 106.629 | 209,46 | 3.816 | 34,75 | ||||
| 2025-08-08 | 13F | Citizens Financial Group Inc/ri | 27.573 | 200,00 | 987 | 30,60 | ||||
| 2025-07-16 | 13F | Perigon Wealth Management, LLC | 16.047 | 246,89 | 574 | 51,05 | ||||
| 2025-07-30 | 13F | Fogel Capital Management, Inc. | 7.950 | 200,00 | 285 | 30,88 | ||||
| 2025-08-12 | 13F | Cornerstone Select Advisors, LLC | 7.509 | 183,25 | 269 | 23,50 | ||||
| 2025-07-02 | 13F | HBW Advisory Services LLC | 34.555 | 202,82 | 1.237 | 31,91 | ||||
| 2025-08-15 | 13F | ROSS\JOHNSON & Associates LLC | 3.474 | 200,00 | 124 | 30,53 | ||||
| 2025-08-06 | 13F | First Horizon Advisors, Inc. | 4.255 | 77,14 | 152 | -22,84 | ||||
| 2025-07-23 | 13F | Castle Rock Wealth Management, LLC | 83.580 | 209,34 | 3.270 | 42,30 | ||||
| 2025-08-14 | 13F | Kerrisdale Advisers, LLC | 0 | -100,00 | 0 | |||||
| 2025-07-25 | 13F | We Are One Seven, LLC | 6.060 | 126,97 | 217 | -1,37 | ||||
| 2025-07-28 | 13F | RFG Advisory, LLC | 9.642 | 205,80 | 345 | 33,20 | ||||
| 2025-08-13 | 13F | Cresset Asset Management, LLC | 121.101 | 208,43 | 4.334 | 34,30 | ||||
| 2025-07-14 | 13F | UMA Financial Services, Inc. | 300 | 200,00 | 11 | 25,00 | ||||
| 2025-07-11 | 13F | Farther Finance Advisors, LLC | 180 | 21,62 | 6 | -50,00 | ||||
| 2025-07-21 | 13F | Rainey & Randall Investment Management Inc. | 22.074 | 200,00 | 790 | 30,79 | ||||
| 2025-08-14 | 13F | DRW Securities, LLC | 114.802 | 182,63 | 4.109 | 23,07 | ||||
| 2025-07-14 | 13F | Painted Porch Advisors LLC | 1.425 | 200,00 | 51 | 30,77 | ||||
| 2025-08-08 | 13F | Larson Financial Group LLC | 6 | 200,00 | 0 | |||||
| 2025-08-05 | 13F | Dunhill Financial, LLC | 0 | -100,00 | 0 | |||||
| 2025-08-14 | 13F | Bank Of America Corp /de/ | 3.459 | 3.359,00 | 124 | 1.437,50 | ||||
| 2025-07-25 | 13F | Midwest Capital Advisors, LLC | 165 | 6 | ||||||
| 2025-08-14 | 13F | Mml Investors Services, Llc | 17.701 | 250,72 | 1 | |||||
| 2025-08-13 | 13F | Hbk Investments L P | 3.267.144 | 299,81 | 116.931 | 74,08 | ||||
| 2025-08-14 | 13F | Cantor Fitzgerald, L. P. | 21.175 | 211,63 | 758 | 35,66 | ||||
| 2025-07-16 | 13F | Dakota Wealth Management | 188.001 | 200,00 | 6.729 | 30,62 | ||||
| 2025-04-21 | 13F | ORG Partners LLC | 0 | -100,00 | 0 | |||||
| 2025-07-07 | 13F | Global Wealth Strategies & Associates | 621 | 200,00 | 22 | 29,41 | ||||
| 2025-08-11 | 13F | Anfield Capital Management, LLC | 150 | 200,00 | 5 | 25,00 | ||||
| 2025-08-12 | 13F | One Charles Private Wealth Services, LLC | 91.764 | 198,90 | 3.284 | 30,16 | ||||
| 2025-07-22 | 13F | Beacon Financial Advisory LLC | 16.233 | 205,30 | 581 | 32,72 | ||||
| 2025-07-22 | 13F | Merit Financial Group, LLC | 10.614 | 223,50 | 380 | 40,89 | ||||
| 2025-08-12 | 13F | Wisconsin Wealth Advisors, LLC | 38.132 | 209,56 | 1.365 | 34,78 | ||||
| 2025-08-11 | 13F | TD Waterhouse Canada Inc. | 1.500 | 200,00 | 54 | 26,19 | ||||
| 2025-08-14 | 13F | Mariner, LLC | 50.493 | 166,20 | 1.807 | 15,91 | ||||
| 2025-08-14 | 13F | Royal Bank Of Canada | 420 | 23,53 | 15 | -46,43 | ||||
| 2025-06-25 | NP | ARKW - ARK Next Generation Internet ETF | 1.636.584 | -24,66 | 153.659 | -30,20 | ||||
| 2025-08-13 | 13F | Renaissance Technologies Llc | 163.800 | 5.862 | ||||||
| 2025-08-14 | 13F | Benjamin Edwards Inc | 150.754 | 162,70 | 5.395 | 14,37 | ||||
| 2025-07-15 | 13F | BCS Wealth Management | 5.985 | 0 | ||||||
| 2025-08-11 | 13F | TRUE Private Wealth Advisors | 6.900 | 247 | ||||||
| 2025-07-30 | 13F | Brookstone Capital Management | 7.788 | 279 | ||||||
| 2025-08-13 | 13F | Financial & Tax Architects, LLC | 5.688 | 204 | ||||||
| 2025-08-08 | 13F | Foundations Investment Advisors, LLC | 10.311 | 320,34 | 369 | 83,58 | ||||
| 2025-08-13 | 13F | EverSource Wealth Advisors, LLC | 30.403 | 246,28 | 1.088 | 50,90 | ||||
| 2025-08-01 | 13F | Belvedere Trading LLC | 0 | -100,00 | 0 | |||||
| 2025-08-13 | 13F | Kaleidoscope Capital Lp | 674.568 | 444,87 | 24.143 | 137,24 | ||||
| 2025-07-16 | 13F | Strategic Investment Solutions, Inc. /IL | 0 | -100,00 | 0 | |||||
| 2025-08-07 | 13F | Allworth Financial LP | 942 | 96,25 | 34 | -25,00 | ||||
| 2025-08-18 | 13F | N.E.W. Advisory Services LLC | 72 | -34,55 | 3 | -77,78 | ||||
| 2025-08-14 | 13F | First Foundation Advisors | 6.030 | 216 | ||||||
| 2025-08-01 | 13F | Belvedere Trading LLC | Call | 0 | -100,00 | 0 | ||||
| 2025-08-12 | 13F | Global Retirement Partners, LLC | 801 | 102,78 | 29 | -22,22 | ||||
| 2025-08-01 | 13F | Belvedere Trading LLC | Put | 0 | -100,00 | 0 | ||||
| 2025-07-21 | 13F | Ameritas Advisory Services, LLC | 528 | 19 | ||||||
| 2025-08-11 | 13F | Gr Financial Group, Llc | 0 | -100,00 | 0 | |||||
| 2025-08-12 | 13F | CIBC Private Wealth Group, LLC | 228 | 200,00 | 8 | 60,00 | ||||
| 2025-08-13 | 13F | Jump Financial, LLC | 21.780 | 780 | ||||||
| 2025-05-06 | 13F | Venturi Wealth Management, LLC | 0 | -100,00 | 0 | |||||
| 2025-05-15 | 13F | Wolverine Trading, Llc | Call | 0 | -100,00 | 0 | ||||
| 2025-07-22 | 13F | Wealthcare Advisory Partners LLC | 79.351 | 197,56 | 2.840 | 29,52 | ||||
| 2025-07-31 | 13F/A | Interchange Capital Partners, LLC | 24.918 | 131,11 | 892 | 0,56 | ||||
| 2025-08-11 | 13F | Landaas & Co /wi /adv | 8.987 | 322 | ||||||
| 2025-08-07 | 13F | CENTRAL TRUST Co | 1.917 | 200,00 | 69 | 30,77 | ||||
| 2025-07-31 | 13F | Cambridge Investment Research Advisors, Inc. | 122.468 | 198,46 | 4 | 33,33 | ||||
| 2025-08-12 | 13F | Steward Partners Investment Advisory, Llc | 0 | -100,00 | 0 | |||||
| 2025-08-04 | 13F | Impact Partnership Wealth, LLC | 0 | -100,00 | 0 | |||||
| 2025-07-22 | 13F | Belpointe Asset Management LLC | 64.998 | 197,13 | 2.326 | 29,37 | ||||
| 2025-08-14 | 13F | Schonfeld Strategic Advisors LLC | 3.326.587 | 1.227,83 | 119.059 | 478,15 | ||||
| 2025-08-14 | 13F | Visionary Wealth Advisors | 6.157 | 220 | ||||||
| 2025-07-10 | 13F | Wealth Enhancement Advisory Services, Llc | 16.435 | 166,80 | 597 | 17,98 | ||||
| 2025-06-30 | NP | BLKC - Invesco Alerian Galaxy Blockchain Users and Decentralized Commerce ETF This fund is a listed as child fund of Invesco Ltd. and if that institution has disclosed ownership in this security, then these positions will not be double counted when calculating total shares and total value | 203 | -14,35 | 19 | -20,83 | ||||
| 2025-06-30 | NP | SATO - Invesco Alerian Galaxy Crypto Economy ETF This fund is a listed as child fund of Invesco Ltd. and if that institution has disclosed ownership in this security, then these positions will not be double counted when calculating total shares and total value | 624 | -23,34 | 59 | -29,27 | ||||
| 2025-07-22 | 13F | IMC-Chicago, LLC | 25.677 | 88,52 | 919 | -17,96 | ||||
| 2025-08-12 | 13F | MAI Capital Management | 15.418 | 227,90 | 552 | 42,75 | ||||
| 2025-07-23 | 13F | Meitav Dash Investments Ltd | 61.114 | 397,10 | 2.187 | 116,53 | ||||
| 2025-07-14 | 13F | AdvisorNet Financial, Inc | 27.360 | 114,57 | 979 | -6,58 | ||||
| 2025-08-12 | 13F | Proequities, Inc. | 0 | 0 | ||||||
| 2025-08-08 | 13F | United Asset Strategies, Inc. | 13.965 | 200,00 | 500 | 30,63 |