Grundlæggende statistik
| Institutionelle aktier (lange) | 61.012.532 - 87,08% (ex 13D/G) - change of 2,45MM shares 3,14% MRQ |
| Institutionel værdi (lang) | $ 1.734.517 USD ($1000) |
Institutionelt ejerskab og aktionærer
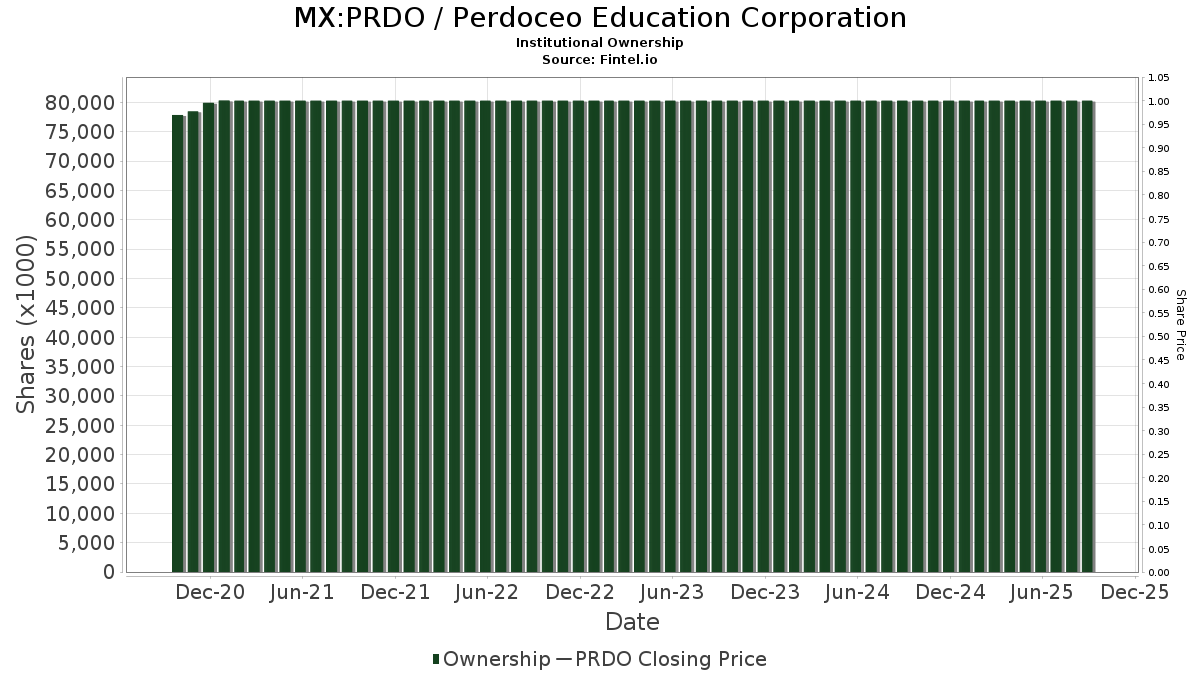
Perdoceo Education Corporation (MX:PRDO) har 313 institutionelle ejere og aktionærer, der har indsendt 13D/G- eller 13F-formularer til Securities Exchange Commission (SEC). Disse institutioner har i alt 61,012,532 aktier. Største aktionærer omfatter BlackRock, Inc., Vanguard Group Inc, Dimensional Fund Advisors Lp, Renaissance Technologies Llc, First Trust Advisors Lp, State Street Corp, Frontier Capital Management Co Llc, American Century Companies Inc, Copeland Capital Management, LLC, and Lsv Asset Management .
Perdoceo Education Corporation (BMV:PRDO) institutionel ejerskabsstruktur viser aktuelle positioner i virksomheden efter institutioner og fonde, samt seneste ændringer i positionsstørrelse. Større aktionærer kan omfatte individuelle investorer, investeringsforeninger, hedgefonde eller institutioner. Skema 13D angiver, at investoren besidder (eller besidder) mere end 5 % af virksomheden og har til hensigt (eller har til hensigt at) aktivt at forfølge en ændring i forretningsstrategi. Skema 13G indikerer en passiv investering på over 5%.
Fondens stemningsscore
Fund Sentiment Score (fka Ownership Accumulation Score) finder de aktier, der bliver mest købt af fonde. Det er resultatet af en sofistikeret, multi-faktor kvantitativ model, der identificerer virksomheder med de højeste niveauer af institutionel akkumulering. Scoringsmodellen bruger en kombination af den samlede stigning i oplyste ejere, ændringerne i porteføljeallokeringer i disse ejere og andre målinger. Tallet går fra 0 til 100, hvor højere tal indikerer et højere niveau af akkumulering for sine jævnaldrende, og 50 er gennemsnittet.
Opdateringsfrekvens: Dagligt
Se Ownership Explorer, som giver en liste over højest rangerende virksomheder.
AI+ Ask Fintel’s AI assistant about Perdoceo Education Corporation.
Select a question to share a public post with an AI-crafted answer.
Thinking of good questions…
13F og NPORT arkivering
Detaljer om 13F-arkivering er gratis. Detaljer om NP-ansøgninger kræver et premium-medlemskab. Grønne rækker angiver nye positioner. Røde rækker angiver lukkede positioner. Klik på linket ikon for at se den fulde transaktionshistorik.
Opgrader
for at låse premium-data op og eksportere til Excel ![]() .
.
| Fil dato | Kilde | Investor | Type | Gennemsnitlig pris (Øst) |
Aktier | Δ Aktier (%) |
Rapporteret Værdi ($1000) |
Δ Værdi (%) |
Port Alloc (%) |
|
|---|---|---|---|---|---|---|---|---|---|---|
| 2025-11-13 | 13F | Riggs Asset Managment Co. Inc. | 0 | -100,00 | 0 | |||||
| 2026-02-13 | 13F | Morgan Stanley | 879.759 | -23,00 | 25.803 | -40,03 | ||||
| 2026-02-17 | 13F | Optiver Holding B.V. | 156 | -54,39 | 5 | -66,67 | ||||
| 2026-04-15 | 13F | Exchange Traded Concepts, Llc | 74.864 | -29,30 | 2.786 | -10,31 | ||||
| 2026-02-13 | 13F | Ieq Capital, Llc | 8.453 | -13,79 | 248 | -33,06 | ||||
| 2026-02-04 | 13F | Pacer Advisors, Inc. | 0 | -100,00 | 0 | |||||
| 2026-02-09 | 13F | Quest Partners LLC | 6.567 | 173,51 | 193 | 113,33 | ||||
| 2025-11-05 | 13F | Castlekeep Investment Advisors Llc | 0 | -100,00 | 0 | |||||
| 2026-02-10 | 13F/A | Northwestern Mutual Wealth Management Co | 8 | -96,24 | 0 | -100,00 | ||||
| 2026-04-27 | 13F | Polaris Capital Management, LLC | 60.600 | 0,00 | 2.255 | 26,84 | ||||
| 2026-05-04 | 13F | Teachers Retirement System Of The State Of Kentucky | 15.531 | 0,00 | 1 | |||||
| 2026-02-09 | 13F | Keating Financial Advisory Services, Inc. | 36 | 1 | ||||||
| 2026-02-09 | 13F | CBIZ Investment Advisory Services, LLC | 810 | 23,10 | 24 | -4,17 | ||||
| 2026-02-13 | 13F | Walleye Trading LLC | Put | 7.000 | -6,67 | 205 | -27,30 | |||
| 2026-02-13 | 13F | Walleye Trading LLC | Call | 3.600 | -84,28 | 106 | -87,82 | |||
| 2026-01-29 | 13F | Axecap Investments, LLC | 0 | -100,00 | 0 | |||||
| 2026-01-28 | 13F | DekaBank Deutsche Girozentrale | 120.539 | 0,00 | 2 | -50,00 | ||||
| 2026-02-17 | 13F | Citadel Advisors Llc | Call | 29.500 | 178,30 | 865 | 116,79 | |||
| 2026-04-20 | 13F | Ronald Blue Trust, Inc. | 833 | 0,00 | 31 | 25,00 | ||||
| 2026-02-17 | 13F | Citadel Advisors Llc | 207.505 | -17,85 | 6.086 | -36,02 | ||||
| 2025-11-12 | 13F | Group One Trading, L.p. | Put | 0 | -100,00 | 0 | -100,00 | |||
| 2025-11-14 | 13F | Texas Permanent School Fund | 0 | -100,00 | 0 | |||||
| 2026-04-27 | 13F | New York State Teachers Retirement System | 81.156 | -2,42 | 3 | 50,00 | ||||
| 2026-01-15 | 13F | Allspring Global Investments Holdings, LLC | 31.031 | 9,57 | 903 | -14,16 | ||||
| 2026-02-17 | 13F | Citadel Advisors Llc | Put | 16.900 | 172,58 | 496 | 112,45 | |||
| 2026-02-12 | 13F | Marex Group plc | 8.770 | 257 | ||||||
| 2026-02-17 | 13F | Cresset Asset Management, LLC | 71.817 | -0,05 | 2.106 | -22,17 | ||||
| 2026-02-13 | 13F | Truvestments Capital Llc | 14.532 | 6,94 | 426 | -16,63 | ||||
| 2026-02-13 | 13F | Victory Capital Management Inc | 231.607 | 35,48 | 6.793 | 5,53 | ||||
| 2026-02-13 | 13F | Sei Investments Co | 236.728 | 14,39 | 6.943 | -10,91 | ||||
| 2026-01-29 | 13F | Copeland Capital Management, LLC | 1.716.850 | 82,15 | 50.355 | 41,86 | ||||
| 2026-02-12 | 13F | Voya Investment Management Llc | 50.833 | 1,58 | 1.491 | -20,91 | ||||
| 2026-02-13 | 13F | Centerpoint Advisors, LLC | 451 | 0 | ||||||
| 2026-02-12 | 13F | Elo Mutual Pension Insurance Co | 40.827 | 42,77 | 1.197 | 11,25 | ||||
| 2026-04-20 | 13F | Contravisory Investment Management, Inc. | 6.479 | 0,00 | 241 | 26,84 | ||||
| 2026-01-29 | 13F | Camelot Portfolios, LLC | 23.975 | -2,78 | 703 | -24,25 | ||||
| 2025-11-12 | 13F | Nomura Asset Management Co Ltd | 0 | -100,00 | 0 | -100,00 | ||||
| 2025-11-12 | 13F | Park Square Financial Group, LLC | 0 | -100,00 | 0 | |||||
| 2026-02-13 | 13F | Walleye Trading LLC | 4.072 | 119 | ||||||
| 2026-05-01 | 13F | Thrivent Financial For Lutherans | 40.358 | -2,86 | 2 | 0,00 | ||||
| 2025-11-14 | 13F | Larson Financial Group LLC | 0 | -100,00 | 0 | |||||
| 2026-02-13 | 13F | Rhumbline Advisers | 173.128 | -4,64 | 5.078 | -25,74 | ||||
| 2026-02-12 | 13F | Quadrant Capital Group Llc | 1.215 | 0,00 | 36 | -22,22 | ||||
| 2026-02-12 | 13F | Principal Securities, Inc. | 0 | -100,00 | 0 | -100,00 | ||||
| 2026-02-20 | 13F | Kovitz Investment Group Partners, LLC | 0 | -100,00 | 0 | |||||
| 2026-02-12 | 13F | Federation des caisses Desjardins du Quebec | 285 | 0,00 | 8 | -20,00 | ||||
| 2026-02-06 | 13F | Lsv Asset Management | 1.683.894 | -1,59 | 49 | -23,44 | ||||
| 2026-04-22 | 13F | Pictet Asset Management Holding SA | 10.902 | 18,72 | 406 | 50,56 | ||||
| 2026-02-17 | 13F | Sciencast Management LP | 0 | -100,00 | 0 | |||||
| 2025-11-14 | 13F | Bridgefront Capital, LLC | 0 | -100,00 | 0 | -100,00 | ||||
| 2026-02-11 | 13F | Ameritas Investment Partners, Inc. | 5.142 | 151 | ||||||
| 2026-02-17 | 13F | Public Employees Retirement System Of Ohio | 1.085 | -1,18 | 32 | -24,39 | ||||
| 2026-02-09 | 13F | Huntington National Bank | 1 | -90,00 | 0 | |||||
| 2026-02-13 | 13F | Panagora Asset Management Inc | 82.370 | 39,94 | 2.416 | 8,98 | ||||
| 2026-02-17 | 13F | Voloridge Investment Management, Llc | 99.270 | 48,57 | 2.912 | 15,70 | ||||
| 2026-02-10 | 13F | Acadian Asset Management Llc | 254.788 | -68,83 | 7 | -76,67 | ||||
| 2026-04-24 | 13F | Root Financial Partners, LLC | 65 | 2 | ||||||
| 2026-02-17 | 13F | Cetera Investment Advisers | 14.209 | 5,88 | 417 | -17,62 | ||||
| 2026-04-23 | 13F | SJS Investment Consulting Inc. | 10 | 0,00 | 0 | |||||
| 2026-04-30 | 13F | Manning & Napier Advisors Llc | 216.066 | 28,44 | 8.040 | 62,93 | ||||
| 2026-03-12 | 13F/A | Peak6 Llc | Call | 21.700 | 636 | |||||
| 2026-04-20 | 13F | Louisiana State Employees Retirement System | 26.800 | -3,25 | 997 | 22,78 | ||||
| 2026-02-17 | 13F | Two Sigma Securities, Llc | 0 | -100,00 | 0 | |||||
| 2026-02-11 | 13F | Parallel Advisors, LLC | 3.398 | 0,00 | 100 | -22,05 | ||||
| 2026-02-11 | 13F | Brandywine Global Investment Management, LLC | 215.371 | -3,54 | 6.317 | -24,88 | ||||
| 2026-02-17 | 13F | Mercer Global Advisors Inc /adv | 0 | -100,00 | 0 | |||||
| 2026-02-17 | 13F | Qube Research & Technologies Ltd | 1.236.324 | 54,50 | 36.261 | 20,32 | ||||
| 2026-02-17 | 13F | Oxford Asset Management Llp | 20.064 | 588 | ||||||
| 2026-02-11 | 13F | Inceptionr Llc | 0 | -100,00 | 0 | |||||
| 2025-11-14 | 13F | AXA Investment Managers S.A. | 7.076 | 266 | ||||||
| 2026-02-17 | 13F | Two Sigma Investments, Lp | 476.569 | 3,81 | 13.978 | -19,15 | ||||
| 2025-11-14 | 13F | Point72 Europe (London) LLP | 604 | 23 | ||||||
| 2026-04-06 | 13F | GAMMA Investing LLC | 1.486 | 4,06 | 55 | 34,15 | ||||
| 2026-02-03 | 13F | Gallacher Capital Management LLC | 10.796 | -1,19 | 317 | -23,11 | ||||
| 2026-02-11 | 13F | Group One Trading, L.p. | 28 | -72,00 | 1 | -100,00 | ||||
| 2026-02-17 | 13F | Atom Investors LP | 44.112 | 5,50 | 1.294 | -17,85 | ||||
| 2026-02-03 | 13F | Denali Advisors Llc | 50.700 | -54,69 | 1.487 | -64,71 | ||||
| 2026-02-11 | 13F | Group One Trading, L.p. | Call | 700 | 250,00 | 21 | 185,71 | |||
| 2026-04-28 | 13F | Quent Capital, LLC | 169 | 0,00 | 6 | 50,00 | ||||
| 2026-02-12 | 13F | Bank Of Montreal /can/ | 0 | -100,00 | 0 | |||||
| 2026-02-11 | 13F | Allianz Asset Management GmbH | 51.266 | 14,02 | 1.504 | -11,22 | ||||
| 2026-02-11 | 13F | Financiere des Professionnels - Fonds d,investissement inc. | 0 | -100,00 | 0 | |||||
| 2026-02-06 | 13F | HighTower Advisors, LLC | 13.081 | 1,13 | 384 | -21,36 | ||||
| 2026-01-27 | 13F | Evergreen Capital Management Llc | 0 | -100,00 | 0 | |||||
| 2026-02-17 | 13F | Harvest Investment Services, LLC | 0 | -100,00 | 0 | |||||
| 2026-02-12 | 13F | Steward Partners Investment Advisory, Llc | 4.073 | 2,49 | 119 | -20,13 | ||||
| 2026-02-11 | 13F | Cerity Partners LLC | 325.400 | 874,08 | 9.544 | 658,59 | ||||
| 2026-02-09 | 13F | Royce & Associates Lp | 78.703 | -0,98 | 2.308 | -22,89 | ||||
| 2026-02-17 | 13F | Jump Financial, LLC | 62.401 | -24,91 | 1.830 | -41,51 | ||||
| 2026-04-13 | 13F | Wedge Capital Management L L P/nc | 47.499 | 1.767 | ||||||
| 2026-04-30 | 13F | Personal Cfo Solutions, Llc | 8.219 | -2,15 | 306 | 23,98 | ||||
| 2026-02-10 | 13F | Goldman Sachs Group Inc | 1.078.746 | 64,91 | 31.640 | 28,44 | ||||
| 2026-02-26 | 13F | TD Capital Management LLC | 7 | 0 | ||||||
| 2026-02-17 | 13F | ClearAlpha Technologies LP | 0 | -100,00 | 0 | |||||
| 2026-05-01 | 13F | Richardson Financial Services Inc. | 1.154 | 6,85 | 43 | 35,48 | ||||
| 2026-04-17 | 13F | Bell Investment Advisors, Inc | 40 | 0,00 | 1 | 0,00 | ||||
| 2026-02-13 | 13F | Citigroup Inc | 29.002 | -58,53 | 851 | -67,72 | ||||
| 2026-02-06 | 13F | Global Retirement Partners, LLC | 2.946 | 155,29 | 86 | 100,00 | ||||
| 2026-02-12 | 13F | BlackRock, Inc. | 9.466.256 | 2,20 | 277.645 | -20,41 | ||||
| 2026-02-13 | 13F | Charles Schwab Investment Management Inc | 848.382 | 0,54 | 24.883 | -21,69 | ||||
| 2026-02-13 | 13F | Colony Group, LLC | 20.806 | 610 | ||||||
| 2026-02-17 | 13F | Watershed Asset Management, L.L.C. | 17.163 | 17,88 | 503 | 97,25 | ||||
| 2026-02-10 | 13F | Bruce G. Allen Investments, LLC | 0 | -100,00 | 0 | |||||
| 2026-02-12 | 13F | MetLife Investment Management, LLC | 35.431 | -3,47 | 1.039 | -24,82 | ||||
| 2026-02-17 | 13F | Tower Research Capital LLC (TRC) | 2.462 | -47,49 | 72 | -59,09 | ||||
| 2026-04-21 | 13F | Decker Retirement Planning Inc. | 5 | -100,00 | 0 | -100,00 | ||||
| 2026-02-05 | 13F | Bessemer Group Inc | 11.823 | 21,75 | 0 | |||||
| 2026-02-17 | 13F | Cambria Investment Management, L.P. | 22.712 | 1,60 | 666 | -20,81 | ||||
| 2026-04-28 | 13F | Bfsg, Llc | 3.174 | -3,05 | 118 | 22,92 | ||||
| 2026-04-30 | 13F | Clear Street Markets Llc | 0 | -100,00 | 0 | |||||
| 2026-02-12 | 13F | Renaissance Technologies Llc | 3.654.064 | -4,64 | 107.174 | -25,74 | ||||
| 2026-02-13 | 13F | Verition Fund Management LLC | 17.202 | 80,77 | 505 | 40,78 | ||||
| 2026-02-17 | 13F | Advisory Services Network, LLC | 0 | -100,00 | 0 | |||||
| 2025-11-14 | 13F | Binnacle Investments Inc | 422 | 16 | ||||||
| 2026-02-17 | 13F | Gotham Asset Management, LLC | 34.144 | 78,27 | 1.001 | 38,83 | ||||
| 2026-04-16 | 13F | SG Americas Securities, LLC | 62.519 | -71,43 | 2 | -66,67 | ||||
| 2026-02-12 | 13F | JPL Wealth Management, LLC | 0 | -100,00 | 0 | |||||
| 2026-02-17 | 13F | Tudor Investment Corp Et Al | 268.894 | 7.887 | ||||||
| 2026-04-09 | 13F | Planned Solutions, Inc. | 6.135 | 228 | ||||||
| 2026-02-05 | 13F | Allworth Financial LP | 82 | -67,72 | 2 | -77,78 | ||||
| 2026-05-01 | 13F | Arizona State Retirement System | 17.668 | -1,97 | 657 | 24,43 | ||||
| 2026-02-09 | 13F | Geode Capital Management, Llc | 1.681.424 | 6,93 | 49.324 | -16,72 | ||||
| 2026-02-12 | 13F | Aviva Plc | 16.840 | 19,32 | 494 | -7,16 | ||||
| 2026-02-10 | 13F | Connor, Clark & Lunn Investment Management Ltd. | 37.002 | -29,17 | 1.085 | -44,84 | ||||
| 2026-02-03 | 13F | Legacy Wealth Managment, LLC/ID | 228 | 60,56 | 7 | 20,00 | ||||
| 2026-02-13 | 13F | Pinnacle Wealth Planning Services, Inc. | 277 | 8 | ||||||
| 2026-02-05 | 13F | Amalgamated Bank | 17.881 | 1,64 | 1 | |||||
| 2026-02-17 | 13F | Nomura Holdings Inc | 9.122 | -18,52 | 268 | -36,58 | ||||
| 2026-02-17 | 13F | Advisor Group Holdings, Inc. | 11.477 | -67,33 | 336 | -73,71 | ||||
| 2025-11-14 | 13F | D. E. Shaw & Co., Inc. | 0 | -100,00 | 0 | -100,00 | ||||
| 2026-02-10 | 13F | Bank of New York Mellon Corp | 802.359 | -20,32 | 23.533 | -37,94 | ||||
| 2026-02-17 | 13F | Schonfeld Strategic Advisors LLC | 0 | -100,00 | 0 | |||||
| 2026-02-06 | 13F | Covestor Ltd | 223 | -26,16 | 0 | |||||
| 2026-04-13 | 13F | IFP Advisors, Inc | 1.188 | -12,84 | 44 | 12,82 | ||||
| 2026-04-06 | 13F | CX Institutional | 81 | 0,00 | 0 | |||||
| 2026-02-02 | 13F | Cornerstone Planning Group LLC | 407 | -29,58 | 13 | 9,09 | ||||
| 2026-02-11 | 13F | Empowered Funds, LLC | 92.261 | -3,72 | 2.706 | -25,00 | ||||
| 2026-02-17 | 13F | Verdad Advisers, LP | 24.664 | 723 | ||||||
| 2026-04-27 | 13F | Sound Income Strategies, LLC | 128 | 0,00 | 5 | 0,00 | ||||
| 2026-04-22 | 13F | Spire Wealth Management | 0 | -100,00 | 0 | |||||
| 2026-02-13 | 13F | Prudential Financial Inc | 314.010 | -52,03 | 9.210 | -62,65 | ||||
| 2026-04-24 | 13F | Strs Ohio | 25.800 | -11,64 | 960 | 12,15 | ||||
| 2026-02-09 | 13F | Annis Gardner Whiting Capital Advisors, LLC | 0 | -100,00 | 0 | |||||
| 2026-02-17 | 13F | Algert Global Llc | 0 | -100,00 | 0 | |||||
| 2026-02-03 | 13F | Bokf, Na | 13.709 | -0,49 | 402 | -22,39 | ||||
| 2025-11-06 | 13F | Ameritas Advisory Services, LLC | 0 | -100,00 | 0 | |||||
| 2025-11-13 | 13F | Dynamic Technology Lab Private Ltd | 0 | -100,00 | 0 | |||||
| 2026-02-13 | 13F | Caitong International Asset Management Co., Ltd | 689 | 562,50 | 20 | 566,67 | ||||
| 2026-02-05 | 13F | Atria Investments Llc | 8.345 | 24,31 | 245 | -3,17 | ||||
| 2026-02-13 | 13F/A | Alberta Investment Management Corp | 0 | -100,00 | 0 | |||||
| 2026-02-12 | 13F | NDVR, Inc. | 0 | -100,00 | 0 | |||||
| 2026-04-16 | 13F | Diversified Trust Co | 17.253 | 29,99 | 642 | 64,78 | ||||
| 2026-04-29 | 13F | WPG Advisers, LLC | 89 | 456,25 | 3 | |||||
| 2026-01-27 | 13F | Zurcher Kantonalbank (Zurich Cantonalbank) | 20.303 | -0,77 | 595 | -22,73 | ||||
| 2026-03-09 | 13F | EMC Capital Management | 5.410 | -15,00 | 0 | |||||
| 2026-02-17 | 13F | Frontier Capital Management Co Llc | 1.912.481 | 6,54 | 56.093 | -17,02 | ||||
| 2026-04-27 | 13F | Td Private Client Wealth Llc | 99 | 22,22 | 4 | 50,00 | ||||
| 2026-02-17 | 13F | Wellington Management Group Llp | 638.287 | 8,03 | 18.721 | -15,87 | ||||
| 2026-04-20 | 13F | Concurrent Investment Advisors, LLC | 0 | -100,00 | 0 | -100,00 | ||||
| 2026-04-29 | 13F | Klp Kapitalforvaltning As | 42.700 | 0,00 | 1.589 | 26,84 | ||||
| 2026-04-30 | 13F | Nisa Investment Advisors, Llc | 1.819 | 13,05 | 68 | 42,55 | ||||
| 2026-02-12 | 13F | Swiss National Bank | 128.200 | 6,30 | 3.760 | -17,20 | ||||
| 2026-02-17 | 13F | Summit Global Investments | 37.832 | 0,19 | 1 | 0,00 | ||||
| 2026-04-23 | 13F | CWM Advisors, LLC | 50.890 | 1.894 | ||||||
| 2026-02-13 | 13F | Baird Financial Group, Inc. | 14.359 | 16,80 | 421 | -8,87 | ||||
| 2026-04-28 | 13F | Handelsbanken Fonder AB | 21.900 | 0,00 | 1 | |||||
| 2026-02-17 | 13F | Ameriprise Financial Inc | 208.000 | -63,77 | 6.101 | -71,79 | ||||
| 2026-02-13 | 13F | Pathstone Holdings, LLC | 0 | -100,00 | 0 | |||||
| 2026-02-06 | 13F | Legato Capital Management LLC | 16.350 | 480 | ||||||
| 2026-02-17 | 13F | Delaware Management Holdings, Inc. | 31.500 | 924 | ||||||
| 2026-04-28 | 13F | Whittier Trust Co | 65 | 0,00 | 2 | 0,00 | ||||
| 2026-02-13 | 13F | MAI Capital Management | 28 | 1 | ||||||
| 2026-02-19 | 13F | Invesco Ltd. | 556.175 | 17,26 | 16.313 | -8,68 | ||||
| 2026-04-30 | 13F | Equitable Trust Co | 11.498 | -18,42 | 428 | 3,39 | ||||
| 2026-04-30 | 13F | Kestra Advisory Services, LLC | 0 | -100,00 | 0 | |||||
| 2026-01-27 | 13F | WealthCollab, LLC | 2.206 | 0,00 | 65 | -22,89 | ||||
| 2026-02-18 | 13F | GWM Advisors LLC | 632 | -4,96 | 19 | -28,00 | ||||
| 2026-01-29 | 13F | UBS Group AG | 106.112 | -15,33 | 3.112 | -34,05 | ||||
| 2026-02-12 | 13F | Brown Brothers Harriman & Co | 0 | -100,00 | 0 | |||||
| 2026-02-17 | 13F/A | RBF Capital, LLC | 0 | -100,00 | 0 | |||||
| 2026-02-03 | 13F | Mitsubishi UFJ Kokusai Asset Management Co., Ltd. | 194 | 0,00 | 6 | -28,57 | ||||
| 2026-02-17 | 13F | Twinbeech Capital Lp | 9.533 | 280 | ||||||
| 2025-11-12 | 13F | Aster Capital Management (DIFC) Ltd | 0 | -100,00 | 0 | |||||
| 2026-02-13 | 13F | BNP Paribas Asset Management Holding S.A. | 769 | 47,32 | 0 | |||||
| 2026-04-30 | 13F | Teacher Retirement System Of Texas | 51.147 | -13,51 | 1.903 | 9,75 | ||||
| 2025-11-14 | 13F | Point72 Asia (Singapore) Pte. Ltd. | 608 | 23 | ||||||
| 2026-04-16 | 13F | Baron Wealth Management LLC | 6.720 | 250 | ||||||
| 2026-04-28 | 13F | Abel Hall, LLC | 7.059 | 2,95 | 263 | 30,35 | ||||
| 2026-02-13 | 13F | Aigen Investment Management, Lp | 0 | -100,00 | 0 | |||||
| 2026-02-13 | 13F | Public Sector Pension Investment Board | 0 | -100,00 | 0 | |||||
| 2026-02-12 | 13F | New York State Common Retirement Fund | 30.017 | -38,13 | 880 | -51,83 | ||||
| 2025-11-21 | 13F | Nebula Research & Development LLC | 0 | -100,00 | 0 | |||||
| 2026-02-14 | 13F | Rockefeller Capital Management L.P. | 2.132 | 48,78 | 63 | 16,98 | ||||
| 2026-02-17 | 13F | Lazard Asset Management Llc | 133.213 | 3,59 | 3.907 | -19,33 | ||||
| 2026-02-19 | 13F/A | T. Rowe Price Investment Management, Inc. | 150 | 0 | ||||||
| 2026-02-13 | 13F | Mml Investors Services, Llc | 11.174 | -17,55 | 328 | -35,88 | ||||
| 2026-04-23 | 13F | North Star Investment Management Corp. | 140 | 0,00 | 5 | 25,00 | ||||
| 2026-02-13 | 13F | Virtus ETF Advisers LLC | 18.948 | 0,00 | 556 | -22,16 | ||||
| 2026-02-13 | 13F | JustInvest LLC | 11.521 | 8,90 | 338 | -15,33 | ||||
| 2026-05-04 | 13F | Envestnet Asset Management Inc | 289.425 | 11,55 | 10.770 | 41,53 | ||||
| 2026-02-17 | 13F | Snowden Capital Advisors LLC | 36.927 | 21,98 | 1.083 | -5,00 | ||||
| 2026-01-16 | 13F | Empirical Financial Services, LLC d.b.a. Empirical Wealth Management | 28.448 | 34,37 | 834 | 4,64 | ||||
| 2026-02-02 | 13F | Principal Financial Group Inc | 353.293 | 4,60 | 10.362 | -18,53 | ||||
| 2026-02-10 | 13F | Intech Investment Management Llc | 40.477 | -7,64 | 1.187 | -28,06 | ||||
| 2026-02-17 | 13F | California State Teachers Retirement System | 61.175 | 0,31 | 1.794 | -21,86 | ||||
| 2025-11-14 | 13F | Skopos Labs, Inc. | 0 | -100,00 | 0 | |||||
| 2026-02-18 | 13F | Mackenzie Financial Corp | 84.126 | -31,17 | 2.505 | -45,58 | ||||
| 2026-02-17 | 13F | Jones Financial Companies Lllp | 124 | 158,33 | 4 | 200,00 | ||||
| 2026-02-09 | 13F | Severin Investments, LLC | 0 | -100,00 | 0 | |||||
| 2026-02-17 | 13F | Engineers Gate Manager LP | 92.213 | -30,58 | 2.705 | -45,94 | ||||
| 2026-02-13 | 13F | State Street Corp | 2.411.020 | 0,82 | 70.715 | -21,48 | ||||
| 2026-02-11 | 13F | Jpmorgan Chase & Co | 318.904 | -15,72 | 9.353 | -34,36 | ||||
| 2026-02-13 | 13F | Wells Fargo & Company/mn | 81.026 | 48,02 | 2.376 | 15,28 | ||||
| 2025-11-13 | 13F | Hsbc Holdings Plc | 0 | -100,00 | 0 | -100,00 | ||||
| 2026-04-06 | 13F | Versant Capital Management, Inc | 45 | 0,00 | 2 | 0,00 | ||||
| 2026-02-10 | 13F | Koss-Olinger Consulting, LLC | 19.487 | -11,59 | 572 | -20,67 | ||||
| 2025-11-14 | 13F | Point72 Hong Kong Ltd | 0 | -100,00 | 0 | |||||
| 2026-02-13 | 13F | Umb Bank N A/mo | 387 | 44,40 | 11 | 10,00 | ||||
| 2026-05-01 | 13F | Fifth Third Bancorp | 54.648 | 5.533,81 | 2.033 | 7.160,71 | ||||
| 2026-02-13 | 13F | Squarepoint Ops LLC | 318.899 | 4,81 | 9.353 | -18,38 | ||||
| 2026-02-11 | 13F | Simplex Trading, Llc | 0 | -100,00 | 0 | |||||
| 2026-02-13 | 13F | Segall Bryant & Hamill, Llc | 119.605 | -1,42 | 3.508 | -23,22 | ||||
| 2026-02-17 | 13F | Price T Rowe Associates Inc /md/ | 114.052 | -49,55 | 3 | -62,50 | ||||
| 2026-02-17 | 13F | XTX Topco Ltd | 14.951 | 150,02 | 439 | 94,67 | ||||
| 2026-02-02 | 13F | Horizon Investments, LLC | 33.817 | -5,55 | 992 | -26,48 | ||||
| 2026-02-18 | 13F | State of Tennessee, Treasury Department | 47.929 | 39,79 | 1.535 | 18,90 | ||||
| 2025-11-13 | 13F | Fuller & Thaler Asset Management, Inc. | 0 | -100,00 | 0 | |||||
| 2025-11-13 | 13F | C M Bidwell & Associates Ltd | 0 | -100,00 | 0 | |||||
| 2026-01-29 | 13F | Sanctuary Advisors, LLC | 22.386 | -38,12 | 657 | -51,84 | ||||
| 2026-02-13 | 13F | Callodine Capital Management, LP | 963.690 | 35,81 | 28.265 | 5,77 | ||||
| 2026-04-23 | 13F | Farmers & Merchants Investments Inc | 38 | 0,00 | 1 | 0,00 | ||||
| 2026-04-20 | 13F | Assenagon Asset Management S.A. | 243.037 | 9.043 | ||||||
| 2026-02-11 | 13F | Private Management Group Inc | 354.556 | -5,53 | 10.399 | -26,43 | ||||
| 2026-02-17 | 13F | Royal Bank Of Canada | 66.083 | 19,77 | 1.939 | -6,69 | ||||
| 2026-02-12 | 13F | Jane Street Group, Llc | Call | 29.000 | 851 | |||||
| 2026-02-12 | 13F | State Board Of Administration Of Florida Retirement System | 19.218 | 0,00 | 564 | -22,13 | ||||
| 2025-11-14 | 13F | Cubist Systematic Strategies, LLC | 332.572 | -4,73 | 12.525 | 9,75 | ||||
| 2026-02-10 | 13F | Globeflex Capital L P | 28.616 | -18,11 | 839 | -36,20 | ||||
| 2026-02-12 | 13F | Jane Street Group, Llc | 147.791 | -53,46 | 4.335 | -63,76 | ||||
| 2026-02-13 | 13F | Quarry LP | 597 | 2.196,15 | 18 | |||||
| 2026-04-29 | 13F | CVA Family Office, LLC | 19 | 0,00 | 1 | |||||
| 2026-02-19 | 13F | Mcguire Capital Advisors Inc | 2.362 | 69 | ||||||
| 2026-02-17 | 13F | Northern Trust Corp | 974.848 | -2,48 | 28.592 | -24,05 | ||||
| 2026-02-13 | 13F | Great West Life Assurance Co /can/ | 52.266 | -30,66 | 2 | -50,00 | ||||
| 2026-02-11 | 13F | Los Angeles Capital Management Llc | 33.983 | 0,00 | 1.199 | -6,25 | ||||
| 2026-02-17 | 13F | Balyasny Asset Management Llc | 36.969 | 307,55 | 1.084 | 217,89 | ||||
| 2026-02-11 | 13F | Fox Run Management, L.l.c. | 19.532 | 573 | ||||||
| 2026-04-24 | 13F | SummerHaven Investment Management, LLC | 25.762 | -10,09 | 959 | 14,05 | ||||
| 2026-04-29 | 13F | Oregon Public Employees Retirement Fund | 13.800 | 0,00 | 513 | 26,98 | ||||
| 2026-02-10 | 13F | State of Wyoming | 14.409 | -18,42 | 423 | -36,54 | ||||
| 2026-04-23 | 13F | Lakewood Asset Management LLC | 17.274 | 5,01 | 643 | 33,20 | ||||
| 2026-04-29 | 13F | Police & Firemen's Retirement System of New Jersey | 18.143 | 6,56 | 675 | 35,27 | ||||
| 2026-04-30 | 13F | First Horizon Corp | 741 | 6,93 | 28 | 35,00 | ||||
| 2026-04-28 | 13F | SBI Securities Co., Ltd. | 1.230 | 564,86 | 46 | 800,00 | ||||
| 2026-02-17 | 13F | Maryland State Retirement & Pension System | 8.777 | 0,00 | 257 | -22,12 | ||||
| 2026-02-12 | 13F | Intrinsic Edge Capital Management LLC | 160.000 | -39,33 | 4.693 | -52,76 | ||||
| 2026-02-17 | 13F | Two Sigma Advisers, Lp | 166.200 | 49,19 | 4.875 | 16,19 | ||||
| 2026-04-23 | 13F | CBOE Vest Financial, LLC | 217.210 | 9,26 | 8.082 | 38,63 | ||||
| 2026-01-28 | 13F | Salomon & Ludwin, LLC | 811 | 72,55 | 25 | 47,06 | ||||
| 2026-02-17 | 13F | Brevan Howard Capital Management LP | 20.486 | 43,04 | 601 | 11,32 | ||||
| 2026-02-10 | 13F | Quantbot Technologies LP | 36.815 | 694,11 | 1.080 | 520,11 | ||||
| 2026-04-21 | 13F | Claro Advisors LLC | 7.941 | 295 | ||||||
| 2026-02-17 | 13F | Aquatic Capital Management LLC | 0 | -100,00 | 0 | |||||
| 2026-02-17 | 13F | Millennium Management Llc | 521.382 | -10,81 | 15.292 | -30,54 | ||||
| 2026-02-12 | 13F | Alps Advisors Inc | 80.932 | 0,18 | 2.374 | -21,99 | ||||
| 2026-02-06 | 13F | Gsa Capital Partners Llp | 61.197 | 392,25 | 2 | |||||
| 2025-11-17 | 13F | Caxton Associates Llp | 0 | -100,00 | 0 | -100,00 | ||||
| 2026-02-13 | 13F | Stifel Financial Corp | 71.935 | 17,17 | 2.110 | -8,78 | ||||
| 2026-02-11 | 13F | Franklin Resources Inc | 212.904 | 12,77 | 6.244 | -12,17 | ||||
| 2026-02-17 | 13F | Susquehanna Portfolio Strategies, LLC | 174.662 | 140,69 | 5.123 | 87,48 | ||||
| 2026-02-12 | 13F | Skandinaviska Enskilda Banken AB (publ) | 0 | -100,00 | 0 | |||||
| 2026-02-17 | 13F | Janus Henderson Group Plc | 29.952 | 0,00 | 879 | -22,07 | ||||
| 2026-02-10 | 13F | Mutual Of America Capital Management Llc | 6.910 | 1,04 | 203 | -21,40 | ||||
| 2026-02-12 | 13F | EntryPoint Capital, LLC | 0 | -100,00 | 0 | |||||
| 2025-11-14 | 13F | Axa S.a. | 0 | -100,00 | 0 | |||||
| 2026-02-06 | 13F | EverSource Wealth Advisors, LLC | 398 | -14,41 | 12 | -35,29 | ||||
| 2026-04-28 | 13F | LVZ Advisors, Inc. | 17.715 | 3,72 | 659 | 31,80 | ||||
| 2026-02-05 | 13F | Leuthold Group, Llc | 110.773 | -7,17 | 3.249 | -27,71 | ||||
| 2026-02-02 | 13F | Seizert Capital Partners, Llc | 115.009 | 35,74 | 3.373 | 5,74 | ||||
| 2026-02-17 | 13F | Freestone Grove Partners LP | 17.240 | 506 | ||||||
| 2026-02-04 | 13F | Versor Investments LP | 23.907 | 135,63 | 701 | 83,51 | ||||
| 2026-02-17 | 13F | Point72 Asset Management, L.P. | 78.159 | 2.292 | ||||||
| 2026-04-22 | 13F | Sterling Capital Management LLC | 15.873 | -37,60 | 591 | -20,91 | ||||
| 2026-02-11 | 13F | Picton Mahoney Asset Management | 28.477 | 11,64 | 835 | |||||
| 2026-04-21 | 13F | Gilpin Wealth Management, Llc | 8 | 166,67 | 0 | |||||
| 2026-02-17 | 13F | Aqr Capital Management Llc | 252.436 | -0,89 | 7.404 | -22,81 | ||||
| 2026-02-11 | 13F | Illinois Municipal Retirement Fund | 32.402 | 3,07 | 950 | -19,70 | ||||
| 2026-04-20 | 13F | Banque Cantonale Vaudoise | 9.075 | 0,00 | 338 | 27,07 | ||||
| 2026-01-21 | 13F | Unison Advisors LLC | 0 | -100,00 | 0 | |||||
| 2026-04-22 | 13F | Skylands Capital, LLC | 81.500 | 3.033 | ||||||
| 2026-02-17 | 13F | Clark Capital Management Group, Inc. | 386.674 | 16,57 | 11.341 | -9,21 | ||||
| 2026-02-11 | 13F | Vestcor Inc | 67.674 | 5,45 | 2 | -50,00 | ||||
| 2026-04-10 | 13F | Abound Wealth Management | 0 | -100,00 | 0 | |||||
| 2026-02-17 | 13F | Magnetar Financial LLC | 10.848 | 318 | ||||||
| 2026-01-23 | 13F | Assetmark, Inc | 114.534 | 7,88 | 3.359 | -15,98 | ||||
| 2026-02-17 | 13F | ExodusPoint Capital Management, LP | 0 | -100,00 | 0 | -100,00 | ||||
| 2026-02-17 | 13F | Susquehanna International Group, Llp | Call | 20.400 | 223,81 | 598 | 152,32 | |||
| 2026-02-12 | 13F | Federated Hermes, Inc. | 129 | -36,76 | 4 | -57,14 | ||||
| 2026-02-17 | 13F | State Of Wisconsin Investment Board | 53.129 | 22,33 | 1.558 | -4,71 | ||||
| 2026-02-17 | 13F | Susquehanna International Group, Llp | 18.524 | -54,32 | 543 | -64,44 | ||||
| 2026-02-17 | 13F | Susquehanna International Group, Llp | Put | 7.700 | 226 | |||||
| 2026-04-24 | 13F | ProShare Advisors LLC | 9.969 | -21,42 | 371 | -0,54 | ||||
| 2026-01-26 | 13F | Cwm, Llc | 2.440 | -79,10 | 0 | |||||
| 2026-01-26 | 13F | KBC Group NV | 2.654 | 52,44 | 0 | |||||
| 2026-05-01 | 13F | Hantz Financial Services, Inc. | 173 | 8,12 | 0 | |||||
| 2026-02-09 | 13F | Atlantic Trust, LLC | 0 | -100,00 | 0 | |||||
| 2025-11-14 | 13F | Point72 (DIFC) Ltd | 5.560 | -39,33 | 209 | -30,10 | ||||
| 2026-04-08 | 13F | NorthCrest Asset Manangement, LLC | 11.015 | -0,69 | 413 | 19,71 | ||||
| 2026-02-11 | 13F | Deutsche Bank Ag\ | 58.149 | 3,16 | 1.706 | -19,65 | ||||
| 2026-02-17 | 13F | Hancock Whitney Corp | 18.981 | 2,05 | 557 | -20,57 | ||||
| 2026-02-17 | 13F | Man Group plc | 38.364 | -62,12 | 1.125 | -70,50 | ||||
| 2026-02-17 | 13F | Kemnay Advisory Services Inc. | 3.391 | 99 | ||||||
| 2025-11-14 | 13F | Petrus Trust Company, LTA | 0 | -100,00 | 0 | |||||
| 2026-02-13 | 13F | Neuberger Berman Group LLC | 15.458 | 33,14 | 453 | 3,66 | ||||
| 2026-05-01 | 13F | Commonwealth Of Pennsylvania Public School Empls Retrmt Sys | 14.952 | -0,11 | 556 | 26,65 | ||||
| 2026-02-24 | 13F | MidFirst Bank | 28 | 1 | ||||||
| 2026-02-09 | 13F | Hartland & Co., LLC | 8 | -98,83 | 0 | -100,00 | ||||
| 2026-02-12 | 13F | Wealthspire Advisors, LLC | 0 | -100,00 | 0 | |||||
| 2025-11-07 | 13F | SG Capital Management LLC | 0 | -100,00 | 0 | -100,00 | ||||
| 2026-02-17 | 13F | Creative Planning | 0 | -100,00 | 0 | |||||
| 2026-02-06 | 13F | Pnc Financial Services Group, Inc. | 15.036 | -0,01 | 441 | -22,08 | ||||
| 2026-04-07 | 13F | Farther Finance Advisors, LLC | 1.643 | 29,17 | 62 | 67,57 | ||||
| 2026-04-29 | 13F | R Squared Ltd | 0 | -100,00 | 0 | |||||
| 2026-02-13 | 13F | Arrowstreet Capital, Limited Partnership | 502.416 | -2,66 | 14.736 | -24,19 | ||||
| 2026-02-12 | 13F | Hrt Financial Lp | 0 | -100,00 | 0 | |||||
| 2026-02-13 | 13F | Boston Partners | 39.251 | -95,82 | 1.157 | -96,69 | ||||
| 2026-04-21 | 13F | PharVision Advisers, LLC | 0 | -100,00 | 0 | |||||
| 2026-02-10 | 13F | Bnp Paribas Arbitrage, Sa | 160.586 | 473,13 | 4.710 | 346,35 | ||||
| 2026-02-17 | 13F | Credit Agricole S A | 50.000 | -47,01 | 1.466 | -58,74 | ||||
| 2026-02-12 | 13F | Riverwater Partners LLC | 7.393 | 0,00 | 217 | -22,30 | ||||
| 2026-02-17 | 13F | Bank Of America Corp /de/ | 237.287 | -5,48 | 6.960 | -26,39 | ||||
| 2025-11-14 | 13F | EAM Investors, LLC | 0 | -100,00 | 0 | |||||
| 2026-02-12 | 13F | CIBC Private Wealth Group, LLC | 454 | 88,38 | 13 | 44,44 | ||||
| 2025-11-14 | 13F | Wolverine Trading, Llc | Call | 0 | -100,00 | 0 | ||||
| 2026-02-11 | 13F | LPL Financial LLC | 11.934 | 31,74 | 350 | 2,64 | ||||
| 2026-02-13 | 13F | Parkside Financial Bank & Trust | 53 | -98,16 | 2 | -99,07 | ||||
| 2026-04-30 | 13F | Torren Management, LLC | 192 | 0,00 | 7 | 40,00 | ||||
| 2026-02-13 | 13F | Smartleaf Asset Management LLC | 1.211 | 0,00 | 36 | -20,00 | ||||
| 2026-04-07 | 13F | Signaturefd, Llc | 2.606 | 0,00 | 97 | 26,32 | ||||
| 2026-02-17 | 13F | Capital Fund Management S.a. | 92.427 | 87,57 | 2.711 | 46,09 | ||||
| 2026-02-13 | 13F | Kennondale Capital Management LLC | 112.476 | 0,00 | 3.299 | -22,13 | ||||
| 2026-02-09 | 13F | Jefferies Financial Group Inc. | 168.298 | 4.936 | ||||||
| 2026-02-17 | 13F | Grantham, Mayo, Van Otterloo & Co. LLC | 124.360 | -12,63 | 3.647 | -31,96 | ||||
| 2026-02-13 | 13F | Marshall Wace, Llp | 25.773 | 756 | ||||||
| 2026-02-17 | 13F | Russell Investments Group, Ltd. | 43.007 | -71,27 | 1.261 | -77,57 | ||||
| 2026-02-18 | 13F | Vident Advisory, LLC | 20.685 | 17,82 | 607 | -8,32 | ||||
| 2026-02-13 | 13F | American Century Companies Inc | 1.858.526 | 0,45 | 54.511 | -21,77 | ||||
| 2025-11-14 | 13F | Goldman Sachs Group Inc | Put | 0 | -100,00 | 0 | -100,00 | |||
| 2026-02-10 | 13F | Rothschild Investment Llc | 64.451 | -0,15 | 1.890 | -22,22 | ||||
| 2026-04-30 | 13F | Nuveen, LLC | 912.831 | -12,93 | 33.966 | 10,47 | ||||
| 2026-02-13 | 13F | Mariner, LLC | 8.400 | -10,42 | 247 | -30,03 | ||||
| 2026-01-29 | 13F | Comerica Bank | 38.131 | -6,02 | 1.118 | -26,83 | ||||
| 2026-01-29 | 13F | Cornerstone Investment Partners, LLC | 8.155 | 0,06 | 239 | -21,90 | ||||
| 2026-02-17 | 13F | New Vernon Capital Holdings II LLC | 9.056 | 0,00 | 266 | -22,29 | ||||
| 2026-04-30 | 13F | Valued Wealth Advisors LLC | 155 | 6 | ||||||
| 2025-11-05 | 13F | SOUTH STATE Corp | 0 | -100,00 | 0 | |||||
| 2026-02-17 | 13F | Trexquant Investment LP | 23.167 | -73,83 | 679 | -79,63 | ||||
| 2026-02-17 | 13F | Quantinno Capital Management LP | 24.829 | 4,41 | 728 | -18,66 | ||||
| 2026-02-12 | 13F | Integrated Quantitative Investments LLC | 67.374 | 50,13 | 1.976 | 16,92 | ||||
| 2025-11-14 | 13F | EAM Global Investors LLC | 0 | -100,00 | 0 | |||||
| 2026-04-20 | 13F | State of Alaska, Department of Revenue | 41.405 | -1,76 | 2 | 0,00 | ||||
| 2026-02-12 | 13F | Ankerstar Wealth, LLC | 18 | 1 | ||||||
| 2026-02-13 | 13F | Centiva Capital, LP | 0 | -100,00 | 0 | |||||
| 2026-02-17 | 13F | ISAM Funds (UK) Ltd | 0 | -100,00 | 0 | |||||
| 2025-11-07 | 13F | CenterBook Partners LP | 0 | -100,00 | 0 | |||||
| 2026-04-16 | 13F | Prairiewood Capital, LLC | 65.687 | -8,75 | 2.444 | 15,77 | ||||
| 2026-02-17 | 13F | Raymond James Financial Inc | 36.595 | 251,91 | 1.073 | 174,42 | ||||
| 2026-02-12 | 13F | Dimensional Fund Advisors Lp | 3.798.656 | -0,06 | 111.418 | -22,16 | ||||
| 2026-02-17 | 13F | Alliancebernstein L.p. | 70.732 | 0,20 | 2.075 | -21,97 | ||||
| 2026-04-08 | 13F | Wealth Enhancement Advisory Services, Llc | 19.186 | 107,91 | 307 | 3,73 | ||||
| 2025-11-13 | 13F | Css Llc/il | 0 | -100,00 | 0 | |||||
| 2026-04-24 | 13F | Yousif Capital Management, Llc | 16.134 | -1,87 | 600 | 15,61 | ||||
| 2026-02-11 | 13F | Manchester Capital Management LLC | 34 | 1 | ||||||
| 2026-02-17 | 13F | Clifford Capital Partners Llc | 653.257 | 19,12 | 19.160 | -7,22 | ||||
| 2026-02-12 | 13F | DRW Securities, LLC | 0 | -100,00 | 0 | |||||
| 2026-02-17 | 13F | Amundi | 8.908 | -18,19 | 261 | -33,25 | ||||
| 2026-02-13 | 13F | Edgestream Partners, L.P. | 70.030 | 2.054 | ||||||
| 2026-02-13 | 13F | Ubs Asset Management Americas Inc | 98.320 | -7,97 | 2.884 | -28,34 | ||||
| 2026-02-13 | 13F | Macquarie Group Ltd | 0 | -100,00 | 0 | |||||
| 2026-02-11 | 13F | O'shaughnessy Asset Management, Llc | 55.257 | -6,08 | 1.621 | -26,86 | ||||
| 2026-02-13 | 13F | Barclays Plc | 138.082 | 12,89 | 4.050 | -12,09 | ||||
| 2026-02-17 | 13F | Canada Pension Plan Investment Board | 29.600 | 1.245,45 | 868 | 958,54 | ||||
| 2026-02-09 | 13F | Legal & General Group Plc | 156.664 | -5,06 | 4.595 | -26,06 | ||||
| 2026-02-17 | 13F | Bridgeway Capital Management Inc | 83.738 | -9,90 | 2.456 | -29,83 | ||||
| 2026-01-30 | 13F | Us Bancorp \de\ | 332 | -13,09 | 10 | -35,71 | ||||
| 2026-02-13 | 13F | Martingale Asset Management L P | 101.341 | 0,76 | 2.972 | -21,52 | ||||
| 2026-01-08 | 13F | True Wealth Design, LLC | 0 | -100,00 | 0 | |||||
| 2026-02-13 | 13F | First Trust Advisors Lp | 2.905.796 | 10,61 | 85.227 | -13,85 | ||||
| 2026-02-17 | 13F | Dark Forest Capital Management Lp | 0 | -100,00 | 0 | -100,00 | ||||
| 2026-02-13 | 13F | Public Employees Retirement Association Of Colorado | 8.614 | 0,00 | 0 | |||||
| 2026-02-17 | 13F | Capstone Investment Advisors, Llc | 0 | -100,00 | 0 | -100,00 | ||||
| 2025-11-21 | 13F/A | CIBC Bancorp USA Inc. | 6.561 | 247 | ||||||
| 2026-02-13 | 13F | Manufacturers Life Insurance Company, The | 0 | -100,00 | 0 | |||||
| 2026-01-29 | 13F | Vanguard Group Inc | 4.465.353 | 2,66 | 130.969 | -20,05 | ||||
| 2026-04-28 | 13F | DGS Capital Management, LLC | 47.534 | 0,87 | 1.769 | 27,93 | ||||
| 2026-02-11 | 13F | Simplex Trading, Llc | Call | 20.800 | 610 | |||||
| 2026-02-17 | 13F | Fmr Llc | 9.916 | 95,54 | 291 | 52,63 | ||||
| 2026-02-11 | 13F | Simplex Trading, Llc | Put | 100 | -90,00 | 3 | ||||
| 2025-11-14 | 13F | Numerai GP LLC | 0 | -100,00 | 0 | |||||
| 2026-02-04 | 13F | Pacific Ridge Capital Partners, LLC | 50.370 | 14,58 | 1.477 | -10,76 | ||||
| 2026-02-13 | 13F | Natixis | 0 | -100,00 | 0 | |||||
| 2026-02-13 | 13F | SRS Capital Advisors, Inc. | 828 | -76,91 | 24 | -82,22 | ||||
| 2026-02-12 | 13F | Cibc World Markets Corp | 0 | -100,00 | 0 | |||||
| 2026-01-28 | 13F | Universal- Beteiligungs- und Servicegesellschaft mbH | 144.345 | -13,80 | 4.238 | -32,78 | ||||
| 2026-02-17 | 13F | MIRAE ASSET GLOBAL ETFS HOLDINGS Ltd. | 41.306 | 2,09 | 1.212 | -20,49 | ||||
| 2025-11-14 | 13F | Toroso Investments, LLC | 0 | -100,00 | 0 | -100,00 | ||||
| 2026-04-28 | 13F | Harbor Capital Advisors, Inc. | 22.547 | 80,04 | 1 |