Grundlæggende statistik
| Institutionelle aktier (lange) | 26.875.325 - 85,12% (ex 13D/G) - change of -1,71MM shares -4,42% MRQ |
| Institutionel værdi (lang) | $ 3.195.474 USD ($1000) |
Institutionelt ejerskab og aktionærer
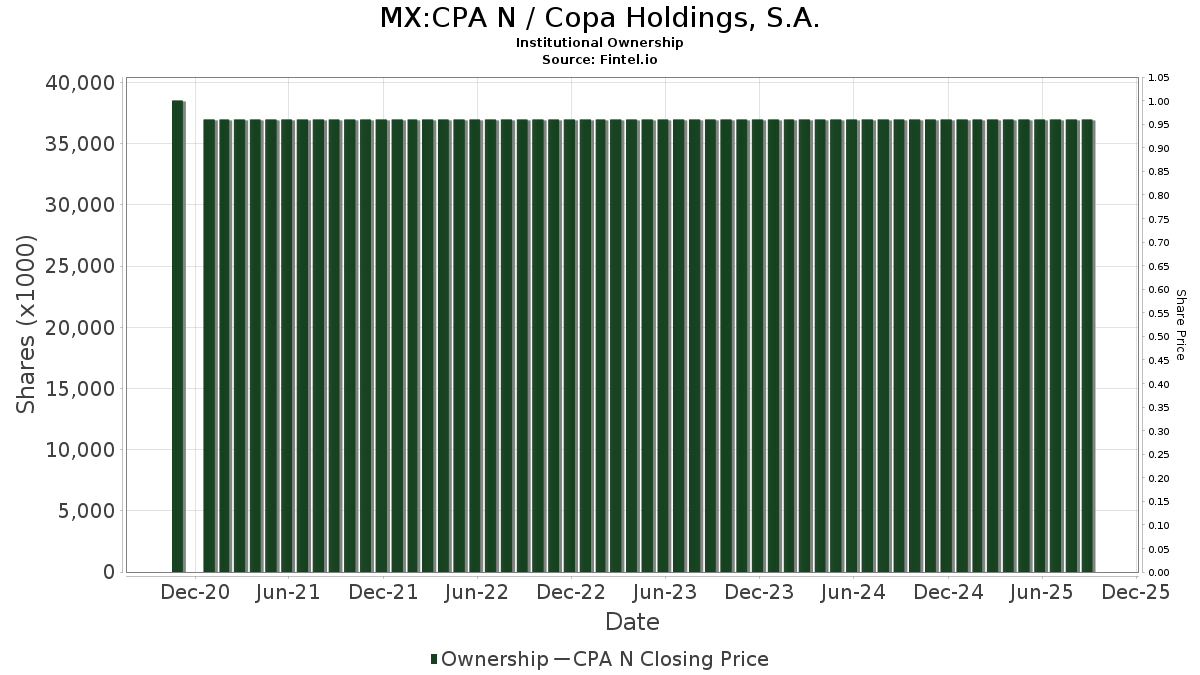
Copa Holdings, S.A. (MX:CPA N) har 294 institutionelle ejere og aktionærer, der har indsendt 13D/G- eller 13F-formularer til Securities Exchange Commission (SEC). Disse institutioner har i alt 26,875,325 aktier. Største aktionærer omfatter Capital World Investors, Baillie Gifford & Co, Sprucegrove Investment Management Ltd, Jpmorgan Chase & Co, Dimensional Fund Advisors Lp, Fmr Llc, Renaissance Technologies Llc, Driehaus Capital Management Llc, Captrust Financial Advisors, and Brandes Investment Partners, Lp .
Copa Holdings, S.A. (BMV:CPA N) institutionel ejerskabsstruktur viser aktuelle positioner i virksomheden efter institutioner og fonde, samt seneste ændringer i positionsstørrelse. Større aktionærer kan omfatte individuelle investorer, investeringsforeninger, hedgefonde eller institutioner. Skema 13D angiver, at investoren besidder (eller besidder) mere end 5 % af virksomheden og har til hensigt (eller har til hensigt at) aktivt at forfølge en ændring i forretningsstrategi. Skema 13G indikerer en passiv investering på over 5%.
Fondens stemningsscore
Fund Sentiment Score (fka Ownership Accumulation Score) finder de aktier, der bliver mest købt af fonde. Det er resultatet af en sofistikeret, multi-faktor kvantitativ model, der identificerer virksomheder med de højeste niveauer af institutionel akkumulering. Scoringsmodellen bruger en kombination af den samlede stigning i oplyste ejere, ændringerne i porteføljeallokeringer i disse ejere og andre målinger. Tallet går fra 0 til 100, hvor højere tal indikerer et højere niveau af akkumulering for sine jævnaldrende, og 50 er gennemsnittet.
Opdateringsfrekvens: Dagligt
Se Ownership Explorer, som giver en liste over højest rangerende virksomheder.
AI+ Ask Fintel’s AI assistant about Copa Holdings, S.A..
Select a question to share a public post with an AI-crafted answer.
Thinking of good questions…
13F og NPORT arkivering
Detaljer om 13F-arkivering er gratis. Detaljer om NP-ansøgninger kræver et premium-medlemskab. Grønne rækker angiver nye positioner. Røde rækker angiver lukkede positioner. Klik på linket ikon for at se den fulde transaktionshistorik.
Opgrader
for at låse premium-data op og eksportere til Excel ![]() .
.
| Fil dato | Kilde | Investor | Type | Gennemsnitlig pris (Øst) |
Aktier | Δ Aktier (%) |
Rapporteret Værdi ($1000) |
Δ Værdi (%) |
Port Alloc (%) |
|
|---|---|---|---|---|---|---|---|---|---|---|
| 2026-04-14 | 13F | Nbc Securities, Inc. | 13 | 0,00 | 1 | 0,00 | ||||
| 2026-02-13 | 13F | SRS Capital Advisors, Inc. | 32 | 77,78 | 4 | 50,00 | ||||
| 2026-02-04 | 13F | Twin Lakes Capital Management, LLC | 1 | 0,00 | 0 | |||||
| 2026-02-06 | 13F | Csenge Advisory Group | 1.828 | -0,49 | 220 | 0,92 | ||||
| 2026-04-20 | 13F | Kestra Private Wealth Services, Llc | 5.264 | -8,07 | 598 | -13,48 | ||||
| 2026-02-17 | 13F | Delaware Management Holdings, Inc. | 28.836 | 3.478 | ||||||
| 2026-02-03 | 13F | Virtus Family Office LLC | 40.220 | -0,35 | 4.851 | 1,15 | ||||
| 2026-01-12 | 13F | Rialto Wealth Management, LLC | 4 | 33,33 | 0 | |||||
| 2026-02-10 | 13F | Connor, Clark & Lunn Investment Management Ltd. | 20.322 | 895,69 | 2.451 | 912,81 | ||||
| 2026-04-23 | 13F | Oppenheimer & Co Inc | 0 | -100,00 | 0 | |||||
| 2026-02-10 | 13F | Globeflex Capital L P | 87.283 | 5,79 | 10.527 | 7,39 | ||||
| 2026-02-13 | 13F | Hudson Bay Capital Management LP | 0 | -100,00 | 0 | |||||
| 2026-02-17 | 13F/A | RBF Capital, LLC | 5.000 | -27,05 | 603 | -25,92 | ||||
| 2026-02-17 | 13F | XTX Topco Ltd | 4.321 | 521 | ||||||
| 2026-02-17 | 13F | Ameriprise Financial Inc | 192.481 | 447,51 | 23.203 | 455,47 | ||||
| 2026-02-17 | 13F | Driehaus Capital Management Llc | 670.657 | 2,49 | 80.888 | 4,03 | ||||
| 2026-02-13 | 13F | Mariner, LLC | 5.696 | -15,48 | 687 | -14,25 | ||||
| 2026-02-11 | 13F | Total Wealth Planning & Management, Inc. | 4.095 | -1,25 | 494 | 8,11 | ||||
| 2025-11-14 | 13F | Point72 Europe (London) LLP | 313 | 37 | ||||||
| 2026-04-07 | 13F | Park Avenue Securities Llc | 9.327 | -35,13 | 1 | 0,00 | ||||
| 2026-02-05 | 13F | IMG Wealth Management, Inc. | 0 | -100,00 | 0 | |||||
| 2026-04-24 | 13F | Legend Financial Advisors, Inc. | 7.997 | -0,66 | 909 | -6,39 | ||||
| 2026-02-05 | 13F | 1620 Investment Advisors, Inc. | 25 | 0,00 | 3 | 50,00 | ||||
| 2026-02-05 | 13F | Td Private Client Wealth Llc | 10 | 0,00 | 1 | 0,00 | ||||
| 2026-01-26 | 13F | Mirae Asset Global Investments Co., Ltd. | 575 | -23,33 | 69 | -22,47 | ||||
| 2026-02-17 | 13F | Raymond James Financial Inc | 467.285 | -11,04 | 56.359 | -9,70 | ||||
| 2026-01-15 | 13F | Nisa Investment Advisors, Llc | 6.200 | 0,00 | 748 | 1,49 | ||||
| 2026-02-13 | 13F | Transamerica Financial Advisors, Inc. | 1.656 | 12,12 | 200 | 13,71 | ||||
| 2026-02-11 | 13F | Winton Capital Group Ltd | 4.400 | 531 | ||||||
| 2026-04-15 | 13F | Merit Financial Group, LLC | 1.804 | -3,99 | 205 | -9,73 | ||||
| 2026-02-13 | 13F | Formula Growth Ltd | 15.500 | 0,00 | 1.869 | 1,52 | ||||
| 2026-02-13 | 13F | Neuberger Berman Group LLC | 6.442 | 9,91 | 777 | 11,49 | ||||
| 2025-11-14 | 13F | Strategic Wealth Partners, Ltd. | 82 | 10 | ||||||
| 2026-01-08 | 13F | Signet Financial Management, Llc | 2.908 | 5,98 | 351 | 7,36 | ||||
| 2026-02-18 | 13F | Mackenzie Financial Corp | 0 | -100,00 | 0 | |||||
| 2026-02-05 | 13F | Elyxium Wealth, LLC | 53 | 6 | ||||||
| 2026-04-16 | 13F | Diversified Trust Co | 11.527 | 1.310 | ||||||
| 2026-02-12 | 13F | Wealthspire Advisors, LLC | 0 | -100,00 | 0 | |||||
| 2026-02-13 | 13F | Wells Fargo & Company/mn | 34.300 | 80,44 | 4.137 | 83,17 | ||||
| 2026-04-08 | 13F | DiNuzzo Private Wealth, Inc. | 6 | 0,00 | 1 | |||||
| 2026-02-17 | 13F | Advisor Group Holdings, Inc. | 13.365 | -69,25 | 1.612 | -68,77 | ||||
| 2025-11-14 | 13F | Skopos Labs, Inc. | 0 | -100,00 | 0 | |||||
| 2026-01-26 | 13F | Private Trust Co Na | 130 | 34,02 | 16 | 36,36 | ||||
| 2026-04-20 | 13F | Concurrent Investment Advisors, LLC | 0 | -100,00 | 0 | -100,00 | ||||
| 2026-02-03 | 13F | SBI Securities Co., Ltd. | 710 | 9,06 | 86 | 10,39 | ||||
| 2026-02-06 | 13F | Harvest Portfolios Group Inc. | 4.380 | -5,81 | 528 | -4,35 | ||||
| 2026-04-22 | 13F | Pictet Asset Management Holding SA | 28.263 | -73,14 | 3.211 | -74,70 | ||||
| 2026-02-09 | 13F | Legal & General Group Plc | 330 | 0,00 | 40 | 0,00 | ||||
| 2026-02-13 | 13F | Cape Ann Asset Management Ltd | 219.800 | 0,83 | 26.510 | 2,35 | ||||
| 2026-02-02 | 13F | VELA Investment Management, LLC | 37.393 | 6,00 | 4.510 | 7,59 | ||||
| 2026-02-05 | 13F | Park Square Financial Group, LLC | 0 | -100,00 | 0 | -100,00 | ||||
| 2026-04-21 | 13F | Wasatch Advisors Inc | 217.648 | -52,14 | 24.727 | -54,92 | ||||
| 2026-02-11 | 13F | Brandes Investment Partners, Lp | 654.255 | 3,50 | 78.910 | 5,06 | ||||
| 2026-02-13 | 13F | Colony Group, LLC | 2.265 | 273 | ||||||
| 2026-02-17 | 13F | Captrust Financial Advisors | 654.830 | 1,88 | 78.979 | 3,41 | ||||
| 2026-02-13 | 13F | Walleye Capital LLC | Put | 2.200 | -37,14 | 265 | -36,14 | |||
| 2026-02-13 | 13F | Walleye Capital LLC | 3.099 | 31,65 | 374 | 33,69 | ||||
| 2026-02-13 | 13F | Walleye Capital LLC | Call | 12.700 | 309,68 | 1.532 | 316,03 | |||
| 2026-02-09 | 13F | Knights of Columbus Asset Advisors LLC | 76.170 | 1,32 | 9.187 | 2,84 | ||||
| 2025-11-14 | 13F | Petrus Trust Company, LTA | 0 | -100,00 | 0 | |||||
| 2025-11-14 | 13F | Wolverine Trading, Llc | 11.359 | 233,40 | 1.354 | 267,93 | ||||
| 2025-11-14 | 13F | Wolverine Trading, Llc | Call | 10.700 | -69,25 | 1.276 | -66,08 | |||
| 2026-01-30 | 13F | Torren Management, LLC | 90 | 11 | ||||||
| 2026-02-06 | 13F | HighTower Advisors, LLC | 5.496 | -3,19 | 663 | -1,78 | ||||
| 2025-11-14 | 13F | Wolverine Trading, Llc | Put | 10.000 | 31,58 | 1.192 | 45,19 | |||
| 2026-04-16 | 13F | Toth Financial Advisory Corp | 300 | -31,03 | 34 | -34,62 | ||||
| 2026-01-29 | 13F | Marathon Capital Management | 51.553 | -27,77 | 6.218 | -26,69 | ||||
| 2026-02-03 | 13F | Strengthening Families & Communities, LLC | 15 | 2 | ||||||
| 2026-02-17 | 13F | Northern Trust Corp | 4.864 | -0,27 | 587 | 1,21 | ||||
| 2026-04-17 | 13F | Bell Investment Advisors, Inc | 409 | -7,88 | 46 | -13,21 | ||||
| 2026-04-24 | 13F | Sumitomo Mitsui DS Asset Management Company, Ltd | 2.689 | -31,73 | 305 | -35,79 | ||||
| 2026-04-01 | 13F | Confluence Investment Management Llc | 1.960 | 4,26 | 223 | -1,77 | ||||
| 2026-02-02 | 13F | Cornerstone Planning Group LLC | 55 | 0,00 | 7 | 16,67 | ||||
| 2026-02-09 | 13F | Keating Financial Advisory Services, Inc. | 17 | 2 | ||||||
| 2026-02-12 | 13F | Wishbone Management, LP | 472.500 | 0,00 | 56.988 | 1,51 | ||||
| 2026-04-13 | 13F | Mather Group, Llc. | 18 | 2 | ||||||
| 2026-02-17 | 13F | Jones Financial Companies Lllp | 424 | 16,48 | 51 | 21,43 | ||||
| 2026-02-12 | 13F | Rossby Financial, LCC | 32 | 0,00 | 4 | 0,00 | ||||
| 2026-02-13 | 13F | Thomist Capital Management, LP | 11.660 | 139,18 | 1.410 | 142,51 | ||||
| 2026-02-04 | 13F | Ameritas Advisory Services, LLC | 1.678 | 202 | ||||||
| 2026-04-10 | 13F | Novem Group | 8.413 | 4,28 | 956 | -1,85 | ||||
| 2026-02-05 | 13F | AlphaCore Capital LLC | 2.533 | 306 | ||||||
| 2026-02-12 | 13F | Empirical Finance, LLC | 38.850 | 0,00 | 4.686 | 1,49 | ||||
| 2025-11-19 | 13F | Sunbelt Securities, Inc. | 0 | -100,00 | 0 | -100,00 | ||||
| 2026-02-13 | 13F | Mml Investors Services, Llc | 11.360 | 44,03 | 1.370 | 46,21 | ||||
| 2026-02-12 | 13F | Hyperion Capital Advisors LP | 8.400 | 0,00 | 1.013 | 1,50 | ||||
| 2026-02-11 | 13F | Jpmorgan Chase & Co | 1.647.779 | 2,80 | 198.739 | 4,35 | ||||
| 2026-04-14 | 13F | Bay Harbor Wealth Management, LLC | 6 | 100,00 | 1 | |||||
| 2026-02-13 | 13F | Pinnacle Wealth Planning Services, Inc. | 87 | 10 | ||||||
| 2026-02-11 | 13F | Group One Trading, L.p. | Call | 4.000 | 900,00 | 482 | 925,53 | |||
| 2026-02-17 | 13F | Shellback Capital, LP | 50.036 | 0,00 | 6.035 | 1,50 | ||||
| 2026-02-11 | 13F | Group One Trading, L.p. | Put | 600 | -83,78 | 72 | -83,60 | |||
| 2026-04-20 | 13F | Assenagon Asset Management S.A. | 0 | -100,00 | 0 | |||||
| 2026-02-11 | 13F | Group One Trading, L.p. | 45 | -86,15 | 5 | -86,84 | ||||
| 2025-11-13 | 13F | BW Gestao de Investimentos Ltda. | 0 | -100,00 | 0 | -100,00 | ||||
| 2026-02-13 | 13F | Stifel Financial Corp | 7.899 | 55,00 | 954 | 57,52 | ||||
| 2026-02-09 | 13F | Huntington National Bank | 1 | 0,00 | 0 | |||||
| 2026-02-13 | 13F | Walleye Trading LLC | 0 | -100,00 | 0 | -100,00 | ||||
| 2026-02-17 | 13F | Cetera Investment Advisers | 26.843 | 14,73 | 3.238 | 16,48 | ||||
| 2026-02-06 | 13F | Handelsbanken Fonder AB | 7.900 | 0,00 | 1 | |||||
| 2026-02-17 | 13F | Trexquant Investment LP | 28.996 | 3.497 | ||||||
| 2026-01-22 | 13F | Richardson Financial Services Inc. | 537 | 11,88 | 65 | 12,28 | ||||
| 2026-02-13 | 13F | MAI Capital Management | 68 | 277,78 | 8 | 300,00 | ||||
| 2026-02-17 | 13F | Two Sigma Investments, Lp | 284.691 | 24,28 | 34.337 | 26,15 | ||||
| 2026-02-13 | 13F | Aptus Capital Advisors, LLC | 65.822 | 0,43 | 7.939 | 1,94 | ||||
| 2026-01-30 | 13F | Us Bancorp \de\ | 269 | 6,32 | 32 | 6,67 | ||||
| 2026-03-03 | 13F/A | Caitong International Asset Management Co., Ltd | 450 | 196,05 | 54 | 200,00 | ||||
| 2025-11-12 | 13F | Victory Capital Management Inc | 0 | -100,00 | 0 | |||||
| 2026-02-10 | 13F | Envestnet Asset Management Inc | 111.655 | 6,67 | 13.467 | 8,27 | ||||
| 2026-04-16 | 13F | Everstar Asset Management, LLC | 8.607 | 1,64 | 978 | -4,31 | ||||
| 2026-02-17 | 13F | Voloridge Investment Management, Llc | 0 | -100,00 | 0 | |||||
| 2026-02-13 | 13F | Marshall Wace, Llp | 163.349 | 19.702 | ||||||
| 2026-02-17 | 13F | Mirabella Financial Services Llp | 0 | -100,00 | 0 | |||||
| 2026-02-12 | 13F | Jane Street Group, Llc | 3.477 | 88,76 | 419 | 92,20 | ||||
| 2026-04-22 | 13F | Sterling Capital Management LLC | 1.842 | -36,55 | 209 | -40,29 | ||||
| 2026-02-12 | 13F | Jane Street Group, Llc | Put | 24.100 | -57,72 | 2.907 | -57,09 | |||
| 2026-02-02 | 13F | Core Alternative Capital | 100 | 0,00 | 12 | 9,09 | ||||
| 2026-02-12 | 13F | Jane Street Group, Llc | Call | 15.800 | -69,62 | 1.906 | -69,16 | |||
| 2026-02-13 | 13F | Atlas Capital Advisors Llc | 7.385 | -4,15 | 891 | 5,08 | ||||
| 2026-01-27 | 13F | TD Waterhouse Canada Inc. | 9.321 | 4,55 | 1.124 | 7,25 | ||||
| 2026-02-17 | 13F | Fmr Llc | 1.320.334 | -1,13 | 159.245 | 0,36 | ||||
| 2026-02-17 | 13F | Public Employees Retirement System Of Ohio | 92.907 | 0,00 | 11.206 | 1,50 | ||||
| 2026-02-10 | 13F | Bnp Paribas Arbitrage, Sa | 453 | 26,89 | 55 | 28,57 | ||||
| 2026-01-29 | 13F | IMC-Chicago, LLC | Put | 12.600 | -60,50 | 1.520 | -59,92 | |||
| 2026-04-16 | 13F | SG Americas Securities, LLC | 8.454 | 51,78 | 1 | |||||
| 2026-01-29 | 13F | IMC-Chicago, LLC | Call | 25.800 | 2,79 | 3.112 | 4,33 | |||
| 2026-02-17 | 13F | Silvercrest Asset Management Group Llc | 17.497 | 3,87 | 2.110 | 5,45 | ||||
| 2026-02-10 | 13F | Savant Capital, LLC | 2.988 | 27,09 | 360 | 29,03 | ||||
| 2026-02-13 | 13F | Smartleaf Asset Management LLC | 93 | 11 | ||||||
| 2026-04-07 | 13F | Farther Finance Advisors, LLC | 434 | 48,12 | 51 | 45,71 | ||||
| 2026-02-12 | 13F | Hrt Financial Lp | 67.800 | 8 | ||||||
| 2026-04-23 | 13F | Klein Pavlis & Peasley Financial, Inc. | 7.209 | 0,80 | 819 | -4,99 | ||||
| 2026-02-09 | 13F | Kestra Investment Management, LLC | 13.392 | -6,90 | 1.615 | -5,50 | ||||
| 2026-02-10 | 13F | Ellevest, Inc. | 4.957 | -13,78 | 598 | -12,59 | ||||
| 2026-01-16 | 13F | Marquette Asset Management, LLC | 0 | -100,00 | 0 | |||||
| 2026-02-13 | 13F | Barclays Plc | 0 | -100,00 | 0 | |||||
| 2026-04-24 | 13F | Severin Investments, LLC | 2.072 | -57,24 | 235 | -59,76 | ||||
| 2026-02-06 | 13F | Pnc Financial Services Group, Inc. | 3.030 | 1,47 | 365 | 3,11 | ||||
| 2026-01-16 | 13F | Standard Life Aberdeen plc | 46.611 | -17,21 | 5.622 | -15,23 | ||||
| 2026-02-02 | 13F | Fifth Third Bancorp | 429 | 0,00 | 52 | 2,00 | ||||
| 2026-04-24 | 13F | Marathon Asset Mgmt Ltd | 424.158 | 3,56 | 48.189 | -2,45 | ||||
| 2026-02-06 | 13F | Larson Financial Group LLC | 100 | 58,73 | 12 | 71,43 | ||||
| 2026-04-14 | 13F | Seven Mile Advisory | 2.937 | -4,58 | 334 | -10,24 | ||||
| 2026-02-17 | 13F | Mercer Global Advisors Inc /adv | 2.778 | 335 | ||||||
| 2026-02-13 | 13F | Ariel Investments, Llc | 8.752 | 1.056 | ||||||
| 2026-01-21 | 13F | Newbridge Financial Services Group, Inc. | 0 | 0 | ||||||
| 2025-12-09 | 13F/A | Tudor Investment Corp Et Al | Call | 0 | -100,00 | 0 | ||||
| 2026-02-13 | 13F | Dodge & Cox | 3.950 | 0,00 | 476 | 1,49 | ||||
| 2026-02-17 | 13F | Pinnacle Financial Partners, Inc. | 3.367 | 406 | ||||||
| 2026-02-13 | 13F | Citigroup Inc | 6.032 | -15,66 | 728 | -14,37 | ||||
| 2025-11-04 | 13F | Guerra Advisors Inc | 2 | 0 | ||||||
| 2026-02-19 | 13F | CI Private Wealth, LLC | 6.456 | 23,58 | 779 | 25,48 | ||||
| 2026-02-17 | 13F | Two Sigma Advisers, Lp | 120.300 | 9,07 | 14.509 | 10,71 | ||||
| 2026-02-05 | 13F | Leuthold Group, Llc | 3.027 | 0,13 | 365 | 1,67 | ||||
| 2026-02-03 | 13F | Privium Fund Management (UK) Ltd | 7.041 | -12,44 | 849 | -10,16 | ||||
| 2026-02-17 | 13F | PDT Partners, LLC | 14.267 | -26,33 | 1.721 | -25,25 | ||||
| 2026-02-06 | 13F | Global Retirement Partners, LLC | 1.698 | 14,04 | 205 | 15,91 | ||||
| 2026-01-28 | 13F | Geneos Wealth Management Inc. | 33 | 4 | ||||||
| 2026-03-12 | 13F/A | Peak6 Llc | Call | 0 | -100,00 | 0 | -100,00 | |||
| 2026-04-10 | 13F | Marshall Financial Group LLC | 5.936 | 4,21 | 674 | -1,75 | ||||
| 2026-02-12 | 13F | Logan Capital Management Inc | 0 | -100,00 | 0 | |||||
| 2026-02-03 | 13F | Sprucegrove Investment Management Ltd | 1.911.095 | -16,98 | 230.497 | -15,73 | ||||
| 2026-02-12 | 13F | Campbell & CO Investment Adviser LLC | 1.734 | -38,53 | 209 | -37,61 | ||||
| 2026-04-22 | 13F | Spire Wealth Management | 25 | 0,00 | 3 | -33,33 | ||||
| 2026-04-06 | 13F | Versant Capital Management, Inc | 388 | 130,95 | 44 | 120,00 | ||||
| 2026-01-28 | 13F | Retirement Planning Co of New England, Inc. | 1.957 | 0,00 | 236 | 1,72 | ||||
| 2026-03-25 | 13F/A | Lifetime Wealth Management P.C. | 35.775 | 4.315 | ||||||
| 2026-04-08 | 13F | Wealth Enhancement Advisory Services, Llc | 1.966 | 18,43 | 225 | 6,64 | ||||
| 2026-02-12 | 13F | Ruane, Cunniff & Goldfarb L.P. | 2.555 | 0,00 | 308 | 1,65 | ||||
| 2026-02-13 | 13F | Itau Unibanco Holding S.A. | 127.532 | 505,05 | 15.332 | 512,26 | ||||
| 2026-02-10 | 13F/A | Northwestern Mutual Wealth Management Co | 15 | -21,05 | 2 | -50,00 | ||||
| 2026-04-17 | 13F | Vermillion Wealth Management, Inc. | 3 | 0 | ||||||
| 2026-02-11 | 13F | Capital World Investors | 4.603.671 | 0,66 | 555.249 | 2,17 | ||||
| 2026-02-17 | 13F | FIL Ltd | 6.815 | 0,00 | 822 | 1,48 | ||||
| 2026-02-17 | 13F | Par Capital Management Inc | 157.197 | 6,21 | 18.960 | 7,81 | ||||
| 2026-02-04 | 13F | BCJ Capital Management, LLC | 89.192 | 17,09 | 10.757 | 18,85 | ||||
| 2026-04-22 | 13F | Janney Montgomery Scott LLC | 87.155 | 6,09 | 10 | 0,00 | ||||
| 2026-01-26 | 13F | Cwm, Llc | 259 | 4,02 | 0 | |||||
| 2026-02-17 | 13F | Hbk Investments L P | Put | 15.100 | -96,77 | 1.821 | -96,72 | |||
| 2026-01-28 | 13F | Ruffer LLP | 48.819 | 32,92 | 5.897 | 35,16 | ||||
| 2026-02-05 | 13F/A | Truxt Investmentos Ltda. | 13.576 | 1.613 | ||||||
| 2026-04-08 | 13F | Miracle Mile Advisors, LLC | 4.279 | -1,41 | 486 | -7,07 | ||||
| 2026-02-17 | 13F | Millennium Management Llc | 117.930 | -73,99 | 14.224 | -73,60 | ||||
| 2026-02-17 | 13F | Royal Bank Of Canada | 15.043 | -59,19 | 1.813 | -58,60 | ||||
| 2026-02-11 | 13F | Empowered Funds, LLC | 243 | 29 | ||||||
| 2026-02-19 | 13F | Invesco Ltd. | 67.810 | -28,24 | 8.179 | -27,16 | ||||
| 2026-04-23 | 13F | SJS Investment Consulting Inc. | 292 | 284,21 | 33 | 266,67 | ||||
| 2026-02-13 | 13F | Kestra Advisory Services, LLC | 0 | -100,00 | 0 | |||||
| 2026-02-13 | 13F | Pathstone Holdings, LLC | 16.532 | -3,00 | 1.994 | -1,58 | ||||
| 2025-11-06 | 13F | Whipplewood Advisors, LLC | 0 | -100,00 | 0 | -100,00 | ||||
| 2026-04-21 | 13F | Aaron Wealth Advisors LLC | 3.295 | -29,67 | 374 | -33,81 | ||||
| 2026-02-17 | 13F | Tower Research Capital LLC (TRC) | 0 | -100,00 | 0 | |||||
| 2026-04-15 | 13F | Fortitude Family Office, LLC | 49 | 53,12 | 6 | 66,67 | ||||
| 2026-02-17 | 13F | Schonfeld Strategic Advisors LLC | 39.936 | -67,18 | 4.817 | -66,69 | ||||
| 2026-02-17 | 13F | Freestone Grove Partners LP | 0 | -100,00 | 0 | |||||
| 2026-02-17 | 13F | Advisory Services Network, LLC | 0 | -100,00 | 0 | |||||
| 2026-01-22 | 13F | Massachusetts Financial Services Co /ma/ | 13.250 | -24,18 | 1.598 | -23,03 | ||||
| 2026-02-17 | 13F | Point72 Asset Management, L.P. | 0 | -100,00 | 0 | |||||
| 2026-02-04 | 13F | Summit Wealth Group Llc / Co | 0 | -100,00 | 0 | -100,00 | ||||
| 2026-02-05 | 13F | Allworth Financial LP | 5 | 400,00 | 1 | |||||
| 2026-02-17 | 13F | Cape Investment Advisory, Inc. | 614 | 74 | ||||||
| 2026-01-23 | 13F | Altfest L J & Co Inc | 0 | -100,00 | 0 | |||||
| 2026-02-09 | 13F | Optimist Retirement Group LLC | 2.337 | 0,00 | 282 | 1,44 | ||||
| 2026-02-17 | 13F | Amundi | 53.000 | -14,63 | 6.392 | -14,89 | ||||
| 2025-11-17 | 13F | PharVision Advisers, LLC | 0 | -100,00 | 0 | |||||
| 2026-02-12 | 13F | Renaissance Technologies Llc | 772.528 | -12,95 | 93.175 | -11,64 | ||||
| 2026-02-10 | 13F | Semanteon Capital Management, LP | 0 | -100,00 | 0 | |||||
| 2026-02-10 | 13F | Goldman Sachs Group Inc | 266.471 | 9,62 | 32.139 | 11,28 | ||||
| 2026-02-11 | 13F | LPL Financial LLC | 39.779 | 17,62 | 4.798 | 19,39 | ||||
| 2026-02-12 | 13F | Provida Pension Fund Administrator | 0 | -100,00 | 0 | |||||
| 2026-02-13 | 13F | Sei Investments Co | 334.197 | -18,44 | 40.307 | -17,21 | ||||
| 2026-02-12 | 13F | Sagil Capital Llp | 53.854 | 6.495 | ||||||
| 2026-02-13 | 13F | Rhumbline Advisers | 0 | -100,00 | 0 | |||||
| 2026-02-03 | 13F | Ethic Inc. | 47.541 | -0,94 | 5.734 | 0,54 | ||||
| 2026-02-13 | 13F | Public Sector Pension Investment Board | 79.656 | 9.607 | ||||||
| 2026-02-17 | 13F | nVerses Capital, LLC | 2.461 | 297 | ||||||
| 2026-02-10 | 13F | Acadian Asset Management Llc | 0 | -100,00 | 0 | |||||
| 2026-02-12 | 13F | Principal Securities, Inc. | 9.474 | 19,18 | 1.143 | 20,97 | ||||
| 2026-02-17 | 13F | Russell Investments Group, Ltd. | 13.149 | 1,23 | 1.586 | 2,79 | ||||
| 2026-04-21 | 13F | Hosking Partners LLP | 64.878 | -0,86 | 7.371 | -6,61 | ||||
| 2026-02-09 | 13F | Optimize Financial Inc | 2.723 | 1,34 | 328 | 2,82 | ||||
| 2026-02-10 | 13F | Marietta Investment Partners Llc | 7.667 | -1,22 | 925 | 0,22 | ||||
| 2026-01-12 | 13F | CVA Family Office, LLC | 26 | 0,00 | 3 | 0,00 | ||||
| 2026-02-11 | 13F | O'shaughnessy Asset Management, Llc | 3.757 | -14,32 | 453 | -13,05 | ||||
| 2026-04-15 | 13F | Bayforest Capital Ltd | 479 | -77,98 | 54 | -79,39 | ||||
| 2026-04-02 | 13F | Ares Financial Consulting, LLC | 122 | 430,43 | 14 | 600,00 | ||||
| 2026-01-14 | 13F | ORG Partners LLC | 10 | -82,46 | 1 | -83,33 | ||||
| 2025-11-05 | 13F | SPC Financial, Inc. | 1.819 | 0,00 | 216 | 8,00 | ||||
| 2026-01-30 | 13F | Caldwell Securities, Inc | 16 | 0,00 | 2 | 0,00 | ||||
| 2026-02-10 | 13F | Quantbot Technologies LP | 9.703 | 31,23 | 1.170 | 33,26 | ||||
| 2026-02-12 | 13F | Insigneo Advisory Services, Llc | 1.809 | 218 | ||||||
| 2026-02-02 | 13F | CM Management, LLC | 2.500 | -72,22 | 302 | -71,84 | ||||
| 2026-01-23 | 13F | Assetmark, Inc | 184 | 32,37 | 22 | 37,50 | ||||
| 2026-02-17 | 13F | Summit Trail Advisors, Llc | 10.284 | 146,56 | 1.240 | 150,51 | ||||
| 2026-02-06 | 13F | Gsa Capital Partners Llp | 17.397 | -12,07 | 2 | 0,00 | ||||
| 2026-02-10 | 13F | Commonwealth Of Pennsylvania Public School Empls Retrmt Sys | 58.811 | 0,00 | 7.093 | 1,52 | ||||
| 2026-03-13 | 13F/A | Pensionmark Financial Group, Llc | 1.844 | 222 | ||||||
| 2026-02-10 | 13F | Bank of New York Mellon Corp | 2.908 | 9,12 | 351 | 10,76 | ||||
| 2025-11-13 | 13F | Deutsche Bank Ag\ | 0 | -100,00 | 0 | -100,00 | ||||
| 2026-02-12 | 13F | Dimensional Fund Advisors Lp | 1.344.720 | 2,41 | 162.185 | 3,95 | ||||
| 2026-02-05 | 13F | HFM Investment Advisors, LLC | 3 | 0,00 | 0 | |||||
| 2026-02-06 | 13F | Leonteq Securities AG | 110 | -63,46 | 13 | -62,86 | ||||
| 2026-04-13 | 13F | IFP Advisors, Inc | 21 | 0,00 | 2 | 0,00 | ||||
| 2026-02-13 | 13F | Y-Intercept (Hong Kong) Ltd | 8.402 | 1.013 | ||||||
| 2026-02-13 | 13F | Fourth Sail Capital LP | 130.200 | 15.703 | ||||||
| 2026-02-13 | 13F | Morgan Stanley | 270.039 | 2,24 | 32.570 | 3,78 | ||||
| 2026-02-14 | 13F | Rockefeller Capital Management L.P. | 7.052 | 3,95 | 851 | 5,46 | ||||
| 2026-01-29 | 13F | McGowan Group Asset Management, Inc. | 20.209 | 11,41 | 2.437 | 13,09 | ||||
| 2026-02-10 | 13F | Catalyst Capital Advisors LLC | 700 | 0,00 | 84 | 1,20 | ||||
| 2026-04-14 | 13F | Focus Financial Network, Inc. | 2.238 | 2,05 | 254 | -3,79 | ||||
| 2026-02-12 | 13F | BlackRock, Inc. | 10.490 | 38,28 | 1.265 | 40,40 | ||||
| 2026-02-17 | 13F | Artisan Partners Limited Partnership | 253.729 | 2,75 | 30.602 | 4,30 | ||||
| 2026-04-24 | 13F | Deprince Race & Zollo Inc | 26.479 | 92,06 | 3.008 | 80,99 | ||||
| 2026-04-20 | 13F | CWA Asset Management Group, LLC | 17.635 | 17,14 | 2.004 | 10,36 | ||||
| 2026-02-10 | 13F | CIBC World Markets Inc. | 57.780 | 9,33 | 6.969 | 10,97 | ||||
| 2026-02-17 | 13F | BTG Pactual Asset Management US LLC | 2.228 | 269 | ||||||
| 2025-11-14 | 13F | Binnacle Investments Inc | 4 | 0 | ||||||
| 2026-02-17 | 13F | Credit Agricole S A | 18.827 | 0,00 | 2.271 | 1,48 | ||||
| 2026-02-13 | 13F | Evelyn Partners Investment Management Services Ltd | 528 | 0,00 | 64 | 1,61 | ||||
| 2026-02-03 | 13F | We Are One Seven, LLC | 3.743 | 3,08 | 451 | 4,64 | ||||
| 2026-02-06 | 13F | Carrhae Capital LLP | 124.717 | 15.042 | ||||||
| 2026-02-12 | 13F | Triumph Capital Management | 475 | 58,33 | 57 | 62,86 | ||||
| 2026-04-20 | 13F | Inscription Capital, LLC | 2.312 | 263 | ||||||
| 2026-04-15 | 13F | Redhawk Wealth Advisors, Inc. | 7.894 | -4,23 | 897 | -9,86 | ||||
| 2026-02-11 | 13F | Parallel Advisors, LLC | 3 | -88,00 | 0 | -100,00 | ||||
| 2026-04-15 | 13F | Paragon Capital Management Ltd | 1.871 | -5,07 | 213 | -10,55 | ||||
| 2026-02-17 | 13F | Wealth Watch Advisors, INC | 7 | 0,00 | 1 | |||||
| 2026-02-17 | 13F | Qube Research & Technologies Ltd | 22.683 | -45,00 | 2.736 | -44,18 | ||||
| 2025-10-31 | 13F | Frazier Financial Advisors, LLC | 0 | -100,00 | 0 | |||||
| 2025-11-13 | 13F | Aristides Capital LLC | 0 | -100,00 | 0 | |||||
| 2025-11-07 | 13F | Atticus Wealth Management, Llc | 0 | -100,00 | 0 | |||||
| 2026-02-13 | 13F | Aigen Investment Management, Lp | 0 | -100,00 | 0 | |||||
| 2025-11-12 | 13F/A | Norges Bank | 2.345 | 0,00 | 220 | -1,35 | ||||
| 2026-02-17 | 13F | Balyasny Asset Management Llc | 258.251 | 428,44 | 31.148 | 436,46 | ||||
| 2026-02-13 | 13F | Walleye Trading LLC | Call | 13.000 | 160,00 | 1.568 | 163,80 | |||
| 2026-02-17 | 13F | Scarborough Advisors, LLC | 95 | 0,00 | 11 | 0,00 | ||||
| 2026-03-06 | 13F | Hsbc Holdings Plc | 41.753 | -22,00 | 5.056 | -20,10 | ||||
| 2026-01-28 | 13F | U S Global Investors Inc | 33.720 | 1,07 | 4.067 | 2,57 | ||||
| 2026-02-13 | 13F | Walleye Trading LLC | Put | 7.000 | 169,23 | 844 | 174,03 | |||
| 2026-02-13 | 13F | Macquarie Group Ltd | 0 | -100,00 | 0 | |||||
| 2026-02-17 | 13F | Lazard Asset Management Llc | 32.492 | -26,80 | 3.919 | -25,70 | ||||
| 2026-04-24 | 13F | Root Financial Partners, LLC | 174 | 1,16 | 20 | -5,00 | ||||
| 2026-02-17 | 13F | MIRAE ASSET GLOBAL ETFS HOLDINGS Ltd. | 120.437 | 1,33 | 14.526 | 2,85 | ||||
| 2026-01-23 | 13F | Burney Co/ | 6.032 | 1,87 | 728 | 3,41 | ||||
| 2026-01-23 | 13F | Baillie Gifford & Co | 2.747.078 | -0,66 | 331.325 | 0,84 | ||||
| 2026-02-11 | 13F | Simplex Trading, Llc | Call | 2.600 | -70,79 | 314 | 31.200,00 | |||
| 2026-02-17 | 13F | Quantinno Capital Management LP | 73.780 | 38,73 | 8.899 | 40,81 | ||||
| 2026-01-15 | 13F | Range Financial Group LLC | 18.154 | 10,71 | 2.190 | 12,37 | ||||
| 2026-02-03 | 13F | McIlrath & Eck, LLC | 1.152 | 97,94 | 139 | 100,00 | ||||
| 2026-02-11 | 13F | Convergence Financial, LLC | 3.966 | 478 | ||||||
| 2026-02-17 | 13F | Private Advisor Group, LLC | 4.708 | 118,16 | 568 | 121,48 | ||||
| 2025-11-05 | 13F | SOUTH STATE Corp | 0 | -100,00 | 0 | |||||
| 2026-02-11 | 13F | Simplex Trading, Llc | Put | 21.100 | 71,54 | 2.545 | 254.300,00 | |||
| 2026-02-17 | 13F | Tudor Investment Corp Et Al | 8.191 | 988 | ||||||
| 2026-02-12 | 13F | CIBC Private Wealth Group, LLC | 134 | 86,11 | 16 | 100,00 | ||||
| 2026-02-12 | 13F | Cloud Capital Management, LLC | 0 | -100,00 | 0 | |||||
| 2026-02-17 | 13F | Aquatic Capital Management LLC | 9.443 | 122,29 | 1.139 | 125,79 | ||||
| 2026-04-22 | 13F | 1492 Capital Management LLC | 53.743 | -11,65 | 6.106 | -16,78 | ||||
| 2025-11-12 | 13F | Simplex Trading, Llc | 0 | -100,00 | 0 | |||||
| 2026-04-17 | 13F | IFC & Insurance Marketing, Inc. | 0 | -100,00 | 0 | |||||
| 2026-04-14 | 13F | Zrc Wealth Management, Llc | 49 | 22,50 | 6 | 25,00 | ||||
| 2026-04-20 | 13F | State of Alaska, Department of Revenue | 28.720 | 0,00 | 3 | 0,00 | ||||
| 2026-02-13 | 13F | SPX Equities Gestao de Recursos Ltda | 393.542 | -3,22 | 47.465 | -1,76 | ||||
| 2026-02-11 | 13F | CSM Advisors, LLC | 47.148 | 5,25 | 6 | 0,00 | ||||
| 2026-04-24 | 13F | Deltec Asset Management Llc | 27.925 | -26,32 | 3.173 | -30,61 | ||||
| 2026-04-21 | 13F | Quad-Cities Investment Group, LLC | 8.350 | 4,14 | 949 | -1,96 | ||||
| 2026-02-17 | 13F | PenderFund Capital Management Ltd. | 2.048 | 0,00 | 247 | 1,65 | ||||
| 2026-02-11 | 13F | Letko, Brosseau & Associates Inc | 195.203 | 3,97 | 23.543 | 5,54 | ||||
| 2026-02-17 | 13F | Engineers Gate Manager LP | 14.604 | 65,11 | 1.761 | 67,71 | ||||
| 2025-11-07 | 13F | Sierra Ocean, Llc | 0 | -100,00 | 0 | |||||
| 2026-02-13 | 13F | Cullen Capital Management, LLC | 163.557 | -21,89 | 19.727 | -20,72 | ||||
| 2026-02-13 | 13F | Parkside Financial Bank & Trust | 100 | 0,00 | 12 | 9,09 | ||||
| 2026-02-13 | 13F | Vontobel Holding Ltd. | 484.852 | -1,16 | 58.478 | 0,33 | ||||
| 2026-04-07 | 13F | Carolina Wealth Advisors, LLC | 1.929 | 219 | ||||||
| 2026-02-17 | 13F | Signature Equity Partners, LLC | 71 | 9 | ||||||
| 2025-11-07 | 13F | Synovus Financial Corp | 1.736 | 206 | ||||||
| 2026-02-17 | 13F | Bank Of America Corp /de/ | 124.830 | -37,83 | 15.056 | -36,89 | ||||
| 2026-04-17 | 13F | Brown, Lisle/cummings, Inc. | 68 | 8 | ||||||
| 2026-01-27 | 13F | Genoa Capital Gestora de Recursos Ltda. | 0 | -100,00 | 0 | |||||
| 2026-02-13 | 13F | JustInvest LLC | 11.242 | -1,00 | 1.356 | 0,44 | ||||
| 2026-02-12 | 13F | Banco BTG Pactual S.A. | 10.090 | 185,03 | 1.217 | 189,52 | ||||
| 2026-04-13 | 13F | True Wealth Design, LLC | 71 | 102,86 | 8 | 100,00 | ||||
| 2026-01-20 | 13F | Harbor Capital Advisors, Inc. | 9.178 | 23,06 | 1 | |||||
| 2026-02-17 | 13F | Wiley Bros.-aintree Capital, Llc | 4.594 | 555 | ||||||
| 2026-02-12 | 13F | Resurgent Financial Advisors LLC | 2.000 | 241 | ||||||
| 2026-04-07 | 13F | Signaturefd, Llc | 207 | 107,00 | 24 | 91,67 | ||||
| 2026-02-10 | 13F | State of Wyoming | 1.750 | -53,70 | 211 | -53,01 | ||||
| 2026-04-07 | 13F | Eastern Bank | 426 | 0,00 | 48 | -5,88 | ||||
| 2026-02-13 | 13F | Kayne Anderson Rudnick Investment Management Llc | 6 | 0,00 | 1 | |||||
| 2026-02-09 | 13F | Hantz Financial Services, Inc. | 4 | 0 | ||||||
| 2026-02-13 | 13F | Bridgewater Associates, LP | 43.601 | -31,54 | 5.259 | -30,50 | ||||
| 2026-02-13 | 13F | Squarepoint Ops LLC | 4.544 | 75,31 | 548 | 78,50 | ||||
| 2025-11-13 | 13F | Quadrature Capital Ltd | 0 | -100,00 | 0 | |||||
| 2026-02-17 | 13F | Citadel Advisors Llc | Call | 56.600 | -27,06 | 6.827 | -25,97 | |||
| 2026-04-13 | 13F | Artemis Investment Management LLP | 620.198 | 37,29 | 70.461 | 29,32 | ||||
| 2026-01-29 | 13F | UBS Group AG | 67.684 | -13,36 | 8.163 | -12,06 | ||||
| 2026-02-06 | 13F | Bare Financial Services, Inc | 0 | -100,00 | 0 | |||||
| 2026-02-17 | 13F | Citadel Advisors Llc | Put | 65.300 | -26,38 | 7.876 | -25,28 | |||
| 2026-02-17 | 13F | Sig Brokerage, Lp | 0 | -100,00 | 0 | |||||
| 2026-02-17 | 13F | Aqr Capital Management Llc | 2.499 | 302 | ||||||
| 2026-02-17 | 13F | Citadel Advisors Llc | 25.120 | 586,53 | 3.030 | 597,93 | ||||
| 2026-01-30 | 13F | Carrera Capital Advisors | 35.591 | -3,07 | 4.293 | -1,63 | ||||
| 2026-02-17 | 13F | Susquehanna International Group, Llp | 16.230 | 1.958 | ||||||
| 2026-02-12 | 13F | Steward Partners Investment Advisory, Llc | 1.813 | 0,11 | 219 | 1,40 | ||||
| 2026-02-05 | 13F | Bessemer Group Inc | 128 | 0,00 | 0 | |||||
| 2026-02-17 | 13F | D. E. Shaw & Co., Inc. | Call | 11.800 | 257,58 | 1.423 | 263,01 | |||
| 2026-02-17 | 13F | Susquehanna International Group, Llp | Put | 175.000 | -8,52 | 21.107 | -7,14 | |||
| 2026-02-17 | 13F | Susquehanna International Group, Llp | Call | 38.500 | -51,88 | 4.643 | -51,15 | |||
| 2025-11-14 | 13F | Nomura Holdings Inc | 0 | -100,00 | 0 | |||||
| 2026-02-11 | 13F | Brandywine Global Investment Management, LLC | 137.970 | 1,54 | 16.641 | 3,07 | ||||
| 2026-02-18 | 13F | GWM Advisors LLC | 0 | -100,00 | 0 | |||||
| 2026-03-12 | 13F/A | Peak6 Llc | Put | 19.700 | 2.376 | |||||
| 2026-04-20 | 13F | Jfs Wealth Advisors, Llc | 42 | 7,69 | 5 | 0,00 | ||||
| 2026-02-02 | 13F | Hussman Strategic Advisors, Inc. | 10.500 | 1.266 | ||||||
| 2026-02-06 | 13F | EverSource Wealth Advisors, LLC | 1.678 | -0,47 | 202 | 1,00 | ||||
| 2026-02-11 | 13F | Fca Corp /tx | 3.000 | 0,00 | 362 | 1,40 | ||||
| 2026-03-12 | 13F/A | Peak6 Llc | 5.249 | 633 | ||||||
| 2026-02-11 | 13F | Fox Run Management, L.l.c. | 3.478 | -45,16 | 419 | -44,36 | ||||
| 2026-02-17 | 13F/A | Uniplan Investment Counsel, Inc. | 15.062 | -4,47 | 1.817 | -3,04 | ||||
| 2026-02-17 | 13F | Clark Capital Management Group, Inc. | 551.280 | 0,09 | 66.490 | 1,59 | ||||
| 2025-11-14 | 13F | Quarry LP | 0 | -100,00 | 0 | -100,00 | ||||
| 2026-04-20 | 13F | Hilton Head Capital Partners, LLC | 324 | 44,00 | 37 | 33,33 | ||||
| 2026-02-23 | 13F | Virtu Financial LLC | 3.461 | 0 |