Grundlæggende statistik
| Institutionelle ejere | 362 total, 340 long only, 1 short only, 21 long/short - change of -13,60% MRQ |
| Del pris | 33,25 |
| Gennemsnitlig porteføljeallokering | 0.0900 % - change of -42,30% MRQ |
| Institutionelle aktier (lange) | 96.859.485 (ex 13D/G) - change of -7,56MM shares -7,24% MRQ |
| Institutionel værdi (lang) | $ 2.144.271 USD ($1000) |
Institutionelt ejerskab og aktionærer
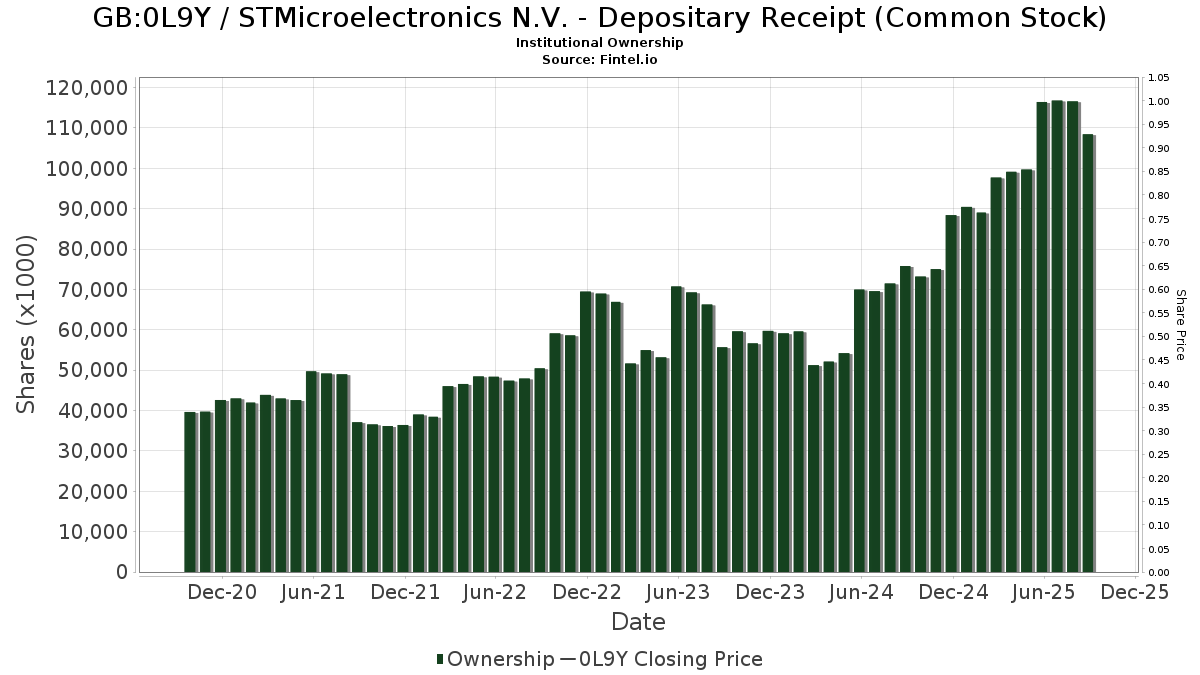
STMicroelectronics N.V. - Depositary Receipt (Common Stock) (GB:0L9Y) har 362 institutionelle ejere og aktionærer, der har indsendt 13D/G- eller 13F-formularer til Securities Exchange Commission (SEC). Disse institutioner har i alt 96,859,485 aktier. Største aktionærer omfatter Van Eck Associates Corp, BlackRock, Inc., Morgan Stanley, Slate Path Capital LP, Invesco Ltd., Goldman Sachs Group Inc, Two Sigma Investments, Lp, Jpmorgan Chase & Co, FIL Ltd, and Dimensional Fund Advisors Lp .
STMicroelectronics N.V. - Depositary Receipt (Common Stock) (LSE:0L9Y) institutionel ejerskabsstruktur viser aktuelle positioner i virksomheden efter institutioner og fonde, samt seneste ændringer i positionsstørrelse. Større aktionærer kan omfatte individuelle investorer, investeringsforeninger, hedgefonde eller institutioner. Skema 13D angiver, at investoren besidder (eller besidder) mere end 5 % af virksomheden og har til hensigt (eller har til hensigt at) aktivt at forfølge en ændring i forretningsstrategi. Skema 13G indikerer en passiv investering på over 5%.
The share price as of March 12, 2026 is 33,25 / share. Previously, on March 19, 2025, the share price was 25,36 / share. This represents an increase of 31,10% over that period.
Fondens stemningsscore
Fund Sentiment Score (fka Ownership Accumulation Score) finder de aktier, der bliver mest købt af fonde. Det er resultatet af en sofistikeret, multi-faktor kvantitativ model, der identificerer virksomheder med de højeste niveauer af institutionel akkumulering. Scoringsmodellen bruger en kombination af den samlede stigning i oplyste ejere, ændringerne i porteføljeallokeringer i disse ejere og andre målinger. Tallet går fra 0 til 100, hvor højere tal indikerer et højere niveau af akkumulering for sine jævnaldrende, og 50 er gennemsnittet.
Opdateringsfrekvens: Dagligt
Se Ownership Explorer, som giver en liste over højest rangerende virksomheder.
AI+ Ask Fintel’s AI assistant about STMicroelectronics N.V. - Depositary Receipt (Common Stock).
Select a question to share a public post with an AI-crafted answer.
Thinking of good questions…
13F og NPORT arkivering
Detaljer om 13F-arkivering er gratis. Detaljer om NP-ansøgninger kræver et premium-medlemskab. Grønne rækker angiver nye positioner. Røde rækker angiver lukkede positioner. Klik på linket ikon for at se den fulde transaktionshistorik.
Opgrader
for at låse premium-data op og eksportere til Excel ![]() .
.
| Fil dato | Kilde | Investor | Type | Gennemsnitlig pris (Øst) |
Aktier | Δ Aktier (%) |
Rapporteret Værdi ($1000) |
Δ Værdi (%) |
Port Alloc (%) |
|
|---|---|---|---|---|---|---|---|---|---|---|
| 2026-02-13 | 13F | Squarepoint Ops LLC | 0 | -100,00 | 0 | -100,00 | ||||
| 2025-11-14 | 13F | Balyasny Asset Management Llc | 0 | -100,00 | 0 | -100,00 | ||||
| 2025-09-25 | NP | Dfa Investment Dimensions Group Inc - Va International Value Portfolio This fund is a listed as child fund of Dimensional Fund Advisors Lp and if that institution has disclosed ownership in this security, then these positions will not be double counted when calculating total shares and total value | 4.911 | 0,00 | 125 | 11,71 | ||||
| 2026-02-12 | 13F | Brinker Capital Investments, LLC | 9.845 | -31,64 | 255 | -37,19 | ||||
| 2026-02-17 | 13F | Balyasny Asset Management Llc | Call | 0 | -100,00 | 0 | -100,00 | |||
| 2026-02-02 | 13F | Montag A & Associates Inc | 593 | 19,08 | 15 | 7,14 | ||||
| 2026-02-17 | 13F | D. E. Shaw & Co., Inc. | Call | 289.300 | 553,05 | 7.504 | 499,84 | |||
| 2025-11-14 | 13F | Wexford Capital Lp | 0 | -100,00 | 0 | -100,00 | ||||
| 2026-02-09 | 13F | William Blair Investment Management, Llc | 0 | -100,00 | 0 | -100,00 | ||||
| 2026-02-17 | 13F | D. E. Shaw & Co., Inc. | Put | 269.700 | 37,25 | 6.996 | 25,99 | |||
| 2026-01-22 | 13F | Maseco Llp | 478 | 12 | ||||||
| 2026-02-13 | 13F | Headlands Technologies LLC | 63.491 | 1.647 | ||||||
| 2026-01-21 | 13F | Sowell Financial Services LLC | 7.834 | 203 | ||||||
| 2026-02-05 | 13F | Allworth Financial LP | 4.929 | 2,33 | 128 | -6,62 | ||||
| 2025-09-24 | NP | RVRB - Reverb ETF | 75 | 0,00 | 2 | 0,00 | ||||
| 2026-02-17 | 13F | Point72 Asset Management, L.P. | Call | 16.800 | 436 | |||||
| 2026-02-17 | 13F | Point72 Asset Management, L.P. | Put | 62.500 | 1.621 | |||||
| 2026-02-17 | 13F | RMB Capital Management, LLC | 115.268 | 119,43 | 2.990 | 101,48 | ||||
| 2026-02-02 | 13F | Ping Capital Management, Inc. | 17.000 | 70,00 | 441 | 56,03 | ||||
| 2026-01-22 | 13F | Harwood Advisory Group, LLC | 652 | 0,31 | 17 | -11,11 | ||||
| 2026-02-09 | 13F | Legal & General Group Plc | 5.578 | 42,08 | 145 | 30,91 | ||||
| 2026-01-29 | 13F | Kestra Private Wealth Services, Llc | 0 | -100,00 | 0 | |||||
| 2026-01-30 | 13F | American Capital Advisory, LLC | 11 | 22,22 | 0 | |||||
| 2026-01-21 | 13F | Modera Wealth Management, LLC | 155.790 | -0,43 | 4.041 | -8,60 | ||||
| 2026-02-11 | 13F | Capital Analysts, Inc. | 91 | -63,75 | 0 | |||||
| 2026-02-06 | 13F | Creative Financial Designs Inc /adv | 16 | -70,91 | 0 | -100,00 | ||||
| 2026-02-13 | 13F | Mariner, LLC | 66.553 | -8,40 | 1.727 | -15,93 | ||||
| 2026-02-09 | 13F | Nia Impact Advisors, Llc | 12.145 | 0,00 | 315 | -8,16 | ||||
| 2026-02-13 | 13F | Sofos Investments, Inc. | 500 | 13 | ||||||
| 2026-02-13 | 13F | Charles Schwab Investment Management Inc | 80.667 | -9,31 | 2.093 | -16,75 | ||||
| 2026-02-17 | 13F | Two Sigma Investments, Lp | 3.602.842 | 55,13 | 93.458 | 42,39 | ||||
| 2026-02-17 | 13F | Laird Norton Trust Company, Llc | 37.820 | 981 | ||||||
| 2026-02-04 | 13F | Atlantic Union Bankshares Corp | 383 | 10 | ||||||
| 2026-01-21 | 13F | Sound Income Strategies, LLC | 250 | 252,11 | 7 | 200,00 | ||||
| 2025-11-14 | 13F | LMR Partners LLP | 0 | -100,00 | 0 | -100,00 | ||||
| 2026-02-12 | 13F | Quadrant Capital Group Llc | 23.370 | -9,10 | 606 | -16,53 | ||||
| 2025-11-13 | 13F | Capital Research Global Investors | 0 | -100,00 | 0 | |||||
| 2026-02-18 | 13F | Vident Advisory, LLC | 18.048 | -22,19 | 468 | -28,55 | ||||
| 2026-02-09 | 13F | 44 Wealth Management Llc | 0 | -100,00 | 0 | |||||
| 2026-02-02 | 13F | Chung Wu Investment Group, LLC | 200 | 0,00 | 5 | 0,00 | ||||
| 2026-02-11 | 13F | O'shaughnessy Asset Management, Llc | 21.589 | -23,30 | 560 | -29,56 | ||||
| 2026-01-27 | 13F | Forum Financial Management, LP | 23.785 | 0,00 | 617 | -8,33 | ||||
| 2026-01-22 | 13F | Pinnacle Bancorp, Inc. | 605 | 24,74 | 16 | 15,38 | ||||
| 2026-02-13 | 13F | Arrowstreet Capital, Limited Partnership | 1.397.239 | -46,37 | 36.244 | -50,78 | ||||
| 2026-02-17 | 13F | Optiver Holding B.V. | 0 | -100,00 | 0 | -100,00 | ||||
| 2026-01-09 | 13F | Diversified Trust Co | 0 | -100,00 | 0 | |||||
| 2026-01-23 | 13F | Robeco Institutional Asset Management B.V. | 0 | -100,00 | 0 | -100,00 | ||||
| 2026-02-11 | 13F | Dorsey & Whitney Trust CO LLC | 11.925 | -14,78 | 309 | -21,77 | ||||
| 2026-02-17 | 13F | Advisory Services Network, LLC | 0 | -100,00 | 0 | |||||
| 2026-02-13 | 13F | Van Eck Associates Corp | 10.532.428 | 12,20 | 273 | 3,02 | ||||
| 2026-02-17 | 13F | CWM Advisors, LLC | 9.773 | 18,30 | 254 | 8,58 | ||||
| 2026-02-12 | 13F | SWAN Capital LLC | 33 | 17,86 | 1 | |||||
| 2026-02-13 | 13F | Kestra Advisory Services, LLC | 0 | -100,00 | 0 | |||||
| 2026-02-17 | 13F | XTX Topco Ltd | 17.035 | 442 | ||||||
| 2026-02-13 | 13F | First Trust Advisors Lp | 132.751 | -32,93 | 3.444 | -38,44 | ||||
| 2026-02-03 | 13F | Denali Advisors Llc | 8.687 | -3,27 | 225 | -11,07 | ||||
| 2026-02-03 | 13F | Gallacher Capital Management LLC | 11.231 | -33,66 | 291 | -39,12 | ||||
| 2026-02-13 | 13F | Mml Investors Services, Llc | 18.472 | -3,70 | 479 | -11,62 | ||||
| 2026-02-23 | 13F | Mv Capital Management, Inc. | 7 | 0 | ||||||
| 2025-09-29 | NP | SOXL - Direxion Daily Semiconductor Bull 3X Shares | 2.845.462 | 17,07 | 72.360 | 31,09 | ||||
| 2025-11-14 | 13F | Verition Fund Management LLC | 0 | -100,00 | 0 | |||||
| 2025-11-14 | 13F | XY Capital Ltd | 0 | -100,00 | 0 | -100,00 | ||||
| 2025-11-14 | 13F | Cinctive Capital Management LP | 0 | -100,00 | 0 | -100,00 | ||||
| 2025-10-30 | 13F | Ridgewood Investments LLC | 23.625 | 101,06 | 597 | 66,95 | ||||
| 2026-01-27 | 13F | Checchi Capital Advisers, LLC | 0 | -100,00 | 0 | |||||
| 2026-02-11 | 13F | Franklin Resources Inc | 9.056 | -7,19 | 235 | -14,91 | ||||
| 2026-01-13 | 13F | CoreCap Advisors, LLC | 296 | 35,16 | 8 | 16,67 | ||||
| 2026-02-12 | 13F | DRW Securities, LLC | 26.960 | 699 | ||||||
| 2026-01-28 | 13F | Geneos Wealth Management Inc. | 0 | -100,00 | 0 | |||||
| 2026-02-13 | 13F | Inspire Advisors, LLC | 19.933 | 9,50 | 517 | 0,58 | ||||
| 2026-02-02 | 13F | Principal Financial Group Inc | 0 | -100,00 | 0 | -100,00 | ||||
| 2025-09-25 | NP | DFIEX - International Core Equity Portfolio - Institutional Class This fund is a listed as child fund of Dimensional Fund Advisors Lp and if that institution has disclosed ownership in this security, then these positions will not be double counted when calculating total shares and total value | 138.844 | -69,24 | 3.531 | -65,56 | ||||
| 2025-10-28 | 13F | CarsonAllaria Wealth Management, Ltd. | 0 | -100,00 | 0 | |||||
| 2026-02-17 | 13F | FIL Ltd | 3.107.386 | 4,95 | 80.606 | -3,66 | ||||
| 2025-09-26 | NP | TDVI - FT Vest Technology Dividend Target Income ETF | 2.646 | 55,65 | 67 | 76,32 | ||||
| 2026-02-13 | 13F | Motiv8 Investments LLC | 100 | 0 | ||||||
| 2026-01-30 | 13F | Caldwell Trust Co | 3.000 | -6,25 | 78 | -14,44 | ||||
| 2026-01-20 | 13F | AdvisorNet Financial, Inc | 96 | 0,00 | 2 | 0,00 | ||||
| 2026-02-11 | 13F | Manchester Capital Management LLC | 345 | 9 | ||||||
| 2025-11-14 | 13F | Junto Capital Management LP | 0 | -100,00 | 0 | -100,00 | ||||
| 2026-01-16 | 13F | Crewe Advisors LLC | 688 | 0,00 | 18 | -10,53 | ||||
| 2026-02-05 | 13F | Cambridge Investment Research Advisors, Inc. | 21.448 | -8,04 | 1 | |||||
| 2026-02-17 | 13F | Aqr Capital Management Llc | 61.590 | -63,88 | 1.598 | -66,85 | ||||
| 2026-02-17 | 13F | Paloma Partners Management Co | 42.000 | 1.089 | ||||||
| 2026-02-09 | 13F | Key FInancial Inc | 95 | 0,00 | 2 | 0,00 | ||||
| 2026-03-03 | 13F/A | Caitong International Asset Management Co., Ltd | 9 | 0 | ||||||
| 2026-02-12 | 13F | Commonwealth Equity Services, Llc | 19.402 | 4,04 | 503 | |||||
| 2026-03-19 | 13F | Painted Porch Advisors LLC | 0 | -100,00 | 0 | |||||
| 2026-02-11 | 13F | Vise Technologies, Inc. | 11.816 | -39,27 | 307 | -44,26 | ||||
| 2026-01-27 | 13F | First Horizon Corp | 420 | 0,00 | 11 | -9,09 | ||||
| 2026-02-27 | 13F | Compass Financial Services Inc | 144 | -64,53 | 4 | -72,73 | ||||
| 2025-11-13 | 13F | Pinpoint Asset Management (Singapore) Pte. Ltd. | 0 | -100,00 | 0 | -100,00 | ||||
| 2025-10-24 | 13F | Hemington Wealth Management | 18 | 0 | ||||||
| 2025-11-14 | 13F | WealthTrust Axiom LLC | 0 | -100,00 | 0 | |||||
| 2026-01-15 | 13F | Nisa Investment Advisors, Llc | 94 | 2 | ||||||
| 2026-02-17 | 13F | Silvercrest Asset Management Group Llc | 23.900 | 0,00 | 620 | -8,30 | ||||
| 2026-02-13 | 13F | Umb Bank N A/mo | 1.257 | 7,90 | 33 | 0,00 | ||||
| 2025-10-09 | 13F | Voya Investment Management Llc | 0 | -100,00 | 0 | -100,00 | ||||
| 2026-01-12 | 13F | Legacy Wealth Asset Management, LLC | 18.648 | 0,80 | 484 | -7,47 | ||||
| 2026-01-09 | 13F | SG Americas Securities, LLC | 45.361 | 9,11 | 1 | 0,00 | ||||
| 2026-02-11 | 13F | Zions Bancorporation, National Association /ut/ | 315 | 0,00 | 8 | 0,00 | ||||
| 2026-02-13 | 13F | Maven Securities LTD | 0 | -100,00 | 0 | -100,00 | ||||
| 2026-01-21 | 13F | Avantra Family Wealth, Inc. | 11.606 | -16,01 | 301 | -22,82 | ||||
| 2026-01-21 | 13F | Stone House Investment Management, LLC | 100 | 3 | ||||||
| 2026-01-28 | 13F | CAPROCK Group, Inc. | 10.517 | 9,88 | 273 | 5,43 | ||||
| 2026-02-13 | 13F | Maven Securities LTD | Put | 0 | -100,00 | 0 | -100,00 | |||
| 2026-02-17 | 13F | Tower Research Capital LLC (TRC) | 35.951 | -89,59 | 933 | -90,45 | ||||
| 2026-02-12 | 13F | Wealthspire Advisors, LLC | 0 | -100,00 | 0 | |||||
| 2026-02-17 | 13F | Mercer Global Advisors Inc /adv | 30.304 | -12,58 | 786 | -19,71 | ||||
| 2026-01-20 | 13F | Whalen Wealth Management Inc. | 18.337 | 476 | ||||||
| 2026-02-17 | 13F | Bayesian Capital Management, LP | 9.619 | 250 | ||||||
| 2026-02-11 | 13F | TCTC Holdings, LLC | 1.500 | 0,00 | 39 | -9,52 | ||||
| 2026-02-12 | 13F | Jane Street Group, Llc | 0 | -100,00 | 0 | -100,00 | ||||
| 2026-02-11 | 13F | Janney Montgomery Scott LLC | 0 | -100,00 | 0 | |||||
| 2026-02-13 | 13F | JustInvest LLC | 42.406 | -17,34 | 1.100 | -24,09 | ||||
| 2026-02-05 | 13F | AlphaCore Capital LLC | 9.437 | -18,40 | 245 | -25,15 | ||||
| 2026-02-17 | 13F | Freestone Grove Partners LP | 0 | -100,00 | 0 | -100,00 | ||||
| 2026-02-17 | 13F | LMR Partners LLP | Call | 114.800 | 2.978 | |||||
| 2026-02-17 | 13F | Citadel Advisors Llc | Put | 779.100 | 61,20 | 20.210 | 47,96 | |||
| 2025-11-14 | 13F | Atom Investors LP | 0 | -100,00 | 0 | -100,00 | ||||
| 2026-02-17 | 13F | Citadel Advisors Llc | 1.495.711 | 45,02 | 38.799 | 33,11 | ||||
| 2026-02-17 | 13F | Guggenheim Capital Llc | 50.018 | -25,64 | 1.297 | -31,77 | ||||
| 2026-02-17 | 13F | Citadel Advisors Llc | Call | 202.000 | -7,21 | 5.240 | -14,84 | |||
| 2026-01-23 | 13F | Assetmark, Inc | 6.482 | -86,98 | 168 | -88,06 | ||||
| 2026-02-10 | 13F | Root Financial Partners, LLC | 24 | 9,09 | 1 | |||||
| 2026-02-13 | 13F | Brian Low Financial Group, Llc | 32.294 | 838 | ||||||
| 2026-02-02 | 13F | Oppenheimer Asset Management Inc. | 27.578 | 5,16 | 715 | -3,51 | ||||
| 2026-02-17 | 13F | Slate Path Capital LP | 5.280.500 | 136.976 | ||||||
| 2025-11-14 | 13F | Albar Capital Partners LLP | 0 | -100,00 | 0 | |||||
| 2026-02-12 | 13F | Colonial Trust Co / SC | 0 | -100,00 | 0 | -100,00 | ||||
| 2025-10-28 | 13F | Arlington Trust Co LLC | 0 | -100,00 | 0 | -100,00 | ||||
| 2026-02-17 | 13F | Defiance ETFs, LLC | 1.517.463 | 39.545 | ||||||
| 2025-09-25 | NP | DFIC - Dimensional International Core Equity 2 ETF | 91.108 | 2,32 | 2.317 | 14,54 | ||||
| 2025-09-25 | NP | DFAI - Dimensional International Core Equity Market ETF | 141.229 | 0,81 | 3.591 | 12,89 | ||||
| 2026-02-17 | 13F | Voleon Capital Management Lp | 241.088 | 23,14 | 6.254 | 13,03 | ||||
| 2026-02-17 | 13F | Millennium Management Llc | Call | 384.000 | 16,89 | 9.961 | 7,29 | |||
| 2026-02-17 | 13F | Millennium Management Llc | Put | 734.600 | 13,43 | 19.056 | 4,12 | |||
| 2026-02-17 | 13F | Millennium Management Llc | 724.862 | -62,50 | 18.803 | -65,58 | ||||
| 2026-02-03 | 13F | Morse Asset Management, Inc | 0 | -100,00 | 0 | |||||
| 2026-01-21 | 13F | Crews Bank & Trust | 2.800 | 0,00 | 73 | -8,86 | ||||
| 2026-01-27 | 13F | Aspiring Ventures, LLC | Call | 0 | -100,00 | 0 | ||||
| 2026-02-10 | 13F | Bruce G. Allen Investments, LLC | 0 | -100,00 | 0 | -100,00 | ||||
| 2026-02-10 | 13F | Bnp Paribas Arbitrage, Sa | Put | 3.640 | 9.442 | |||||
| 2026-02-10 | 13F | Bnp Paribas Arbitrage, Sa | Call | 456 | 1.183 | |||||
| 2026-02-03 | 13F | Maxi Investments CY Ltd | 90.000 | 2 | ||||||
| 2026-02-03 | 13F | Cheviot Value Management, LLC | 200 | 0,00 | 6 | 20,00 | ||||
| 2025-09-26 | NP | CVAR - Cultivar ETF | 6.653 | 0,79 | 169 | 13,42 | ||||
| 2026-01-14 | 13F | Jfs Wealth Advisors, Llc | 79 | -41,48 | 2 | -33,33 | ||||
| 2025-11-14 | 13F | Wetherby Asset Management Inc | 33.414 | 9,58 | 944 | 1,83 | ||||
| 2026-02-06 | 13F | Bare Financial Services, Inc | 138 | -19,30 | 4 | -25,00 | ||||
| 2025-10-28 | 13F | Campbell & CO Investment Adviser LLC | 0 | -100,00 | 0 | -100,00 | ||||
| 2026-02-09 | 13F | Harbour Investments, Inc. | 1.696 | -0,29 | 44 | -8,33 | ||||
| 2026-02-06 | 13F | IFP Advisors, Inc | 1.124 | -46,25 | 29 | -50,85 | ||||
| 2026-02-11 | 13F | Deutsche Bank Ag\ | 124.816 | -6,74 | 3.238 | -14,41 | ||||
| 2026-02-10 | 13F | Envestnet Asset Management Inc | 124.016 | -51,09 | 3.217 | -55,12 | ||||
| 2026-01-22 | 13F | Financial Consulate, Inc | 52 | -62,59 | 1 | -66,67 | ||||
| 2026-02-03 | 13F | Ballentine Partners, LLC | 20.715 | -9,98 | 537 | -17,38 | ||||
| 2026-02-12 | 13F | CIBC Private Wealth Group, LLC | 1.000 | 3.746,15 | 26 | |||||
| 2026-01-23 | 13F | Altfest L J & Co Inc | 21.005 | 545 | ||||||
| 2026-02-17 | 13F | Royal Bank Of Canada | 371.603 | -64,32 | 9.640 | -67,25 | ||||
| 2026-02-12 | 13F | Brown Brothers Harriman & Co | 2.680 | 350,42 | 70 | 331,25 | ||||
| 2026-03-12 | 13F/A | Peak6 Llc | Put | 212.100 | -49,19 | 5.502 | -53,36 | |||
| 2026-03-12 | 13F/A | Peak6 Llc | Call | 469.300 | -23,52 | 12.174 | -29,80 | |||
| 2026-03-12 | 13F/A | Peak6 Llc | 174.447 | -26,45 | 4.525 | -32,48 | ||||
| 2026-02-04 | 13F | Naples Global Advisors, Llc | 24.200 | -5,59 | 628 | -13,40 | ||||
| 2026-02-13 | 13F | Candriam Luxembourg S.C.A. | 76.811 | -32,34 | 1.993 | -37,91 | ||||
| 2025-11-07 | 13F/A | Abn Amro Investment Solutions | 43.061 | 34,41 | 1.859 | 16,05 | ||||
| 2026-02-17 | 13F | United Capital Financial Advisers, Llc | 0 | -100,00 | 0 | |||||
| 2026-02-13 | 13F | National Bank Of Canada /fi/ | 549 | 28,27 | 14 | 16,67 | ||||
| 2026-02-13 | 13F | Transamerica Financial Advisors, Inc. | 3 | -70,00 | 0 | |||||
| 2025-11-14 | 13F | Point72 Italy, S.r.l. | 0 | -100,00 | 0 | -100,00 | ||||
| 2026-02-12 | 13F | Bank Of Montreal /can/ | 36.855 | 33,36 | 956 | 22,56 | ||||
| 2025-11-10 | 13F | Clear Creek Financial Management, LLC | 0 | -100,00 | 0 | |||||
| 2025-11-14 | 13F | Holocene Advisors, LP | 0 | -100,00 | 0 | |||||
| 2026-01-30 | 13F | United Community Bank | 100 | 3 | ||||||
| 2025-10-20 | 13F | Hennessy Advisors Inc | 0 | -100,00 | 0 | |||||
| 2025-11-14 | 13F | Warren Averett Asset Management, LLC | 0 | -100,00 | 0 | |||||
| 2025-11-14 | 13F | Truvestments Capital Llc | 0 | -100,00 | 0 | |||||
| 2026-01-26 | 13F | PFG Investments, LLC | 9.462 | 245 | ||||||
| 2025-11-14 | 13F | ICONIQ Capital, LLC | 0 | -100,00 | 0 | |||||
| 2025-11-14 | 13F | Point72 Asia (Singapore) Pte. Ltd. | 4.944 | 140 | ||||||
| 2026-02-06 | 13F | Global Retirement Partners, LLC | 5.447 | 2.570,10 | 141 | 2.720,00 | ||||
| 2026-02-10 | 13F | Bnp Paribas Arbitrage, Sa | 1.699.806 | -22,92 | 44.093 | -29,25 | ||||
| 2026-02-10 | 13F | Acadian Asset Management Llc | 774.893 | -66,33 | 20 | -69,23 | ||||
| 2026-01-16 | 13F | First Pacific Financial | 0 | -100,00 | 0 | |||||
| 2026-02-11 | 13F | Cerity Partners LLC | 79.647 | 15,73 | 2.066 | 6,28 | ||||
| 2025-11-13 | 13F | Goodman Advisory Group, LLC | 0 | -100,00 | 0 | -100,00 | ||||
| 2026-02-14 | 13F | Rockefeller Capital Management L.P. | 33.864 | 6,60 | 878 | -2,12 | ||||
| 2026-01-12 | 13F | Abound Wealth Management | 1.006 | 26 | ||||||
| 2026-01-14 | 13F | Spire Wealth Management | 209 | -45,43 | 5 | -50,00 | ||||
| 2025-11-14 | 13F | ExodusPoint Capital Management, LP | Call | 0 | -100,00 | 0 | ||||
| 2025-11-04 | 13F | Transcend Wealth Collective, Llc | 0 | -100,00 | 0 | -100,00 | ||||
| 2026-02-17 | 13F | SageView Advisory Group, LLC | 5 | 0 | ||||||
| 2025-11-10 | 13F | Raiffeisen Bank International AG | 0 | -100,00 | 0 | -100,00 | ||||
| 2026-02-13 | 13F | State Street Corp | 135.146 | -25,06 | 3.506 | -31,22 | ||||
| 2025-10-20 | 13F | Mid-American Wealth Advisory Group, Inc. | 0 | -100,00 | 0 | -100,00 | ||||
| 2025-09-25 | NP | DFALX - Large Cap International Portfolio - Institutional Class This fund is a listed as child fund of Dimensional Fund Advisors Lp and if that institution has disclosed ownership in this security, then these positions will not be double counted when calculating total shares and total value | 187.899 | 0,00 | 4.778 | 11,98 | ||||
| 2026-01-27 | 13F | WealthCollab, LLC | 567 | -40,57 | 15 | -46,15 | ||||
| 2026-02-13 | 13F | Rafferty Asset Management, LLC | 1.832.344 | 5,11 | 47.531 | -3,52 | ||||
| 2026-02-03 | 13F | We Are One Seven, LLC | 8.860 | 230 | ||||||
| 2025-10-31 | 13F | Whittier Trust Co | 0 | -100,00 | 0 | -100,00 | ||||
| 2026-02-03 | 13F | Ethic Inc. | 57.294 | -3,81 | 1.486 | -11,71 | ||||
| 2025-11-06 | 13F | Whipplewood Advisors, LLC | 0 | -100,00 | 0 | |||||
| 2025-12-09 | 13F/A | Tudor Investment Corp Et Al | 0 | -100,00 | 0 | -100,00 | ||||
| 2025-11-12 | 13F | Transce3nd, LLC | 0 | -100,00 | 0 | |||||
| 2026-02-13 | 13F | Smartleaf Asset Management LLC | 4.405 | 13,06 | 115 | 4,59 | ||||
| 2026-02-02 | 13F | Sawyer & Company, Inc | 345 | 0,00 | 9 | |||||
| 2026-01-14 | 13F | ORG Partners LLC | 25 | 1 | ||||||
| 2025-09-25 | NP | DXIV - Dimensional International Vector Equity ETF | 3.731 | 5,57 | 95 | 17,50 | ||||
| 2026-02-11 | 13F | Havemeyer Place LP | 7.815 | 203 | ||||||
| 2026-02-17 | 13F | Jump Financial, LLC | 73.870 | -43,09 | 1.916 | -47,76 | ||||
| 2026-02-17 | 13F | Fairscale Capital, LLC | 0 | -100,00 | 0 | |||||
| 2026-02-13 | 13F | Healthcare Of Ontario Pension Plan Trust Fund | 600.000 | 417,73 | 15.564 | 375,24 | ||||
| 2026-02-12 | 13F | Dimensional Fund Advisors Lp | 3.063.194 | 48,66 | 79.462 | 36,48 | ||||
| 2026-02-13 | 13F | Squarepoint Ops LLC | Call | 164.600 | 174,79 | 4.270 | 152,30 | |||
| 2026-02-04 | 13F | Marco Investment Management Llc | 17.200 | -3,37 | 446 | -11,33 | ||||
| 2026-02-02 | 13F | Qrg Capital Management, Inc. | 10.734 | 0,39 | 278 | -7,95 | ||||
| 2026-02-12 | 13F | Groupe la Francaise | 0 | -100,00 | 0 | -100,00 | ||||
| 2026-02-13 | 13F | Marshall Wace, Llp | 1.647.305 | 42.731 | ||||||
| 2025-11-14 | 13F | Bridgefront Capital, LLC | 0 | -100,00 | 0 | -100,00 | ||||
| 2026-02-11 | 13F | Brandes Investment Partners, Lp | 1.566.965 | 20,36 | 40.647 | 10,48 | ||||
| 2025-11-14 | 13F | Cubist Systematic Strategies, LLC | 310.629 | 8.778 | ||||||
| 2026-02-13 | 13F | SRS Capital Advisors, Inc. | 2.090 | -93,96 | 54 | -94,47 | ||||
| 2026-02-10 | 13F | Savant Capital, LLC | 0 | -100,00 | 0 | |||||
| 2025-11-14 | 13F | Cubist Systematic Strategies, LLC | Put | 29.600 | -67,65 | 836 | -69,95 | |||
| 2025-11-10 | 13F | Greenland Capital Management LP | 0 | -100,00 | 0 | -100,00 | ||||
| 2026-02-12 | 13F | Keynote Financial Services Llc | 17.404 | -1,24 | 451 | -9,44 | ||||
| 2026-02-13 | 13F | Parkside Financial Bank & Trust | 1.565 | -40,61 | 41 | -45,95 | ||||
| 2026-01-29 | 13F | Nbc Securities, Inc. | 26.028 | 14,83 | 675 | 5,47 | ||||
| 2026-02-17 | 13F | Jones Financial Companies Lllp | 29.879 | 5,15 | 775 | -2,52 | ||||
| 2026-01-27 | 13F | CenterStar Asset Management, LLC | Put | 23.100 | 599 | |||||
| 2026-02-12 | 13F | Jane Street Group, Llc | Put | 123.500 | 376,83 | 3.204 | 338,17 | |||
| 2026-02-12 | 13F | Jane Street Group, Llc | Call | 70.700 | 308,67 | 1.834 | 275,61 | |||
| 2026-02-09 | 13F | Hantz Financial Services, Inc. | 97.859 | -0,17 | 3 | 0,00 | ||||
| 2026-02-17 | 13F | Northern Trust Corp | 555.522 | -8,84 | 14.410 | -16,33 | ||||
| 2026-01-08 | 13F | Versant Capital Management, Inc | 9.098 | 21,68 | 236 | 11,85 | ||||
| 2026-02-17 | 13F | Cape Investment Advisory, Inc. | 80 | -41,18 | 2 | -33,33 | ||||
| 2026-02-09 | 13F | AIA Group Ltd | 0 | -100,00 | 0 | |||||
| 2026-02-17 | 13F | Brevan Howard Capital Management LP | 0 | -100,00 | 0 | -100,00 | ||||
| 2026-02-17 | 13F | Quantinno Capital Management LP | 213.584 | 33,68 | 5.540 | 22,70 | ||||
| 2026-02-04 | 13F | Ameritas Advisory Services, LLC | 0 | -100,00 | 0 | -100,00 | ||||
| 2026-02-11 | 13F | Fox Run Management, L.l.c. | 0 | -100,00 | 0 | |||||
| 2026-02-03 | 13F | SBI Securities Co., Ltd. | 9.572 | 8,56 | 248 | -0,40 | ||||
| 2026-02-13 | 13F | University Of Texas/texas Am Investment Managment Co | 0 | -100,00 | 0 | |||||
| 2026-02-17 | 13F | Voloridge Investment Management, Llc | 985.379 | 44,60 | 25.561 | 32,73 | ||||
| 2026-02-13 | 13F | American Century Companies Inc | 352.424 | -7,58 | 9.142 | -15,17 | ||||
| 2026-02-13 | 13F | Squarepoint Ops LLC | Put | 87.300 | 22,78 | 2.265 | 12,69 | |||
| 2026-02-13 | 13F | SYM FINANCIAL Corp | 0 | -100,00 | 0 | |||||
| 2026-01-12 | 13F | CVA Family Office, LLC | 6.782 | 0,00 | 176 | -8,38 | ||||
| 2026-02-13 | 13F | Toroso Investments, LLC | 10.858 | 26,07 | 282 | 15,64 | ||||
| 2026-02-13 | 13F | Analog Century Management LP | 0 | -100,00 | 0 | |||||
| 2026-02-17 | 13F | Capital Fund Management S.a. | Call | 196.900 | -9,01 | 5.108 | -16,48 | |||
| 2026-02-19 | 13F | CI Private Wealth, LLC | 62.401 | -3,25 | 1.619 | -11,20 | ||||
| 2025-11-14 | 13F | Point72 Hong Kong Ltd | 0 | -100,00 | 0 | |||||
| 2026-02-17 | 13F | Creative Planning | 194.664 | 2,56 | 5.050 | -5,85 | ||||
| 2026-02-17 | 13F | Capital Fund Management S.a. | Put | 215.700 | -34,79 | 5.595 | -40,15 | |||
| 2026-02-13 | 13F | Toroso Investments, LLC | Call | 3.600 | 93 | |||||
| 2026-03-04 | 13F | SHP Wealth Management | 36 | 1 | ||||||
| 2026-01-26 | 13F | Private Trust Co Na | 571 | 0,00 | 15 | -12,50 | ||||
| 2026-02-17 | 13F | Clear Street Markets Llc | 0 | -100,00 | 0 | -100,00 | ||||
| 2026-02-13 | 13F | Ubs Asset Management Americas Inc | 3.065 | 80 | ||||||
| 2026-03-06 | 13F | Hsbc Holdings Plc | 27.168 | 28,79 | 709 | 20,20 | ||||
| 2026-02-06 | 13F | Empirical Asset Management, LLC | 11.555 | -3,47 | 300 | -11,54 | ||||
| 2026-02-11 | 13F | Group One Trading, L.p. | Call | 266.500 | -14,06 | 6.913 | -21,11 | |||
| 2026-02-11 | 13F | Group One Trading, L.p. | Put | 224.000 | 18,02 | 5.811 | 8,33 | |||
| 2026-02-17 | 13F | Susquehanna International Group, Llp | 28.594 | -91,67 | 742 | -92,36 | ||||
| 2025-09-25 | NP | DFA INVESTMENT DIMENSIONS GROUP INC - International Social Core Equity Portfolio Institutional Class This fund is a listed as child fund of Dimensional Fund Advisors Lp and if that institution has disclosed ownership in this security, then these positions will not be double counted when calculating total shares and total value | 4.154 | -87,11 | 106 | -85,64 | ||||
| 2026-02-11 | 13F | Group One Trading, L.p. | 12.837 | 333 | ||||||
| 2026-02-17 | 13F | Susquehanna International Group, Llp | Put | 1.393.200 | 69,47 | 36.140 | 55,56 | |||
| 2026-02-11 | 13F | GW&K Investment Management, LLC | 92 | 0 | ||||||
| 2026-01-29 | 13F | IMC-Chicago, LLC | 54.123 | 20,91 | 1.404 | 11,00 | ||||
| 2026-01-29 | 13F | IMC-Chicago, LLC | Put | 202.300 | 12,26 | 5.248 | 3,04 | |||
| 2026-01-26 | 13F | Reyes Financial Architecture, Inc. | 100 | 3 | ||||||
| 2026-01-29 | 13F | IMC-Chicago, LLC | Call | 169.400 | 16,27 | 4.394 | 6,73 | |||
| 2026-02-13 | 13F | Kilter Group LLC | 13 | -38,10 | 0 | |||||
| 2026-02-17 | 13F | Susquehanna International Group, Llp | Call | 1.329.200 | 156,90 | 34.479 | 135,82 | |||
| 2025-11-10 | 13F | Nkcfo Llc | 0 | -100,00 | 0 | |||||
| 2026-01-30 | 13F | Us Bancorp \de\ | 24.922 | -57,37 | 646 | -60,90 | ||||
| 2025-10-23 | 13F | Kingswood Wealth Advisors, Llc | 0 | -100,00 | 0 | |||||
| 2026-01-29 | 13F | UMA Financial Services, Inc. | 455 | 12 | ||||||
| 2026-02-13 | 13F | Neuberger Berman Group LLC | 84.593 | -8,01 | 2.194 | -15,55 | ||||
| 2026-02-17 | 13F | Cetera Investment Advisers | 36.525 | -24,87 | 947 | -31,03 | ||||
| 2026-03-04 | 13F | Leonteq Securities AG | 0 | -100,00 | 0 | |||||
| 2026-02-05 | 13F | High Note Wealth, LLC | 500 | 0,00 | 13 | -14,29 | ||||
| 2026-02-19 | 13F | Invesco Ltd. | 5.199.951 | 29,87 | 134.887 | 19,21 | ||||
| 2026-01-23 | 13F | Ritholtz Wealth Management | 9.207 | -42,82 | 239 | -47,69 | ||||
| 2025-11-12 | 13F | Simplex Trading, Llc | 0 | -100,00 | 0 | |||||
| 2026-02-11 | 13F | Vermillion Wealth Management, Inc. | 195 | 0,00 | 5 | 0,00 | ||||
| 2026-02-24 | 13F | Bell Investment Advisors, Inc | 137 | -18,93 | 4 | -25,00 | ||||
| 2026-02-11 | 13F | BI Asset Management Fondsmaeglerselskab A/S | 0 | -100,00 | 0 | |||||
| 2026-01-13 | 13F | Stephens Consulting, LLC | 100 | 0,00 | 3 | 0,00 | ||||
| 2026-01-29 | 13F | Sanctuary Advisors, LLC | 0 | -100,00 | 0 | -100,00 | ||||
| 2026-01-07 | 13F | Aventura Private Wealth, LLC | 200 | 5 | ||||||
| 2025-11-12 | 13F | Ameriflex Group, Inc. | 0 | -100,00 | 0 | -100,00 | ||||
| 2026-02-13 | 13F | Atlas Capital Advisors Llc | 5.552 | 0,00 | 144 | -14,29 | ||||
| 2026-02-12 | 13F | Raiffeisen Bank International AG | Call | 500 | 0,00 | 10 | -30,77 | |||
| 2026-01-30 | 13F | Archer Investment Corp | 18 | 0,00 | 0 | |||||
| 2026-02-03 | 13F | Robeco Schweiz AG | 566.130 | -3,22 | 14.685 | -11,16 | ||||
| 2026-02-17 | 13F | Summit Partners Public Asset Management, Llc | Call | 0 | -100,00 | 0 | ||||
| 2026-01-26 | 13F | Cwm, Llc | 6.587 | -12,66 | 0 | |||||
| 2025-11-12 | 13F | Creekmur Asset Management LLC | 201 | 0,50 | 6 | -16,67 | ||||
| 2026-02-17 | 13F | Summit Partners Public Asset Management, Llc | 0 | -100,00 | 0 | |||||
| 2026-02-17 | 13F | Woodline Partners LP | 1.920.099 | 49.807 | ||||||
| 2026-02-10 | 13F | Godfrey Financial Associates, Inc. | 412 | 11 | ||||||
| 2026-01-13 | 13F | Mather Group, Llc. | 0 | -100,00 | 0 | |||||
| 2026-02-11 | 13F | Syon Capital Llc | 10.576 | 274 | ||||||
| 2025-11-12 | 13F | Cresset Asset Management, LLC | 0 | -100,00 | 0 | -100,00 | ||||
| 2026-02-04 | 13F | West Tower Group, LLC | 10.000 | 25,00 | 259 | 14,60 | ||||
| 2026-02-17 | 13F | SIH Partners, LLLP | 32.254 | 0,00 | 837 | -8,23 | ||||
| 2026-01-16 | 13F | FNY Investment Advisers, LLC | Call | 0 | -100,00 | 0 | ||||
| 2026-01-21 | 13F | Albion Financial Group /ut | 127 | 0,00 | 3 | 0,00 | ||||
| 2026-02-11 | 13F | Empowered Funds, LLC | 24.763 | 16,58 | 642 | 7,00 | ||||
| 2026-02-13 | 13F | Wells Fargo & Company/mn | 417.209 | -16,25 | 10.822 | -23,13 | ||||
| 2025-11-07 | 13F | Sierra Ocean, Llc | 0 | -100,00 | 0 | |||||
| 2026-02-06 | 13F | EverSource Wealth Advisors, LLC | 2.903 | -38,13 | 75 | -43,18 | ||||
| 2026-02-10 | 13F | Nomura Asset Management Co Ltd | 0 | 0 | ||||||
| 2026-02-17 | 13F | Toronto Dominion Bank | 203.246 | 5.272 | ||||||
| 2026-01-05 | 13F | Miller Global Investments, LLC | 24.022 | 623 | ||||||
| 2026-01-14 | 13F | Bond & Devick Financial Network, Inc. | 8.150 | 0,00 | 211 | -8,26 | ||||
| 2025-09-24 | NP | BlackRock ETF Trust - BlackRock Large Cap Value ETF This fund is a listed as child fund of BlackRock, Inc. and if that institution has disclosed ownership in this security, then these positions will not be double counted when calculating total shares and total value | 15.042 | 383 | ||||||
| 2026-02-02 | 13F | Fifth Third Bancorp | 285 | 5,95 | 7 | 0,00 | ||||
| 2026-02-05 | 13F | Td Private Client Wealth Llc | 30 | -99,84 | 1 | -100,00 | ||||
| 2026-02-17 | 13F | Point72 Asset Management, L.P. | 0 | -100,00 | 0 | |||||
| 2026-01-21 | 13F | Azzad Asset Management Inc /adv | 142.104 | 0,80 | 3.686 | -7,46 | ||||
| 2026-02-03 | 13F | Crossmark Global Holdings, Inc. | 66.679 | -3,72 | 1.730 | -11,65 | ||||
| 2025-09-25 | NP | DFIV - Dimensional International Value ETF | 342.728 | -16,73 | 8.716 | -6,76 | ||||
| 2026-02-02 | 13F | Cornerstone Planning Group LLC | 21 | -95,63 | 1 | -100,00 | ||||
| 2026-01-20 | 13F | Princeton Global Asset Management LLC | 550 | 0,00 | 14 | -6,67 | ||||
| 2026-02-17 | 13F | Nomura Holdings Inc | Call | 150.000 | 3.891 | |||||
| 2026-02-02 | 13F | Highland Capital Management, Llc | 51.360 | -11,04 | 1.332 | -18,33 | ||||
| 2026-01-15 | 13F | Highline Wealth Partners Llc | 0 | -100,00 | 0 | |||||
| 2026-01-23 | 13F | Eagle Strategies LLC | 9.225 | -9,80 | 239 | -17,30 | ||||
| 2026-02-17 | 13F | Public Employees Retirement System Of Ohio | 0 | -100,00 | 0 | |||||
| 2025-11-14 | 13F | Binnacle Investments Inc | 180 | 17,65 | 5 | 25,00 | ||||
| 2026-02-04 | 13F | LRI Investments, LLC | 153 | 0,00 | 4 | -25,00 | ||||
| 2026-01-14 | 13F | Thompson Investment Management, Inc. | 0 | -100,00 | 0 | |||||
| 2026-01-20 | 13F | Wall Street Access Asset Management, LLC | 3.765 | 0,00 | 98 | -8,49 | ||||
| 2026-02-17 | 13F | Quantessence Capital LLC | 0 | -100,00 | 0 | |||||
| 2026-01-14 | 13F | Nova R Wealth, Inc. | 39.314 | -0,09 | 1.020 | -8,36 | ||||
| 2026-02-12 | 13F | Callan Family Office, LLC | 60.397 | 302,70 | 1.567 | 270,21 | ||||
| 2026-02-12 | 13F | Earnest Partners Llc | 17.282 | 3,19 | 448 | -5,29 | ||||
| 2026-01-29 | 13F | Rakuten Securities, Inc. | 3.180 | -38,74 | 82 | -43,84 | ||||
| 2026-01-20 | 13F | Toth Financial Advisory Corp | 4 | -92,00 | 0 | -100,00 | ||||
| 2026-01-08 | 13F | Armstrong Advisory Group, Inc | 1.000 | 0,00 | 26 | -10,71 | ||||
| 2026-01-23 | 13F | Farther Finance Advisors, LLC | 2.810 | -4,10 | 73 | -12,20 | ||||
| 2025-10-29 | 13F | Arkadios Wealth Advisors | 0 | -100,00 | 0 | |||||
| 2025-11-14 | 13F | Amundi | 0 | -100,00 | 0 | |||||
| 2025-11-14 | 13F | Wolverine Trading, Llc | 30.414 | 58,82 | 854 | 48,26 | ||||
| 2025-11-14 | 13F | Wolverine Trading, Llc | Call | 77.700 | -18,64 | 2.183 | -24,08 | |||
| 2025-11-14 | 13F | Wolverine Trading, Llc | Put | 85.600 | 172,61 | 2.405 | 154,39 | |||
| 2026-02-12 | 13F | Federation des caisses Desjardins du Quebec | 1.571 | -42,98 | 41 | -48,05 | ||||
| 2026-02-10 | 13F | Quantbot Technologies LP | 58.858 | -47,23 | 1.527 | -51,59 | ||||
| 2026-01-05 | 13F | GAMMA Investing LLC | 2.978 | -0,67 | 77 | -8,33 | ||||
| 2025-09-25 | NP | DFAX - Dimensional World ex U.S. Core Equity 2 ETF | 142.276 | 0,00 | 3.618 | 11,98 | ||||
| 2026-02-10 | 13F | Principia Wealth Advisory, LLC | 28 | 16,67 | 1 | |||||
| 2026-02-06 | 13F | Larson Financial Group LLC | 677 | 35,67 | 18 | 21,43 | ||||
| 2026-02-12 | 13F | Marex Group plc | 0 | -100,00 | 0 | |||||
| 2025-11-06 | 13F | Waterfront Wealth Inc. | 0 | -100,00 | 0 | |||||
| 2026-02-06 | 13F | Pnc Financial Services Group, Inc. | 138.344 | -24,84 | 3.589 | -31,01 | ||||
| 2026-02-12 | 13F | Triumph Capital Management | 40 | 0,00 | 1 | 0,00 | ||||
| 2026-02-05 | 13F | Tucker Asset Management Llc | 20 | 1 | ||||||
| 2026-02-10 | 13F | Natixis Advisors, L.p. | 23.688 | -95,30 | 1 | -100,00 | ||||
| 2026-02-06 | 13F | Motco | 756 | 0,00 | 20 | -9,52 | ||||
| 2026-02-12 | 13F | Principal Securities, Inc. | 0 | -100,00 | 0 | -100,00 | ||||
| 2026-02-17 | 13F | Henry James International Management Inc. | 105.143 | 0,00 | 2.727 | -8,21 | ||||
| 2026-02-06 | 13F | New Millennium Group LLC | 25 | 0,00 | 1 | |||||
| 2025-09-25 | NP | DFA INVESTMENT DIMENSIONS GROUP INC - World ex U.S. Core Equity Portfolio Institutional Class Shares | 49.414 | -9,25 | 1.257 | 1,62 | ||||
| 2026-01-26 | 13F | JNBA Financial Advisors | 60 | 2 | ||||||
| 2026-02-04 | 13F | Midwest Trust Co | 54.041 | -0,54 | 1.402 | -8,73 | ||||
| 2026-02-13 | 13F | Foresight Global Investors, Inc. | 483.098 | -12,48 | 12.532 | -19,67 | ||||
| 2026-02-06 | 13F | HighTower Advisors, LLC | 9.520 | 9,73 | 247 | 0,41 | ||||
| 2025-11-20 | 13F | First Affirmative Financial Network | 8.633 | 1,84 | 244 | -5,45 | ||||
| 2026-02-03 | 13F | Garner Asset Management Corp | 20.070 | -0,99 | 521 | -9,09 | ||||
| 2025-10-30 | 13F | Ridgewood Investments LLC | Call | 0 | -100,00 | 0 | -100,00 | |||
| 2026-02-17 | 13F | Russell Investments Group, Ltd. | 10.899 | -93,85 | 283 | -94,37 | ||||
| 2026-02-17 | 13F | DV Trading LLC | 900 | 23 | ||||||
| 2025-09-26 | NP | BlackRock Funds II - BLACKROCK MULTI-ASSET INCOME PORTFOLIO INVESTOR C SHARES | 84.855 | -63,33 | 2.158 | -58,95 | ||||
| 2026-02-13 | 13F | Barclays Plc | 1.490.731 | 22,00 | 38.670 | 11,99 | ||||
| 2026-01-29 | 13F | Calamos Advisors LLC | 0 | -100,00 | 0 | |||||
| 2026-02-10 | 13F | Lido Advisors, LLC | 11.259 | -14,94 | 298 | -20,32 | ||||
| 2026-02-10 | 13F/A | MJT & Associates Financial Advisory Group, Inc. | 585 | 0,00 | 15 | -6,25 | ||||
| 2026-02-03 | 13F | Legacy Wealth Managment, LLC/ID | 34 | 0,00 | 1 | |||||
| 2026-01-14 | 13F | Sterling Investment Advisors Llc /adv | 14.557 | 378 | ||||||
| 2026-02-17 | 13F | Fmr Llc | 770.893 | -4,05 | 19.997 | -11,93 | ||||
| 2026-02-11 | 13F | Sunrise Financial Services, LLC | 421 | 11 | ||||||
| 2025-10-08 | 13F | Guided Capital Wealth Management, LLC | 0 | -100,00 | 0 | |||||
| 2025-11-13 | 13F | Kayne Anderson Rudnick Investment Management Llc | 0 | -100,00 | 0 | |||||
| 2026-01-30 | 13F | Oakworth Capital, Inc. | 759 | 0,00 | 20 | -9,52 | ||||
| 2026-02-06 | 13F | Banque Cantonale Vaudoise | 2.834 | 74 | ||||||
| 2026-02-13 | 13F | Ieq Capital, Llc | 27.416 | 17,89 | 711 | 8,22 | ||||
| 2026-02-17 | 13F | Optiver Holding B.V. | Call | 1.441.300 | 2,49 | 37.387 | -5,93 | |||
| 2026-02-17 | 13F | Raymond James Financial Inc | 33.494 | -81,65 | 869 | -83,17 | ||||
| 2025-11-06 | 13F | CENTRAL TRUST Co | 0 | -100,00 | 0 | -100,00 | ||||
| 2026-02-12 | 13F | Steward Partners Investment Advisory, Llc | 769 | -34,10 | 20 | -40,62 | ||||
| 2026-02-17 | 13F | Optiver Holding B.V. | Put | 707.800 | -26,68 | 18.360 | -32,70 | |||
| 2026-01-14 | 13F | Eastern Bank | 6.000 | 0,00 | 156 | -8,28 | ||||
| 2026-01-26 | 13F | Grandview Asset Management LLC | 9.054 | -53,29 | 235 | -57,22 | ||||
| 2026-02-17 | 13F | Captrust Financial Advisors | 10.748 | 7,50 | 279 | -1,42 | ||||
| 2026-02-17 | 13F | Bank Of America Corp /de/ | 1.398.010 | -58,50 | 36.264 | -61,91 | ||||
| 2026-02-12 | 13F | Skopos Labs, Inc. | 28.561 | 152,84 | 743 | 118,53 | ||||
| 2026-02-10 | 13F | Bank of New York Mellon Corp | 30.774 | -28,53 | 798 | -34,37 | ||||
| 2026-02-17 | 13F | Tudor Investment Corp Et Al | Call | 25.900 | -70,20 | 672 | -72,67 | |||
| 2026-02-17 | 13F | Tudor Investment Corp Et Al | Put | 18.100 | -61,08 | 470 | -64,31 | |||
| 2026-02-10 | 13F | Rothschild Investment Llc | 1.221 | -7,15 | 32 | -16,22 | ||||
| 2026-02-10 | 13F | Goldman Sachs Group Inc | Put | 90.000 | 2.335 | |||||
| 2026-02-17 | 13F | Grantham, Mayo, Van Otterloo & Co. LLC | 1.019.708 | 20,47 | 26.451 | 10,58 | ||||
| 2026-01-20 | 13F | Signaturefd, Llc | 17.026 | -17,34 | 442 | -24,23 | ||||
| 2026-02-13 | 13F | Aigen Investment Management, Lp | 0 | -100,00 | 0 | |||||
| 2026-01-08 | 13F | Dagco, Inc. | 70 | 0,00 | 2 | 0,00 | ||||
| 2026-02-10 | 13F | Goldman Sachs Group Inc | 4.553.170 | 5,51 | 118.109 | -3,15 | ||||
| 2026-02-10 | 13F | Goldman Sachs Group Inc | Call | 175.000 | 0,00 | 4.540 | -8,21 | |||
| 2025-12-15 | 13F | FNY Investment Advisers, LLC | 0 | -100,00 | 0 | |||||
| 2026-02-11 | 13F | West Family Investments, Inc. | 0 | -100,00 | 0 | -100,00 | ||||
| 2025-11-14 | 13F | Maytus Capital Management, LLC | 0 | -100,00 | 0 | -100,00 | ||||
| 2026-02-13 | 13F | Ingalls & Snyder Llc | 20.342 | -93,97 | 1 | -100,00 | ||||
| 2025-09-24 | NP | SNTKX - Steward International Enhanced Index Fund Class A | 35.903 | 3,42 | 913 | 15,86 | ||||
| 2025-11-14 | 13F | Ardsley Advisory Partners Lp | 0 | -100,00 | 0 | -100,00 | ||||
| 2026-02-13 | 13F | Morgan Stanley | 6.156.161 | 40,61 | 159.691 | 29,07 | ||||
| 2026-02-24 | 13F | DGS Capital Management, LLC | 0 | -100,00 | 0 | |||||
| 2026-02-17 | 13F | ExodusPoint Capital Management, LP | 0 | -100,00 | 0 | -100,00 | ||||
| 2026-01-26 | 13F | Diversified Management Inc | 25.000 | 648 | ||||||
| 2026-02-17 | 13F | Two Sigma Advisers, Lp | 562.500 | 105,82 | 14.591 | 88,93 | ||||
| 2026-02-12 | 13F | Hrt Financial Lp | 180.340 | 16,49 | 5 | 0,00 | ||||
| 2026-02-04 | 13F | Tsfg, Llc | 37 | 0,00 | 0 | |||||
| 2025-11-07 | 13F | HighTower Advisors, LLC | Call | 0 | -100,00 | 0 | -100,00 | |||
| 2026-02-11 | 13F | Parallel Advisors, LLC | 5.055 | -11,38 | 131 | -18,63 | ||||
| 2026-02-17 | 13F | ClearAlpha Technologies LP | 11.324 | 294 | ||||||
| 2025-11-14 | 13F | Symmetry Investments LP | 0 | -100,00 | 0 | -100,00 | ||||
| 2026-02-18 | 13F | Mackenzie Financial Corp | 558.730 | 12,12 | 14.532 | 3,19 | ||||
| 2026-02-18 | 13F | GWM Advisors LLC | 53 | 0,00 | 1 | 0,00 | ||||
| 2026-01-28 | 13F | Salomon & Ludwin, LLC | 163 | -39,85 | 4 | -42,86 | ||||
| 2025-09-24 | NP | PFPPX - MidCap Growth Fund R-3 | 122.429 | 3.113 | ||||||
| 2025-09-26 | NP | BlackRock Funds II - BlackRock Dynamic High Income Portfolio Investor A This fund is a listed as child fund of BlackRock, Inc. and if that institution has disclosed ownership in this security, then these positions will not be double counted when calculating total shares and total value | 4.868 | -24,76 | 124 | -15,75 | ||||
| 2026-02-17 | 13F | Align Financial, LLC | 12.970 | 13 | ||||||
| 2026-02-13 | 13F | MAI Capital Management | 3.277 | -0,97 | 85 | -8,60 | ||||
| 2026-02-17 | 13F | SALT Holding Corp. | 75.900 | 0,00 | 1.969 | -8,21 | ||||
| 2026-02-17 | 13F | SALT Holding Corp. | Call | 50.000 | 1.297 | |||||
| 2026-02-03 | 13F | Strengthening Families & Communities, LLC | 0 | -100,00 | 0 | -100,00 | ||||
| 2026-01-30 | 13F/A | M&t Bank Corp | 12.243 | 26,14 | 318 | 15,69 | ||||
| 2026-02-04 | 13F | Summit Wealth Group Llc / Co | 0 | -100,00 | 0 | -100,00 | ||||
| 2026-02-11 | 13F | Simplex Trading, Llc | Call | 240.600 | 105,99 | 6.241 | 207.933,33 | |||
| 2025-10-28 | 13F | Washington Capital Management Inc | 0 | -100,00 | 0 | -100,00 | ||||
| 2025-11-12 | 13F | NewSquare Capital LLC | 0 | -100,00 | 0 | -100,00 | ||||
| 2026-02-06 | 13F | Kimelman & Baird, LLC | 0 | -100,00 | 0 | |||||
| 2026-02-04 | 13F | Abc Arbitrage Sa | 0 | -100,00 | 0 | -100,00 | ||||
| 2025-11-03 | 13F | Annis Gardner Whiting Capital Advisors, LLC | 0 | -100,00 | 0 | |||||
| 2026-02-09 | 13F | Huntington National Bank | 1 | 0,00 | 0 | |||||
| 2025-11-13 | 13F | Pinnacle Associates Ltd | 0 | -100,00 | 0 | -100,00 | ||||
| 2026-01-28 | 13F | City State Bank | 510 | 0,00 | 13 | -7,14 | ||||
| 2026-01-16 | 13F | Ronald Blue Trust, Inc. | 3.962 | -11,11 | 103 | -18,40 | ||||
| 2026-02-12 | 13F | BlackRock, Inc. | 8.269.221 | 23,24 | 214.504 | 13,12 | ||||
| 2026-01-05 | 13F | Park Avenue Securities Llc | 0 | -100,00 | 0 | |||||
| 2026-02-17 | 13F | Ameriprise Financial Inc | 162.051 | -11,27 | 4.204 | -18,56 | ||||
| 2026-01-28 | 13F | Eagle Global Advisors Llc | 0 | -100,00 | 0 | |||||
| 2026-02-12 | 13F | Hm Payson & Co | 0 | -100,00 | 0 | |||||
| 2026-02-10 | 13F/A | Northwestern Mutual Wealth Management Co | 6.214 | 13,54 | 161 | 4,55 | ||||
| 2026-01-21 | 13F | Indiana Trust & Investment Management CO | 2.250 | 0,00 | 58 | -7,94 | ||||
| 2025-09-25 | NP | Dfa Investment Trust Co - The Dfa International Value Series This fund is a listed as child fund of Dimensional Fund Advisors Lp and if that institution has disclosed ownership in this security, then these positions will not be double counted when calculating total shares and total value | 121.506 | 3.090 | ||||||
| 2025-09-24 | NP | BLACKROCK MID CAP DIVIDEND SERIES, INC. - BlackRock Mid Cap Dividend Fund Investor A This fund is a listed as child fund of BlackRock, Inc. and if that institution has disclosed ownership in this security, then these positions will not be double counted when calculating total shares and total value | 206.177 | -58,89 | 5.243 | -53,97 | ||||
| 2026-01-08 | 13F | Wealth Enhancement Advisory Services, Llc | 19.664 | -1,94 | 578 | 2,48 | ||||
| 2025-11-14 | 13F | Cubist Systematic Strategies, LLC | Call | 0 | -100,00 | 0 | -100,00 | |||
| 2026-01-23 | 13F | Optima Capital Llc | 365 | 9 | ||||||
| 2026-01-27 | 13F | Atlantic Edge Private Wealth Management, LLC | 100 | 3 | ||||||
| 2026-01-27 | 13F | TD Waterhouse Canada Inc. | 123 | 3 | ||||||
| 2026-02-13 | 13F | Colony Group, LLC | 0 | -100,00 | 0 | |||||
| 2026-02-13 | 13F | Firsthand Capital Management, Inc. | 5.000 | 0,00 | 130 | -8,51 | ||||
| 2026-02-03 | 13F | Mitsubishi UFJ Kokusai Asset Management Co., Ltd. | 82.020 | 10,88 | 2.245 | 7,37 | ||||
| 2026-02-13 | 13F | Hurley Capital, LLC | 190 | 5 | ||||||
| 2026-02-13 | 13F | Pinnacle Wealth Planning Services, Inc. | 1.519 | 39 | ||||||
| 2026-02-17 | 13F | Balyasny Asset Management Llc | Put | 0 | -100,00 | 0 | -100,00 | |||
| 2026-01-30 | 13F | Rogco, Lp | 215 | 0,00 | 6 | -16,67 | ||||
| 2026-02-05 | 13F | Bessemer Group Inc | 233 | 17,09 | 0 | |||||
| 2026-02-13 | 13F | Walleye Trading LLC | 80.570 | 145,56 | 2.090 | 125,35 | ||||
| 2026-02-13 | 13F | Walleye Trading LLC | Put | 127.500 | 16,23 | 3.307 | 6,68 | |||
| 2025-09-29 | NP | VVOAX - Invesco Value Opportunities Fund Class A | 2.744.844 | -8,24 | 69.801 | 2,75 | ||||
| 2026-02-05 | 13F | Elyxium Wealth, LLC | 15 | 0 | ||||||
| 2026-02-13 | 13F | Walleye Trading LLC | Call | 4.000 | -2,44 | 104 | -10,43 | |||
| 2026-02-13 | 13F | Pathstone Holdings, LLC | Call | 3.000 | 1 | |||||
| 2025-10-30 | 13F | Twin Peaks Wealth Advisors, LLC | 0 | -100,00 | 0 | -100,00 | ||||
| 2026-02-13 | 13F | Pathstone Holdings, LLC | 32.671 | 2,01 | 847 | 2,17 | ||||
| 2026-02-13 | 13F | Citigroup Inc | 990.488 | 38,29 | 25.693 | 26,94 | ||||
| 2026-01-28 | 13F | N.E.W. Advisory Services LLC | 100 | 0,00 | 3 | 0,00 | ||||
| 2026-01-08 | 13F | True Wealth Design, LLC | 98 | -84,88 | 3 | -88,89 | ||||
| 2026-01-16 | 13F | Empirical Financial Services, LLC d.b.a. Empirical Wealth Management | 9.583 | 249 | ||||||
| 2026-02-11 | 13F | Simplex Trading, Llc | Put | 174.500 | 63,70 | 4.527 | 150.766,67 | |||
| 2026-02-13 | 13F | Sei Investments Co | 87.417 | -53,40 | 2.268 | -57,23 | ||||
| 2026-02-17 | 13F | Beaconlight Capital, Llc | 0 | -100,00 | 0 | |||||
| 2025-09-29 | NP | SOXY - YieldMax(TM) Target 12(TM) Semiconductor Option Income ETF | 1.793 | 16,05 | 46 | 28,57 | ||||
| 2026-02-06 | 13F | Lloyd Advisory Services, LLC. | 300 | 8 | ||||||
| 2026-02-11 | 13F | Jpmorgan Chase & Co | 3.370.579 | -15,54 | 87.433 | -22,48 | ||||
| 2026-02-11 | 13F | Nemes Rush Group LLC | 27 | 1 | ||||||
| 2025-11-13 | 13F | Macquarie Group Ltd | 0 | -100,00 | 0 | -100,00 | ||||
| 2025-11-14 | 13F | Shellback Capital, LP | 0 | -100,00 | 0 | |||||
| 2026-01-15 | 13F | Frank, Rimerman Advisors LLC | 9.149 | 0,68 | 237 | -7,42 | ||||
| 2026-02-12 | 13F | Penserra Capital Management LLC | 1.517.517 | 63,58 | 39 | 50,00 | ||||
| 2026-02-17 | 13F | Caption Management, LLC | 23.300 | -51,76 | 604 | -55,72 | ||||
| 2026-02-17 | 13F | Engineers Gate Manager LP | 0 | -100,00 | 0 | |||||
| 2025-11-14 | 13F | Prelude Capital Management, Llc | 0 | -100,00 | 0 | |||||
| 2026-01-29 | 13F | UBS Group AG | Put | 62.400 | 0,00 | 1.619 | -8,22 | |||
| 2026-01-29 | 13F | UBS Group AG | Call | 188.600 | 1.223,51 | 4.892 | 1.116,92 | |||
| 2026-01-29 | 13F | UBS Group AG | 1.378.722 | 63,12 | 35.764 | 49,73 | ||||
| 2026-01-21 | 13F | TPG Advisors LLC | 9.603 | 0,00 | 249 | -8,12 | ||||
| 2026-02-06 | 13F | Cullen/frost Bankers, Inc. | 0 | -100,00 | 0 | |||||
| 2026-02-11 | 13F | LPL Financial LLC | 159.000 | 2,55 | 4.124 | -5,87 | ||||
| 2026-02-12 | 13F | BRYN MAWR TRUST Co | 2.000 | 0,00 | 52 | -8,93 | ||||
| 2026-01-27 | 13F | Evergreen Capital Management Llc | 66.477 | 305,05 | 1.724 | 272,35 | ||||
| 2026-02-12 | 13F | New York State Common Retirement Fund | 126.282 | -12,90 | 3.276 | -20,06 | ||||
| 2026-02-20 | 13F | Sunbelt Securities, Inc. | 856 | 0,00 | 22 | -8,33 | ||||
| 2026-01-21 | 13F | Yousif Capital Management, Llc | 10.389 | 0,00 | 282 | -4,10 | ||||
| 2026-02-17 | 13F | Advisor Group Holdings, Inc. | 26.139 | -13,38 | 678 | -18,51 | ||||
| 2026-02-13 | 13F | Rhumbline Advisers | 20.901 | 16,35 | 542 | 6,90 | ||||
| 2026-02-17 | 13F | Duquesne Family Office LLC | 773.555 | 20 | ||||||
| 2026-02-17 | 13F | Parvin Asset Management, LLC | 3.355 | -30,18 | 87 | -35,56 | ||||
| 2026-02-03 | 13F | Sequoia Financial Advisors, LLC | 7.726 | -39,84 | 200 | -44,75 | ||||
| 2026-02-06 | 13F | Covestor Ltd | 2.205 | 5,86 | 0 | |||||
| 2026-02-13 | 13F | Gts Securities Llc | 16.427 | 43,45 | 426 | 31,89 | ||||
| 2025-11-14 | 13F | Graham Capital Management, L.P. | 0 | -100,00 | 0 | -100,00 | ||||
| 2025-11-14 | 13F | Polymer Capital Management (US) LLC | 0 | -100,00 | 0 | -100,00 | ||||
| 2026-02-12 | 13F | Peterson Wealth Services | 37 | -96,86 | 1 | -100,00 | ||||
| 2026-02-13 | 13F | Walleye Capital LLC | Call | 19.200 | -21,95 | 498 | -28,35 | |||
| 2026-01-23 | 13F | Hardman Johnston Global Advisors LLC | 372.431 | -3,65 | 9.661 | -11,56 | ||||
| 2026-02-13 | 13F | Walleye Capital LLC | Put | 269.300 | 169,57 | 6.986 | 147,43 | |||
| 2026-02-13 | 13F | Walleye Capital LLC | 150.874 | 103,91 | 3.914 | 87,14 | ||||
| 2026-01-06 | 13F | Investors Research Corp | 14.120 | -30,60 | 366 | -36,24 | ||||
| 2026-01-16 | 13F | Bangor Savings Bank | 39 | 0,00 | 1 | 0,00 | ||||
| 2026-02-17 | 13F | Imprint Wealth LLC | 0 | -100,00 | 0 | |||||
| 2026-02-17 | 13F | Quantitative Investment Management, LLC | 54.560 | 386,93 | 1 | |||||
| 2026-02-13 | 13F | Stifel Financial Corp | 164.422 | 39,48 | 4.265 | 28,04 | ||||
| 2026-01-14 | 13F | Net Worth Advisory Group | 11.120 | 288 | ||||||
| 2026-01-07 | 13F | Harbor Investment Advisory, Llc | 34 | 0,00 | 1 | |||||
| 2025-09-25 | NP | HTECX - Hennessy Technology Fund Investor Class | 3.977 | -20,40 | 101 | -10,62 | ||||
| 2025-09-26 | NP | HAOSX - Harbor Overseas Fund Institutional Class | 134.179 | 43,68 | 3.412 | 60,94 |