Grundlæggende statistik
| Institutionelle aktier (lange) | 125.400.646 - 92,32% (ex 13D/G) - change of -25,90MM shares -17,12% MRQ |
| Institutionel værdi (lang) | $ 4.135.204 USD ($1000) |
Institutionelt ejerskab og aktionærer
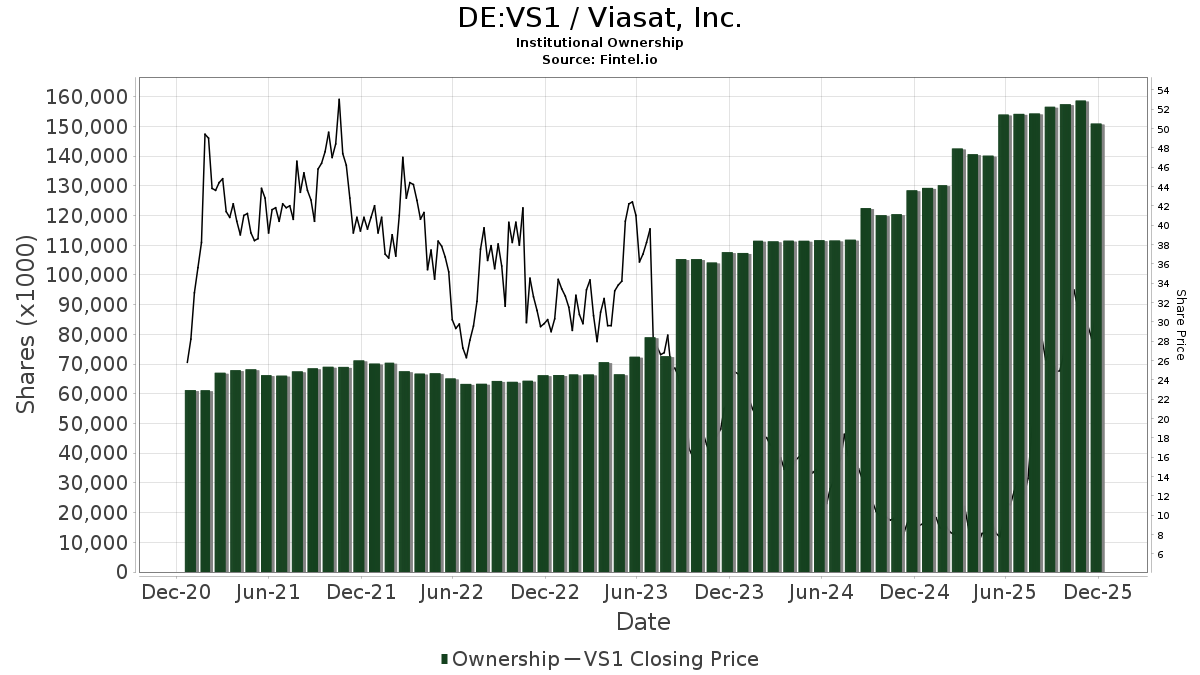
Viasat, Inc. (DE:VS1) har 364 institutionelle ejere og aktionærer, der har indsendt 13D/G- eller 13F-formularer til Securities Exchange Commission (SEC). Disse institutioner har i alt 125,400,646 aktier. Største aktionærer omfatter BlackRock, Inc., Vanguard Group Inc, OCO Capital Partners, L.P., Disciplined Growth Investors Inc /mn, State Street Corp, Neuberger Berman Group LLC, American Century Companies Inc, Dimensional Fund Advisors Lp, Geode Capital Management, Llc, and Price T Rowe Associates Inc /md/ .
Viasat, Inc. (DB:VS1) institutionel ejerskabsstruktur viser aktuelle positioner i virksomheden efter institutioner og fonde, samt seneste ændringer i positionsstørrelse. Større aktionærer kan omfatte individuelle investorer, investeringsforeninger, hedgefonde eller institutioner. Skema 13D angiver, at investoren besidder (eller besidder) mere end 5 % af virksomheden og har til hensigt (eller har til hensigt at) aktivt at forfølge en ændring i forretningsstrategi. Skema 13G indikerer en passiv investering på over 5%.
The share price as of April 24, 2026 is 52,56 / share. Previously, on April 28, 2025, the share price was 7,88 / share. This represents an increase of 567,34% over that period.
Fondens stemningsscore
Fund Sentiment Score (fka Ownership Accumulation Score) finder de aktier, der bliver mest købt af fonde. Det er resultatet af en sofistikeret, multi-faktor kvantitativ model, der identificerer virksomheder med de højeste niveauer af institutionel akkumulering. Scoringsmodellen bruger en kombination af den samlede stigning i oplyste ejere, ændringerne i porteføljeallokeringer i disse ejere og andre målinger. Tallet går fra 0 til 100, hvor højere tal indikerer et højere niveau af akkumulering for sine jævnaldrende, og 50 er gennemsnittet.
Opdateringsfrekvens: Dagligt
Se Ownership Explorer, som giver en liste over højest rangerende virksomheder.
AI+ Ask Fintel’s AI assistant about Viasat, Inc..
Select a question to share a public post with an AI-crafted answer.
Thinking of good questions…
13F og NPORT arkivering
Detaljer om 13F-arkivering er gratis. Detaljer om NP-ansøgninger kræver et premium-medlemskab. Grønne rækker angiver nye positioner. Røde rækker angiver lukkede positioner. Klik på linket ikon for at se den fulde transaktionshistorik.
Opgrader
for at låse premium-data op og eksportere til Excel ![]() .
.
| Fil dato | Kilde | Investor | Type | Gennemsnitlig pris (Øst) |
Aktier | Δ Aktier (%) |
Rapporteret Værdi ($1000) |
Δ Værdi (%) |
Port Alloc (%) |
|
|---|---|---|---|---|---|---|---|---|---|---|
| 2026-02-13 | 13F | Public Sector Pension Investment Board | 0 | -100,00 | 0 | |||||
| 2026-02-13 | 13F | Van Eck Associates Corp | 1.026.364 | 44,88 | 35 | 75,00 | ||||
| 2026-02-17 | 13F | Qube Research & Technologies Ltd | 0 | -100,00 | 0 | |||||
| 2026-02-12 | 13F | Scotia Capital Inc. | 0 | -100,00 | 0 | |||||
| 2026-02-13 | 13F | Walleye Capital LLC | Put | 40.800 | -36,74 | 1.406 | -25,62 | |||
| 2026-02-13 | 13F | Walleye Capital LLC | 23.827 | -49,22 | 821 | -40,25 | ||||
| 2026-02-13 | 13F | Walleye Capital LLC | Call | 31.500 | 111,41 | 1.085 | 148,85 | |||
| 2026-02-05 | 13F | Bank Julius Baer & Co. Ltd, Zurich | 0 | -100,00 | 0 | |||||
| 2026-02-17 | 13F | Empyrean Capital Partners, LP | 1.138.000 | 0,00 | 39.215 | 17,61 | ||||
| 2025-11-21 | 13F | Nebula Research & Development LLC | 0 | -100,00 | 0 | |||||
| 2026-02-12 | 13F | Skopos Labs, Inc. | 8.718 | 302 | ||||||
| 2026-01-30 | 13F | Torren Management, LLC | 694 | 24 | ||||||
| 2026-02-13 | 13F | Public Employees Retirement Association Of Colorado | 5.716 | 0,00 | 0 | |||||
| 2026-02-17 | 13F | Ameriprise Financial Inc | 250.026 | -4,16 | 8.616 | 12,72 | ||||
| 2025-11-12 | 13F | HAP Trading, LLC | 24.818 | 727 | ||||||
| 2026-04-13 | 13F | True Wealth Design, LLC | 276 | 89,04 | 13 | 140,00 | ||||
| 2026-02-06 | 13F | Vestmark Advisory Solutions, Inc. | 6.293 | 217 | ||||||
| 2026-02-17 | 13F | Kemnay Advisory Services Inc. | 368 | 13 | ||||||
| 2025-12-09 | 13F/A | Tudor Investment Corp Et Al | 0 | -100,00 | 0 | -100,00 | ||||
| 2026-02-13 | 13F | Rhumbline Advisers | 337.510 | -9,10 | 11.631 | 6,91 | ||||
| 2026-02-17 | 13F | Taconic Capital Advisors LP | 180.000 | 28,57 | 6.203 | 51,19 | ||||
| 2026-02-17 | 13F | Guggenheim Capital Llc | 27.605 | -11,24 | 951 | 4,39 | ||||
| 2025-11-14 | 13F | Peak6 Llc | Call | 0 | -100,00 | 0 | ||||
| 2026-01-30 | 13F | Mitsubishi UFJ Trust & Banking Corp | 22.209 | -46,45 | 765 | -37,04 | ||||
| 2026-02-05 | 13F | HFM Investment Advisors, LLC | 6 | 0 | ||||||
| 2026-02-10 | 13F/A | Northwestern Mutual Wealth Management Co | 259 | 1.892,31 | 9 | |||||
| 2026-02-17 | 13F | Amundi | 10.840 | 4,19 | 374 | 8,75 | ||||
| 2026-02-17 | 13F | Atom Investors LP | 117.998 | -31,44 | 4.066 | -19,36 | ||||
| 2026-04-14 | 13F | Nbc Securities, Inc. | 325 | -32,29 | 15 | -12,50 | ||||
| 2026-02-02 | 13F | Wolverine Asset Management Llc | Put | 101.700 | 0,00 | 3.505 | 17,62 | |||
| 2026-02-05 | 13F | Thrivent Financial For Lutherans | 92.944 | -4,04 | 3 | 50,00 | ||||
| 2025-11-14 | 13F | Schonfeld Strategic Advisors LLC | 0 | -100,00 | 0 | |||||
| 2026-02-06 | 13F | EverSource Wealth Advisors, LLC | 2.260 | 57,71 | 78 | 87,80 | ||||
| 2026-02-17 | 13F | Boothbay Fund Management, Llc | 0 | -100,00 | 0 | |||||
| 2026-02-02 | 13F | Principal Financial Group Inc | 644.170 | -0,46 | 22.198 | 17,07 | ||||
| 2026-02-06 | 13F | Hi-Line Capital Management, LLC | 211.050 | -15,70 | 7.273 | -0,86 | ||||
| 2026-02-12 | 13F | MetLife Investment Management, LLC | 67.835 | -0,96 | 2.338 | 16,50 | ||||
| 2026-04-24 | 13F | Root Financial Partners, LLC | 331 | 50,45 | 15 | 114,29 | ||||
| 2026-04-15 | 13F | Activest Wealth Management | 2.000 | 100,00 | 92 | 167,65 | ||||
| 2026-02-11 | 13F | Group One Trading, L.p. | Put | 153.400 | -45,00 | 5.286 | -35,31 | |||
| 2026-02-17 | 13F | Janus Henderson Group Plc | 47.237 | 0,00 | 1.628 | 17,72 | ||||
| 2026-02-11 | 13F | Group One Trading, L.p. | 17.770 | 612 | ||||||
| 2026-02-13 | 13F | Barclays Plc | Call | 0 | -100,00 | 0 | -100,00 | |||
| 2026-02-17 | 13F | Cetera Investment Advisers | 8.388 | 11,60 | 289 | 31,36 | ||||
| 2026-02-02 | 13F | Danske Bank A/s | 1.368 | 47 | ||||||
| 2026-02-11 | 13F | Group One Trading, L.p. | Call | 98.000 | -54,69 | 3.377 | -46,71 | |||
| 2026-02-13 | 13F | Barclays Plc | Put | 0 | -100,00 | 0 | -100,00 | |||
| 2026-02-13 | 13F | Inspire Advisors, LLC | 9.749 | -93,65 | 336 | -92,55 | ||||
| 2026-04-24 | 13F | Yousif Capital Management, Llc | 36.602 | 0,31 | 1.676 | 9,61 | ||||
| 2026-02-13 | 13F | Ubs Oconnor Llc | Put | 0 | -100,00 | 0 | ||||
| 2026-02-17 | 13F | Weiss Asset Management LP | 193.840 | 6.680 | ||||||
| 2026-02-09 | 13F | Atlantic Trust, LLC | 0 | -100,00 | 0 | |||||
| 2026-04-06 | 13F | Versant Capital Management, Inc | 4.733 | 170,46 | 217 | 260,00 | ||||
| 2026-04-15 | 13F | Tema Etfs Llc | 420 | 19 | ||||||
| 2026-04-23 | 13F | Farmers & Merchants Investments Inc | 60 | 20,00 | 3 | 100,00 | ||||
| 2026-01-21 | 13F | Flagship Harbor Advisors, Llc | 8 | 0 | ||||||
| 2026-02-06 | 13F | Profund Advisors Llc | 5.839 | 201 | ||||||
| 2026-02-13 | 13F | Squarepoint Ops LLC | 0 | -100,00 | 0 | -100,00 | ||||
| 2026-02-12 | 13F | State Board Of Administration Of Florida Retirement System | 33.247 | -1,19 | 1.146 | 16,24 | ||||
| 2026-02-06 | 13F | Global Retirement Partners, LLC | 8.604 | 296 | ||||||
| 2026-02-05 | 13F | High Note Wealth, LLC | 67 | 2 | ||||||
| 2026-02-17 | 13F | Aperture Investors, LLC | 0 | -100,00 | 0 | |||||
| 2025-11-13 | 13F | Entropy Technologies, LP | 0 | -100,00 | 0 | -100,00 | ||||
| 2026-01-28 | 13F | Salomon & Ludwin, LLC | 868 | 0,00 | 33 | 22,22 | ||||
| 2026-02-18 | 13F | State of Tennessee, Treasury Department | 46.952 | 0,75 | 2.121 | 55,31 | ||||
| 2026-02-13 | 13F | Great West Life Assurance Co /can/ | 120.820 | -12,07 | 4 | 33,33 | ||||
| 2026-04-08 | 13F | DiNuzzo Private Wealth, Inc. | 16 | 0,00 | 1 | |||||
| 2026-02-17 | 13F | Trexquant Investment LP | 0 | -100,00 | 0 | |||||
| 2026-02-13 | 13F | Bridgewater Associates, LP | 121.922 | 32,85 | 4.201 | 56,23 | ||||
| 2026-02-05 | 13F | Bessemer Group Inc | 102.711 | 8.416,67 | 4 | |||||
| 2025-11-03 | 13F | SummerHaven Investment Management, LLC | 0 | -100,00 | 0 | -100,00 | ||||
| 2026-04-17 | 13F | Vermillion Wealth Management, Inc. | 10 | 0 | ||||||
| 2026-02-12 | 13F | Ensign Peak Advisors, Inc | 8.416 | -57,74 | 290 | -50,26 | ||||
| 2025-11-14 | 13F | Scientech Research LLC | 0 | -100,00 | 0 | |||||
| 2026-01-29 | 13F | Concord Wealth Partners | 14 | 0 | ||||||
| 2026-02-17 | 13F | Two Sigma Advisers, Lp | 6.181 | -89,29 | 213 | -87,46 | ||||
| 2026-02-03 | 13F | Mitsubishi UFJ Kokusai Asset Management Co., Ltd. | 112.052 | -62,01 | 4.217 | -51,21 | ||||
| 2026-04-20 | 13F | Jfs Wealth Advisors, Llc | 56 | 40,00 | 3 | 100,00 | ||||
| 2026-02-17 | 13F | Price T Rowe Associates Inc /md/ | 3.222.981 | 2.821,72 | 111 | 3.600,00 | ||||
| 2026-01-30 | 13F | New York State Teachers Retirement System | 115.154 | 4,62 | 4 | 0,00 | ||||
| 2026-02-17 | 13F | Millennium Management Llc | 36.603 | -54,24 | 1.261 | -46,18 | ||||
| 2026-02-12 | 13F | Hrt Financial Lp | 65.122 | 2 | ||||||
| 2026-02-10 | 13F | Norges Bank | 106.577 | 3.673 | ||||||
| 2026-01-29 | 13F | Vanguard Group Inc | 16.763.543 | -1,18 | 577.672 | 16,23 | ||||
| 2026-02-10 | 13F | State of Wyoming | 23.830 | -27,48 | 821 | -14,66 | ||||
| 2026-02-06 | 13F | Covestor Ltd | 656 | 0,00 | 0 | |||||
| 2026-02-12 | 13F | Ankerstar Wealth, LLC | 20 | 1 | ||||||
| 2026-02-11 | 13F | Everett Harris & Co /ca/ | 35.000 | 0,00 | 1.206 | 17,66 | ||||
| 2026-02-13 | 13F | Caxton Associates Llp | 0 | -100,00 | 0 | |||||
| 2026-04-20 | 13F | Kestra Private Wealth Services, Llc | 19.875 | -17,26 | 910 | 10,04 | ||||
| 2026-02-17 | 13F | Fmr Llc | 63.535 | -23,09 | 2.189 | -9,55 | ||||
| 2026-02-17 | 13F | Bridgeway Capital Management Inc | 776.710 | -1,36 | 26.765 | 16,01 | ||||
| 2025-11-13 | 13F | Farringdon Capital, Ltd. | 0 | -100,00 | 0 | -100,00 | ||||
| 2026-01-28 | 13F | Arizona State Retirement System | 31.774 | 3,04 | 1.095 | 21,15 | ||||
| 2026-02-18 | 13F | Mackenzie Financial Corp | 47.549 | -0,65 | 1.677 | 19,61 | ||||
| 2026-02-17 | 13F | Paloma Partners Management Co | Call | 400.000 | 13.784 | |||||
| 2026-02-17 | 13F | Mairs & Power Inc | 13.000 | 0,00 | 448 | 17,63 | ||||
| 2026-04-21 | 13F | Wedbush Securities Inc | 7.495 | -3,04 | 0 | |||||
| 2026-02-17 | 13F | Paloma Partners Management Co | 168.050 | 5.791 | ||||||
| 2026-02-13 | 13F | Magnolia Capital Advisors Llc | 6.720 | 232 | ||||||
| 2026-04-15 | 13F | Fortitude Family Office, LLC | 74 | 311,11 | 3 | |||||
| 2026-02-13 | 13F | Pinnacle Wealth Planning Services, Inc. | 2.688 | 93 | ||||||
| 2026-02-13 | 13F | Pathstone Holdings, LLC | 14.397 | 40,68 | 496 | 65,89 | ||||
| 2026-02-13 | 13F | Police & Firemen's Retirement System of New Jersey | 33.411 | 2,27 | 1.151 | 20,27 | ||||
| 2026-02-13 | 13F | Macquarie Group Ltd | 57.790 | -6,02 | 1.991 | 10,55 | ||||
| 2026-04-14 | 13F | Bay Harbor Wealth Management, LLC | 15 | 275,00 | 1 | |||||
| 2026-01-28 | 13F | Klp Kapitalforvaltning As | 24.300 | 14,08 | 837 | 34,13 | ||||
| 2025-12-15 | 13F | FNY Investment Advisers, LLC | 0 | -100,00 | 0 | |||||
| 2026-02-17 | 13F | Royal Bank Of Canada | 113.542 | -89,77 | 3.913 | -87,97 | ||||
| 2026-02-13 | 13F | Edgestream Partners, L.P. | 15.827 | -85,55 | 545 | -83,01 | ||||
| 2025-11-14 | 13F | Jain Global LLC | 0 | -100,00 | 0 | -100,00 | ||||
| 2026-02-14 | 13F | Rockefeller Capital Management L.P. | 6.427 | 278,06 | 221 | 351,02 | ||||
| 2026-01-23 | 13F | Cambiar Investors Llc | 7.438 | -17,77 | 256 | -3,40 | ||||
| 2026-02-12 | 13F | Voya Investment Management Llc | 53.151 | 25,77 | 1.832 | 47,90 | ||||
| 2026-02-06 | 13F | Pnc Financial Services Group, Inc. | 8.039 | 5,18 | 277 | 24,22 | ||||
| 2025-11-14 | 13F | Bayesian Capital Management, LP | 0 | -100,00 | 0 | -100,00 | ||||
| 2026-04-21 | 13F | Pallas Capital Advisors LLC | 5.573 | -9,09 | 255 | 20,85 | ||||
| 2025-11-14 | 13F | Point72 Asia (Singapore) Pte. Ltd. | 0 | -100,00 | 0 | |||||
| 2026-02-19 | 13F | Invesco Ltd. | 1.418.779 | -33,39 | 48.891 | -21,66 | ||||
| 2026-02-13 | 13F | Barclays Plc | 196.042 | 18,07 | 6.756 | 38,88 | ||||
| 2026-02-13 | 13F | Landscape Capital Management, L.l.c. | 0 | -100,00 | 0 | |||||
| 2026-02-17 | 13F | Clear Street Markets Llc | 0 | -100,00 | 0 | |||||
| 2026-02-17 | 13F | Brevan Howard Capital Management LP | 14.214 | -68,80 | 490 | -63,34 | ||||
| 2026-02-12 | 13F | Federated Hermes, Inc. | 492.355 | 12,37 | 16.967 | 32,16 | ||||
| 2026-02-12 | 13F | EAM Investors, LLC | 121.963 | -1,97 | 4.203 | 17,21 | ||||
| 2025-11-21 | 13F/A | CIBC Bancorp USA Inc. | 12.569 | 368 | ||||||
| 2026-02-17 | 13F | Raymond James Financial Inc | 40.265 | 112,04 | 1.388 | 149,46 | ||||
| 2026-02-12 | 13F | New York State Common Retirement Fund | 37.594 | 0,00 | 1.295 | 17,62 | ||||
| 2026-01-28 | 13F | Geneos Wealth Management Inc. | 0 | -100,00 | 0 | |||||
| 2026-02-17 | 13F | Crawford Fund Management, LLC | Put | 203.200 | -10,68 | 7.002 | 5,06 | |||
| 2026-02-17 | 13F | State Of Wisconsin Investment Board | 35.088 | -25,40 | 1.209 | -12,26 | ||||
| 2026-02-18 | 13F | EP Wealth Advisors, Inc. | 8.108 | 279 | ||||||
| 2026-02-17 | 13F | Blair William & Co/il | 14.502 | 500 | ||||||
| 2026-04-08 | 13F | M.e. Allison & Co., Inc. | 12.370 | 0,00 | 567 | 32,86 | ||||
| 2026-02-13 | 13F | P Schoenfeld Asset Management Lp | 96.632 | -61,35 | 3.330 | -54,55 | ||||
| 2026-02-09 | 13F | Geode Capital Management, Llc | 3.328.854 | 8,95 | 115.266 | 28,73 | ||||
| 2025-11-12 | 13F | Headlands Technologies LLC | 0 | -100,00 | 0 | -100,00 | ||||
| 2026-04-13 | 13F | IFP Advisors, Inc | 330 | 0,00 | 15 | 36,36 | ||||
| 2026-02-12 | 13F | Xponance, Inc. | 9.920 | 5,73 | 342 | 24,45 | ||||
| 2026-04-20 | 13F | Hilton Head Capital Partners, LLC | 30 | 0,00 | 1 | 0,00 | ||||
| 2026-02-10 | 13F | Tidemark, LLC | 12.755 | 0,00 | 440 | 17,69 | ||||
| 2026-02-09 | 13F | Jefferies Financial Group Inc. | 24.081 | 830 | ||||||
| 2026-02-12 | 13F | Commonwealth Equity Services, Llc | 13.784 | 13,65 | 475 | |||||
| 2025-11-13 | 13F | Cove Street Capital, LLC | 118.932 | -54,04 | 3.485 | -7,78 | ||||
| 2026-02-12 | 13F | Colonial Trust Co / SC | 118 | 0,00 | 4 | 33,33 | ||||
| 2026-02-17 | 13F | Optiver Holding B.V. | 0 | -100,00 | 0 | |||||
| 2026-02-10 | 13F | Pring Turner Capital Group Inc | 23.500 | 0,00 | 810 | 17,59 | ||||
| 2026-02-12 | 13F | Jane Street Group, Llc | 1.298.377 | 3.458,95 | 44.742 | 4.089,33 | ||||
| 2026-02-12 | 13F | Jane Street Group, Llc | Call | 326.300 | 52,91 | 11.244 | 79,85 | |||
| 2026-02-17 | 13F | Defiance ETFs, LLC | 338.486 | 11.962 | ||||||
| 2025-11-14 | 13F | Tenzing Global Management, LLC | 0 | -100,00 | 0 | |||||
| 2026-02-13 | 13F | Neuberger Berman Group LLC | 5.440.385 | -1,38 | 187.691 | 16,28 | ||||
| 2026-02-12 | 13F | Jane Street Group, Llc | Put | 50.100 | -47,70 | 1.726 | -38,49 | |||
| 2026-02-13 | 13F | Y-Intercept (Hong Kong) Ltd | 59.083 | 2.036 | ||||||
| 2025-11-13 | 13F | Arena Capital Advisors, LLC- CA | 0 | -100,00 | 0 | |||||
| 2026-01-12 | 13F | Rialto Wealth Management, LLC | 22 | 1 | ||||||
| 2026-02-13 | 13F | First Sabrepoint Capital Management Lp | Put | 0 | -100,00 | 0 | ||||
| 2026-02-13 | 13F | Panagora Asset Management Inc | 485.223 | 7,63 | 16.721 | 26,59 | ||||
| 2026-02-12 | 13F | Brinker Capital Investments, LLC | 33.989 | 1.171 | ||||||
| 2026-01-27 | 13F | Asset Management One Co., Ltd. | 11.347 | -1,66 | 393 | 16,27 | ||||
| 2026-02-12 | 13F | Quadrant Capital Group Llc | 385 | 75,00 | 13 | 116,67 | ||||
| 2026-04-13 | 13F | Highland Capital Management, Llc | 7.268 | 333 | ||||||
| 2026-02-17 | 13F | Aqr Capital Management Llc | 340.190 | -1,23 | 11.723 | 19,42 | ||||
| 2026-02-13 | 13F | Healthcare Of Ontario Pension Plan Trust Fund | 547.275 | 406,38 | 18.859 | 495,67 | ||||
| 2026-02-20 | 13F | Sunbelt Securities, Inc. | 12 | 0,00 | 0 | |||||
| 2026-02-12 | 13F | Wealthspire Advisors, LLC | 0 | -100,00 | 0 | |||||
| 2026-04-16 | 13F | BI Asset Management Fondsmaeglerselskab A/S | 0 | -100,00 | 0 | |||||
| 2026-02-09 | 13F | New Age Alpha Advisors, LLC | 7.265 | 250 | ||||||
| 2026-04-13 | 13F | Salem Investment Counselors Inc | 1.213 | 56 | ||||||
| 2026-02-11 | 13F | O'shaughnessy Asset Management, Llc | 7.200 | 2,52 | 248 | 20,98 | ||||
| 2026-02-17 | 13F | Long Focus Capital Management, Llc | 1.044.300 | -22,03 | 35.987 | -8,30 | ||||
| 2026-01-29 | 13F | Quent Capital, LLC | 853 | 0,00 | 29 | 20,83 | ||||
| 2026-02-05 | 13F | Gamco Investors, Inc. Et Al | 38.700 | 84,29 | 1.334 | 116,75 | ||||
| 2026-02-18 | 13F/A | Empowered Funds, LLC | 428.707 | -8,08 | 14.773 | 8,11 | ||||
| 2026-02-13 | 13F | Brightline Capital Management, Llc | 2.094.000 | 2,85 | 72.159 | 20,96 | ||||
| 2026-02-17 | 13F | Creative Planning | 45.155 | 35,65 | 1.556 | 59,59 | ||||
| 2026-02-13 | 13F | Kilter Group LLC | 29 | 0,00 | 1 | |||||
| 2026-02-17 | 13F | Tower Research Capital LLC (TRC) | 13.148 | 354,32 | 453 | 439,29 | ||||
| 2026-01-23 | 13F | Assetmark, Inc | 23 | 1 | ||||||
| 2026-02-11 | 13F | Meeder Asset Management Inc | 18.809 | 648 | ||||||
| 2026-01-15 | 13F | Nisa Investment Advisors, Llc | 3.419 | 3,45 | 118 | 21,88 | ||||
| 2026-02-10 | 13F | Bnp Paribas Arbitrage, Sa | 32.247 | -23,44 | 1.111 | -9,97 | ||||
| 2026-02-12 | 13F | BlackRock, Inc. | 20.025.260 | 1,42 | 690.070 | 19,28 | ||||
| 2026-02-13 | 13F | Truvestments Capital Llc | 125 | 4 | ||||||
| 2025-10-31 | 13F | Greatmark Investment Partners, Inc. | 0 | -100,00 | 0 | |||||
| 2025-11-07 | 13F | Shell Asset Management Co | 3.540 | -61,39 | 0 | |||||
| 2026-02-13 | 13F | Morgan Stanley | 1.477.554 | -46,88 | 50.917 | -37,52 | ||||
| 2026-02-13 | 13F | BNP Paribas Asset Management Holding S.A. | 11.022 | 970,10 | 0 | |||||
| 2026-02-17 | 13F | Capital Fund Management S.a. | Put | 29.100 | -21,35 | 1.003 | -7,56 | |||
| 2026-02-17 | 13F | Capital Fund Management S.a. | Call | 47.000 | -16,67 | 1.620 | -2,00 | |||
| 2026-04-20 | 13F | Inscription Capital, LLC | 7.304 | 335 | ||||||
| 2026-02-13 | 13F | Delos Wealth Advisors, LLC | 1.200 | -29,41 | 41 | -16,33 | ||||
| 2026-02-13 | 13F | Wells Fargo & Company/mn | 250.952 | -11,04 | 8.648 | 4,62 | ||||
| 2026-02-13 | 13F | Carronade Capital Management, LP | 2.974.801 | 15,63 | 102.512 | 35,99 | ||||
| 2025-11-14 | 13F | Point72 (DIFC) Ltd | 0 | -100,00 | 0 | -100,00 | ||||
| 2026-02-13 | 13F | Citigroup Inc | Call | 126.000 | -47,72 | 4.342 | -38,52 | |||
| 2026-02-13 | 13F | Citigroup Inc | Put | 835.400 | -41,78 | 28.788 | -31,53 | |||
| 2026-02-13 | 13F | First Trust Advisors Lp | 147.472 | -23,34 | 5.082 | -9,85 | ||||
| 2026-02-13 | 13F | Citigroup Inc | 504.121 | -50,93 | 17.372 | -42,28 | ||||
| 2026-02-17 | 13F | XTX Topco Ltd | 22.759 | 230,61 | 784 | 290,05 | ||||
| 2026-02-13 | 13F | Carronade Capital Management, LP | Call | 1.736.700 | -35,32 | 59.847 | -23,93 | |||
| 2026-02-17 | 13F | Citadel Advisors Llc | 419.212 | 5.210,51 | 14.446 | 6.153,68 | ||||
| 2026-02-17 | 13F | Public Employees Retirement System Of Ohio | 5.265 | -19,58 | 181 | -5,24 | ||||
| 2026-02-17 | 13F | Citadel Advisors Llc | Put | 146.400 | -10,51 | 5.045 | 5,24 | |||
| 2026-02-11 | 13F | Franklin Resources Inc | 52.080 | 3,34 | 1.795 | 21,54 | ||||
| 2026-02-17 | 13F | Citadel Advisors Llc | Call | 228.300 | -16,37 | 7.867 | -1,64 | |||
| 2026-04-20 | 13F | State of Alaska, Department of Revenue | 67.051 | -2,62 | 3 | 50,00 | ||||
| 2026-02-17 | 13F | OCO Capital Partners, L.P. | 5.950.000 | -0,83 | 205.037 | 16,63 | ||||
| 2025-11-13 | 13F | Renaissance Technologies Llc | 0 | -100,00 | 0 | -100,00 | ||||
| 2026-01-29 | 13F | Camelot Portfolios, LLC | Call | 3.000 | -50,00 | 90 | -32,33 | |||
| 2026-01-26 | 13F | AE Wealth Management LLC | 12.497 | -4,62 | 431 | 12,27 | ||||
| 2026-02-17 | 13F | Aristeia Capital Llc | 16.802 | 579 | ||||||
| 2026-02-18 | 13F/A | Virtue Capital Management, LLC | 5.598 | 211 | ||||||
| 2026-02-17 | 13F | Dark Forest Capital Management Lp | 0 | -100,00 | 0 | |||||
| 2026-02-17 | 13F | Tudor Investment Corp Et Al | Call | 123.200 | 792,75 | 4.245 | 950,74 | |||
| 2026-02-17 | 13F | Magnetar Financial LLC | 0 | -100,00 | 0 | |||||
| 2026-01-29 | 13F | Dunhill Financial, LLC | 2 | 0 | ||||||
| 2026-04-15 | 13F | Bayforest Capital Ltd | 3.763 | -70,17 | 172 | -60,37 | ||||
| 2026-04-22 | 13F | Sterling Capital Management LLC | 13.467 | -50,72 | 617 | -34,54 | ||||
| 2026-02-12 | 13F | Counterpoint Mutual Funds LLC | 0 | -100,00 | 0 | |||||
| 2026-02-12 | 13F | South Dakota Investment Council | 174.504 | -17,88 | 6 | 0,00 | ||||
| 2025-11-14 | 13F | Sculptor Capital LP | 0 | -100,00 | 0 | -100,00 | ||||
| 2026-02-13 | 13F | MAI Capital Management | 100 | 0,00 | 3 | 50,00 | ||||
| 2026-02-13 | 13F | Natixis | 19.706 | 1.870,60 | 679 | 2.241,38 | ||||
| 2026-02-10 | 13F | Bank of New York Mellon Corp | 837.459 | 4,17 | 28.859 | 22,52 | ||||
| 2026-02-11 | 13F | Parallel Advisors, LLC | 120 | -29,41 | 4 | 0,00 | ||||
| 2026-02-17 | 13F | Summit Trail Advisors, Llc | 29.349 | -33,02 | 1.011 | -21,20 | ||||
| 2026-02-18 | 13F | Vident Advisory, LLC | 16.716 | 23,17 | 576 | 45,09 | ||||
| 2026-02-10 | 13F | Intech Investment Management Llc | 143.577 | -34,52 | 4.948 | -22,99 | ||||
| 2025-11-13 | 13F | Capital Fund Management S.a. | 0 | -100,00 | 0 | -100,00 | ||||
| 2026-04-16 | 13F | SG Americas Securities, LLC | 98.826 | -15,55 | 5 | 0,00 | ||||
| 2026-01-14 | 13F | ORG Partners LLC | 40 | 100,00 | 1 | |||||
| 2026-02-17 | 13F | Tudor Investment Corp Et Al | Put | 34.200 | -31,74 | 1.179 | -19,70 | |||
| 2026-04-10 | 13F | Abound Wealth Management | 1.294 | 0,00 | 59 | 34,09 | ||||
| 2026-01-28 | 13F | Teacher Retirement System Of Texas | 0 | -100,00 | 0 | |||||
| 2026-02-13 | 13F | Umb Bank N A/mo | 710 | 65,50 | 24 | 100,00 | ||||
| 2026-02-17 | 13F | Algert Global Llc | 117.278 | 130,09 | 4 | 300,00 | ||||
| 2026-02-13 | 13F | Verition Fund Management LLC | 77.365 | 35,08 | 2.666 | 58,82 | ||||
| 2026-02-13 | 13F | Hudson Bay Capital Management LP | 50.000 | -80,00 | 1.723 | -76,48 | ||||
| 2026-02-09 | 13F | Huntington National Bank | 1 | -95,65 | 0 | |||||
| 2026-02-11 | 13F | Capital Analysts, Inc. | 338 | 0,00 | 0 | |||||
| 2026-02-13 | 13F | Walleye Trading LLC | Put | 8.900 | -63,37 | 307 | -56,96 | |||
| 2026-02-13 | 13F | Walleye Trading LLC | Call | 86.200 | 201,40 | 2.970 | 254,84 | |||
| 2026-04-07 | 13F | Farther Finance Advisors, LLC | 1.001 | 41,18 | 45 | 87,50 | ||||
| 2026-02-12 | 13F | Financial Engines Advisors L.L.C. | 122.977 | -35,32 | 4.238 | -23,95 | ||||
| 2026-01-30 | 13F | State of New Jersey Common Pension Fund D | 61.153 | 2.107 | ||||||
| 2026-02-12 | 13F | Cibc World Markets Corp | 8.180 | -41,46 | 282 | 37,75 | ||||
| 2026-02-11 | 13F | LPL Financial LLC | 180.828 | 12,98 | 6.231 | 32,89 | ||||
| 2026-02-17 | 13F | Yiheng Capital Management, L.P. | Put | 455.600 | -38,06 | 15.700 | -27,15 | |||
| 2026-02-18 | 13F/A | Fuller & Thaler Asset Management, Inc. | 2.726.200 | 9,37 | 93.945 | 28,63 | ||||
| 2026-01-28 | 13F | Universal- Beteiligungs- und Servicegesellschaft mbH | 11.138 | 23,51 | 385 | 45,83 | ||||
| 2026-02-06 | 13F | Larson Financial Group LLC | 129 | -94,25 | 4 | -93,85 | ||||
| 2026-04-24 | 13F | Cannon Advisors, Inc. | 4.550 | 208 | ||||||
| 2026-02-06 | 13F | FourThought Financial Partners, LLC | 10.314 | 355 | ||||||
| 2026-02-18 | 13F | GWM Advisors LLC | 500 | -50,00 | 17 | -41,38 | ||||
| 2026-04-13 | 13F | Wolff Wiese Magana Llc | 50 | 0,00 | 2 | 100,00 | ||||
| 2026-02-11 | 13F | Erste Asset Management GmbH | 38.013 | 1.318 | ||||||
| 2026-02-13 | 13F | Quarry LP | 0 | -100,00 | 0 | |||||
| 2026-02-17 | 13F | Mercer Global Advisors Inc /adv | 199.725 | -3,94 | 6.883 | 12,99 | ||||
| 2026-02-17 | 13F | Captrust Financial Advisors | 31.658 | 1,94 | 1.091 | 19,91 | ||||
| 2026-04-20 | 13F | Louisiana State Employees Retirement System | 60.200 | -2,90 | 2.757 | 29,07 | ||||
| 2026-02-10 | 13F | Savant Capital, LLC | 0 | -100,00 | 0 | |||||
| 2025-11-14 | 13F | Mount Yale Investment Advisors, LLC | 0 | -100,00 | 0 | -100,00 | ||||
| 2026-02-13 | 13F | Ieq Capital, Llc | 89.848 | -3,90 | 3.096 | 13,03 | ||||
| 2026-04-23 | 13F | SJS Investment Consulting Inc. | 145 | 1.971,43 | 7 | |||||
| 2026-02-04 | 13F | Virginia Retirement Systems Et Al | 32.100 | -29,30 | 1.106 | -16,84 | ||||
| 2025-11-13 | 13F | Quadrature Capital Ltd | 0 | -100,00 | 0 | -100,00 | ||||
| 2025-11-14 | 13F | Graham Capital Management, L.P. | 0 | -100,00 | 0 | |||||
| 2026-02-05 | 13F | Allworth Financial LP | 684 | 57,97 | 24 | 91,67 | ||||
| 2026-02-13 | 13F | Squarepoint Ops LLC | Call | 12.100 | -87,97 | 417 | -85,88 | |||
| 2025-11-14 | 13F | Cubist Systematic Strategies, LLC | Put | 8.600 | 252 | |||||
| 2026-02-13 | 13F | Squarepoint Ops LLC | Put | 12.500 | 0,00 | 431 | 17,49 | |||
| 2025-11-14 | 13F | Cubist Systematic Strategies, LLC | Call | 10.200 | -81,01 | 299 | -61,99 | |||
| 2026-04-10 | 13F | Intellectus Partners, LLC | 0 | -100,00 | 0 | |||||
| 2026-01-26 | 13F | Cwm, Llc | 19.360 | 1,84 | 1 | |||||
| 2026-02-17 | 13F | D. E. Shaw & Co., Inc. | Call | 156.800 | 0,00 | 5.403 | 17,61 | |||
| 2026-02-17 | 13F | D. E. Shaw & Co., Inc. | 227.607 | -65,47 | 7.843 | -59,39 | ||||
| 2026-02-17 | 13F | D. E. Shaw & Co., Inc. | Put | 60.100 | -14,63 | 2.071 | 0,44 | |||
| 2026-02-11 | 13F | Simplex Trading, Llc | Call | 86.300 | -22,74 | 2.974 | 99.000,00 | |||
| 2026-02-11 | 13F | Simplex Trading, Llc | Put | 170.200 | -20,39 | 5.865 | 97.650,00 | |||
| 2025-11-14 | 13F | Wolverine Trading, Llc | 26.987 | -9,18 | 767 | 76,91 | ||||
| 2026-02-11 | 13F | Simplex Trading, Llc | 62.568 | 55,35 | 2.156 | 215.500,00 | ||||
| 2026-02-13 | 13F | Manufacturers Life Insurance Company, The | 0 | -100,00 | 0 | |||||
| 2025-11-14 | 13F | Wolverine Trading, Llc | Call | 116.800 | 11,13 | 3.318 | 116,30 | |||
| 2025-11-14 | 13F | Wolverine Trading, Llc | Put | 89.600 | 70,67 | 2.546 | 232,25 | |||
| 2026-02-13 | 13F | Smartleaf Asset Management LLC | 49 | 2 | ||||||
| 2026-02-17 | 13F | Odyssean, LLC | 13.137 | 453 | ||||||
| 2026-02-10 | 13F | Mutual Of America Capital Management Llc | 15.460 | 2,79 | 533 | 20,91 | ||||
| 2026-02-17 | 13F | Northern Trust Corp | 1.297.581 | -1,64 | 44.715 | 15,68 | ||||
| 2026-04-08 | 13F | Wealth Enhancement Advisory Services, Llc | 19.798 | 29,93 | 1.063 | 60,42 | ||||
| 2026-02-11 | 13F | Picton Mahoney Asset Management | 176.834 | 19,77 | 6.094 | 152.225,00 | ||||
| 2026-02-17 | 13F | Bank Of America Corp /de/ | 1.810.234 | 4,84 | 62.381 | 23,30 | ||||
| 2026-02-04 | 13F | Versor Investments LP | 6.935 | 239 | ||||||
| 2025-11-13 | 13F | Baupost Group Llc/ma | 0 | -100,00 | 0 | -100,00 | ||||
| 2026-01-30 | 13F | Us Bancorp \de\ | 839 | -82,44 | 29 | -80,00 | ||||
| 2026-02-10 | 13F | Private Wealth Asset Management, LLC | 419 | 0,00 | 14 | 16,67 | ||||
| 2026-02-06 | 13F | Bare Financial Services, Inc | 42 | 1 | ||||||
| 2026-04-14 | 13F | Corecam Pte. Ltd. | 5.815 | 266 | ||||||
| 2026-02-09 | 13F | Hartland & Co., LLC | 38 | -91,12 | 1 | -91,67 | ||||
| 2026-01-29 | 13F | Teachers Retirement System Of The State Of Kentucky | 32.754 | 36,29 | 1 | |||||
| 2026-02-13 | 13F | Integrated Wealth Concepts LLC | 0 | -100,00 | 0 | |||||
| 2026-02-17 | 13F | Voleon Capital Management Lp | 0 | -100,00 | 0 | |||||
| 2026-02-17 | 13F | Mangrove Partners | 6.158 | 212 | ||||||
| 2026-02-17 | 13F | National Asset Management, Inc. | 6.200 | 214 | ||||||
| 2026-04-07 | 13F | CoreCap Advisors, LLC | 700 | 0,00 | 32 | 33,33 | ||||
| 2026-01-29 | 13F | IMC-Chicago, LLC | Put | 158.500 | 142,35 | 5.462 | 185,02 | |||
| 2026-02-17 | 13F | Cobalt Capital Management, Inc. | 100.000 | 3.446 | ||||||
| 2026-01-29 | 13F | IMC-Chicago, LLC | Call | 283.400 | 57,18 | 9.766 | 84,87 | |||
| 2026-04-22 | 13F | Pictet Asset Management Holding SA | 18.660 | 11,60 | 855 | 48,26 | ||||
| 2026-02-17 | 13F | Quantinno Capital Management LP | 136.709 | 9,05 | 4.711 | 28,23 | ||||
| 2026-04-14 | 13F | Zrc Wealth Management, Llc | 34 | 2 | ||||||
| 2026-04-24 | 13F | Strs Ohio | 11.200 | -27,27 | 513 | -3,40 | ||||
| 2026-02-13 | 13F | Parkside Financial Bank & Trust | 182 | 42,19 | 6 | 100,00 | ||||
| 2026-02-17 | 13F | California State Teachers Retirement System | 108.777 | 10,11 | 3.748 | 29,51 | ||||
| 2026-02-10 | 13F | Commonwealth Of Pennsylvania Public School Empls Retrmt Sys | 210.688 | 3,71 | 7.260 | 21,98 | ||||
| 2026-02-17 | 13F | Susquehanna International Group, Llp | Call | 342.100 | -24,95 | 11.789 | -11,73 | |||
| 2026-02-10 | 13F | Thoroughbred Financial Services, Llc | 9.571 | 0 | ||||||
| 2026-04-15 | 13F | Exchange Traded Concepts, Llc | 11.597 | 531 | ||||||
| 2026-04-16 | 13F | Diversified Trust Co | 23.051 | 11,87 | 1.056 | 48,59 | ||||
| 2026-02-13 | 13F | Sei Investments Co | 84.026 | -13,53 | 2.896 | 1,69 | ||||
| 2026-04-21 | 13F | Hennessy Advisors Inc | 1.204.700 | -9,46 | 55.175 | 20,33 | ||||
| 2026-02-13 | 13F | Needham Investment Management Llc | 330.600 | -6,90 | 11.392 | 9,50 | ||||
| 2026-02-17 | 13F | Susquehanna International Group, Llp | 87.051 | 3.000 | ||||||
| 2026-02-17 | 13F | Alliancebernstein L.p. | 144.500 | 10,14 | 4.979 | 29,56 | ||||
| 2026-02-17 | 13F | Susquehanna International Group, Llp | Put | 259.800 | -24,52 | 8.953 | -11,23 | |||
| 2026-02-13 | 13F | Charles Schwab Investment Management Inc | 2.431.726 | -12,78 | 83.797 | 2,59 | ||||
| 2026-02-17 | 13F | Two Sigma Securities, Llc | 14.414 | 12,01 | 497 | 31,56 | ||||
| 2026-02-13 | 13F | Ubs Asset Management Americas Inc | 261.434 | 1,19 | 9.009 | 19,01 | ||||
| 2026-02-09 | 13F | Legal & General Group Plc | 530.859 | 0,49 | 18.293 | 18,19 | ||||
| 2026-02-12 | 13F | Dimensional Fund Advisors Lp | 4.050.883 | 22,49 | 139.601 | 44,08 | ||||
| 2026-02-03 | 13F | NewEdge Wealth, LLC | 6.494 | 3,19 | 224 | -6,30 | ||||
| 2026-02-10 | 13F | Acadian Asset Management Llc | 23.226 | 1.806,90 | 1 | |||||
| 2026-04-16 | 13F | Thompson Davis & Co., Inc. | 5.250 | 4.100,00 | 240 | 2.900,00 | ||||
| 2026-01-29 | 13F | Simon Quick Advisors, Llc | 12.285 | 13,47 | 423 | 33,44 | ||||
| 2026-02-26 | 13F | TD Capital Management LLC | 9 | 0 | ||||||
| 2026-02-12 | 13F | Nuveen, LLC | 3.116.236 | -14,86 | 107.385 | 0,13 | ||||
| 2026-02-17 | 13F | Voloridge Investment Management, Llc | 0 | -100,00 | 0 | |||||
| 2026-02-13 | 13F | American Century Companies Inc | 4.631.225 | 24,71 | 159.592 | 46,67 | ||||
| 2026-02-17 | 13F | Equitable Holdings, Inc. | 27.701 | 2,54 | 955 | 20,61 | ||||
| 2026-02-11 | 13F | 111 Capital | 0 | -100,00 | 0 | -100,00 | ||||
| 2026-02-10 | 13F | Goldman Sachs Group Inc | 2.100.964 | -7,93 | 72.399 | 8,29 | ||||
| 2026-02-13 | 13F | Toroso Investments, LLC | 11.693 | -8,11 | 403 | 8,06 | ||||
| 2026-02-04 | 13F | Oregon Public Employees Retirement Fund | 30.965 | 2,31 | 1.067 | 20,43 | ||||
| 2026-02-19 | 13F | CI Private Wealth, LLC | 8.039 | 277 | ||||||
| 2026-02-06 | 13F | Legato Capital Management LLC | 16.480 | 568 | ||||||
| 2026-02-11 | 13F | Jpmorgan Chase & Co | 442.802 | -2,05 | 15.259 | 15,20 | ||||
| 2026-02-17 | 13F | Canada Pension Plan Investment Board | 5.900 | -99,88 | 203 | -99,86 | ||||
| 2025-11-14 | 13F | Cubist Systematic Strategies, LLC | 0 | -100,00 | 0 | -100,00 | ||||
| 2026-02-13 | 13F | Arrowstreet Capital, Limited Partnership | 0 | -100,00 | 0 | |||||
| 2026-02-11 | 13F | Cedar Mountain Advisors, LLC | 17 | 13,33 | 1 | |||||
| 2026-02-13 | 13F | Victory Capital Management Inc | 80.165 | 318,73 | 2.762 | 393,21 | ||||
| 2026-02-17 | 13F | MIRAE ASSET GLOBAL ETFS HOLDINGS Ltd. | 57.435 | 4,84 | 1.979 | 23,30 | ||||
| 2026-04-22 | 13F | Pinnacle Bancorp, Inc. | 420 | 0,00 | 19 | 35,71 | ||||
| 2026-02-17 | 13F | Lodge Hill Capital, LLC | 725.000 | -14,71 | 24.984 | 0,31 | ||||
| 2026-02-09 | 13F | Hantz Financial Services, Inc. | 1.071 | 19,13 | 0 | |||||
| 2026-02-17 | 13F | Man Group plc | 344.864 | -26,20 | 11.884 | -13,20 | ||||
| 2026-04-22 | 13F | Continuum Advisory, LLC | 18.985 | 0,00 | 870 | 32,87 | ||||
| 2026-02-13 | 13F | SRS Capital Advisors, Inc. | 1.115 | -93,11 | 38 | -91,97 | ||||
| 2026-02-17 | 13F | EFG International AG | 1.200 | 41 | ||||||
| 2026-04-17 | 13F | Hanson & Doremus Investment Management | 1.681 | -23,28 | 0 | |||||
| 2026-02-11 | 13F | Ameritas Investment Partners, Inc. | 10.209 | 352 | ||||||
| 2026-03-06 | 13F | Hsbc Holdings Plc | 16.799 | 583 | ||||||
| 2026-02-11 | 13F | Los Angeles Capital Management Llc | 1.110 | 43 | ||||||
| 2026-02-05 | 13F | Gabelli Funds Llc | 41.800 | 254,24 | 1.440 | 317,39 | ||||
| 2026-02-17 | 13F | Harvest Investment Services, LLC | 119.863 | 303,77 | 4.130 | 375,26 | ||||
| 2026-04-20 | 13F | Ronald Blue Trust, Inc. | 1 | 0,00 | 0 | |||||
| 2026-02-17 | 13F | Maryland State Retirement & Pension System | 19.753 | 2,34 | 681 | 20,35 | ||||
| 2026-02-12 | 13F | Empower Advisory Group, LLC | 9.153 | 18,30 | 315 | 39,38 | ||||
| 2026-02-17 | 13F | Bank Of America Corp /de/ | Call | 0 | -100,00 | 0 | ||||
| 2026-02-17 | 13F | Point72 Asset Management, L.P. | Call | 15.400 | 531 | |||||
| 2025-11-13 | 13F | Jump Financial, LLC | 0 | -100,00 | 0 | -100,00 | ||||
| 2026-02-13 | 13F | National Bank Of Canada /fi/ | 151 | 5 | ||||||
| 2026-02-17 | 13F | Point72 Asset Management, L.P. | Put | 20.900 | 720 | |||||
| 2026-02-02 | 13F | Fifth Third Bancorp | 923 | 13,53 | 32 | 34,78 | ||||
| 2026-02-12 | 13F | Steward Partners Investment Advisory, Llc | 1.360 | 8,80 | 47 | 27,78 | ||||
| 2026-04-23 | 13F | Forum Financial Management, LP | 0 | -100,00 | 0 | |||||
| 2026-01-27 | 13F | Zurcher Kantonalbank (Zurich Cantonalbank) | 34.764 | 60,83 | 1.198 | 89,10 | ||||
| 2026-02-11 | 13F | Cerity Partners LLC | 0 | -100,00 | 0 | |||||
| 2026-02-17 | 13F | Advisor Group Holdings, Inc. | 33.099 | 1,22 | 1.141 | 10,14 | ||||
| 2026-02-18 | 13F | Caitlin John, LLC | 16.207 | -0,33 | 558 | 17,23 | ||||
| 2026-02-10 | 13F | Florida Financial Advisors, Llc | 20.156 | 694 | ||||||
| 2026-02-17 | 13F | Mirabella Financial Services Llp | 8.031 | 277 | ||||||
| 2026-01-07 | 13F | Harbour Capital Advisors, LLC | 10.005 | 376 | ||||||
| 2026-02-04 | 13F | Tsfg, Llc | 1.127 | 0,00 | 0 | |||||
| 2026-04-13 | 13F | Massmutual Trust Co Fsb/adv | 108 | 0,00 | 5 | 33,33 | ||||
| 2026-02-17 | 13F | Caption Management, LLC | Put | 567.200 | -54,55 | 19.546 | -46,54 | |||
| 2026-02-17 | 13F | Caption Management, LLC | Call | 117.800 | 17,80 | 4.059 | 38,53 | |||
| 2026-02-02 | 13F | Wolverine Asset Management Llc | Call | 38.800 | 0,00 | 1.337 | 17,69 | |||
| 2026-02-17 | 13F | Point72 Asset Management, L.P. | 266.173 | 9.172 | ||||||
| 2026-02-17 | 13F | Caption Management, LLC | 603.623 | -31,49 | 20.801 | -19,43 | ||||
| 2026-02-17 | 13F | PDT Partners, LLC | 206.101 | -58,44 | 7.102 | -51,13 | ||||
| 2026-02-17 | 13F | Russell Investments Group, Ltd. | 14.563 | 43,93 | 502 | 69,26 | ||||
| 2026-04-10 | 13F | Pure Financial Advisors, Inc. | 7.740 | 354 | ||||||
| 2026-02-17 | 13F | Gotham Asset Management, LLC | 51.581 | -24,15 | 1.777 | -10,79 | ||||
| 2026-02-11 | 13F | Pacific Wealth Management | 8.150 | -4,40 | 281 | 12,45 | ||||
| 2025-11-14 | 13F | Corton Capital Inc. | 13.747 | -55,53 | 403 | -10,86 | ||||
| 2026-01-29 | 13F | Camelot Portfolios, LLC | 0 | -100,00 | 0 | -100,00 | ||||
| 2026-02-13 | 13F/A | Ontario Teachers Pension Plan Board | 0 | -100,00 | 0 | |||||
| 2026-01-26 | 13F | KBC Group NV | 3.398 | 0,00 | 0 | |||||
| 2026-02-11 | 13F | Fox Run Management, L.l.c. | 16.294 | 561 | ||||||
| 2026-02-12 | 13F | Integrated Quantitative Investments LLC | 55.943 | 47,63 | 1.928 | 73,60 | ||||
| 2026-02-13 | 13F | Stifel Financial Corp | 7.436 | 256 | ||||||
| 2025-11-12 | 13F | Quantbot Technologies LP | 0 | -100,00 | 0 | -100,00 | ||||
| 2026-02-10 | 13F | Rothschild Investment Llc | 187 | 1,08 | 6 | 20,00 | ||||
| 2026-04-23 | 13F | CWM Advisors, LLC | 45.463 | 232,94 | 2.082 | 342,98 | ||||
| 2026-02-17 | 13F | Disciplined Growth Investors Inc /mn | 5.925.770 | 3,49 | 204.202 | 21,72 | ||||
| 2026-02-17 | 13F | Two Sigma Investments, Lp | 302.011 | -51,96 | 10.407 | -43,50 | ||||
| 2026-02-10 | 13F | Godfrey Financial Associates, Inc. | 5 | 0 | ||||||
| 2026-02-13 | 13F | Prudential Financial Inc | 150.040 | -6,55 | 5.170 | 9,91 | ||||
| 2026-02-12 | 13F | Swiss National Bank | 225.024 | 11,38 | 7.754 | 31,00 | ||||
| 2025-11-14 | 13F | Texas Permanent School Fund | 0 | -100,00 | 0 | -100,00 | ||||
| 2026-01-12 | 13F | VisionPoint Advisory Group, LLC | 15.729 | -1,80 | 542 | 15,57 | ||||
| 2026-02-13 | 13F | Baird Financial Group, Inc. | 0 | -100,00 | 0 | |||||
| 2026-02-03 | 13F | SBI Securities Co., Ltd. | 1.045 | 19,57 | 36 | 44,00 | ||||
| 2026-02-05 | 13F | Amalgamated Bank | 38.676 | 1,45 | 1 | 0,00 | ||||
| 2026-02-09 | 13F | Annis Gardner Whiting Capital Advisors, LLC | 39 | 69,57 | 1 | |||||
| 2026-02-10 | 13F | Envestnet Asset Management Inc | 34.290 | 2,82 | 1.182 | 20,88 | ||||
| 2026-02-12 | 13F | Helium Advisors LLC | 30.535 | -2,26 | 1.052 | 14,97 | ||||
| 2026-04-21 | 13F | Vise Technologies, Inc. | 7.446 | 0,00 | 257 | 0,00 | ||||
| 2026-04-03 | 13F | Hickory Point Bank & Trust | 35 | 2 | ||||||
| 2026-02-09 | 13F | Harbour Investments, Inc. | 3 | 0 | ||||||
| 2025-10-30 | 13F | Twin Peaks Wealth Advisors, LLC | 0 | -100,00 | 0 | |||||
| 2026-02-17 | 13F | Nomura Holdings Inc | Call | 150.000 | 5.169 | |||||
| 2026-02-17 | 13F | Nomura Holdings Inc | Put | 100.000 | 3.446 | |||||
| 2025-11-13 | 13F | Barrow Hanley Mewhinney & Strauss Llc | 0 | -100,00 | 0 | |||||
| 2026-02-17 | 13F | Nomura Holdings Inc | 25.892 | -54,45 | 892 | -46,43 | ||||
| 2026-04-16 | 13F | Toth Financial Advisory Corp | 100 | 0,00 | 5 | 33,33 | ||||
| 2026-02-10 | 13F | CIBC Asset Management Inc | 6.025 | -51,64 | 208 | -43,29 | ||||
| 2026-02-11 | 13F | IMA Wealth, Inc. | 29.054 | -5,27 | 1.001 | 11,47 | ||||
| 2026-02-17 | 13F | Advisory Services Network, LLC | 0 | -100,00 | 0 | |||||
| 2026-02-12 | 13F | CIBC Private Wealth Group, LLC | 32 | 1 | ||||||
| 2026-01-29 | 13F | Lee Danner & Bass Inc | 254.500 | -8,62 | 8.770 | 7,48 | ||||
| 2026-01-14 | 13F | Spire Wealth Management | 0 | -100,00 | 0 | |||||
| 2026-01-21 | 13F | Sound Income Strategies, LLC | 174 | 8 | ||||||
| 2026-02-17 | 13F | 13D Management LLC | 201.750 | -24,44 | 6.952 | -11,13 | ||||
| 2026-02-11 | 13F | Deutsche Bank Ag\ | 1.167.574 | 4,58 | 40.235 | 23,00 | ||||
| 2026-02-13 | 13F | State Street Corp | 5.499.653 | -5,35 | 189.518 | 11,31 | ||||
| 2026-02-13 | 13F | Towarzystwo Funduszy Inwestycyjnych Pzu Sa | 0 | -100,00 | 0 | |||||
| 2026-02-13 | 13F | Kestra Advisory Services, LLC | 0 | -100,00 | 0 | |||||
| 2026-02-20 | 13F/A | Prestige Wealth Management Group LLC | 0 | -100,00 | 0 | |||||
| 2026-01-29 | 13F | UBS Group AG | 833.773 | -26,31 | 28.732 | -13,34 | ||||
| 2026-02-11 | 13F | Harvest Fund Management Co., Ltd | 9.946 | 0 | ||||||
| 2026-04-06 | 13F | GAMMA Investing LLC | 3.172 | 10,68 | 145 | 47,96 | ||||
| 2026-02-06 | 13F | Leonteq Securities AG | 14.845 | 4,50 | 512 | 22,84 | ||||
| 2026-02-13 | 13F | Dynamic Technology Lab Private Ltd | 6.963 | 240 | ||||||
| 2026-02-03 | 13F | Pilgrim Partners Asia Pte Ltd | 1.050 | 36 | ||||||
| 2026-02-11 | 13F | Illinois Municipal Retirement Fund | 67.056 | 2.311 | ||||||
| 2026-02-10 | 13F | Natixis Advisors, L.p. | 22.257 | 40,57 | 1 | |||||
| 2026-02-13 | 13F | C M Bidwell & Associates Ltd | 40 | -25,93 | 1 | 0,00 | ||||
| 2026-02-17 | 13F | Susquehanna Portfolio Strategies, LLC | 108.101 | 0,00 | 3.725 | 17,62 | ||||
| 2026-02-12 | 13F | Bank Of Montreal /can/ | 8.074 | -0,44 | 278 | 17,30 | ||||
| 2026-02-02 | 13F | Hussman Strategic Advisors, Inc. | 84.000 | 100,00 | 2.895 | 135,28 | ||||
| 2026-02-09 | 13F | Keating Financial Advisory Services, Inc. | 36 | 1 | ||||||
| 2026-02-12 | 13F | Penserra Capital Management LLC | 558.796 | 8,40 | 19 | 26,67 | ||||
| 2026-02-17 | 13F | Steinberg Asset Management Llc | 85.852 | -1,40 | 2.958 | 15,95 | ||||
| 2026-04-22 | 13F | Qp Wealth Management, Llc | 7.917 | 363 | ||||||
| 2025-11-13 | 13F | Jefferies Financial Group Inc. | Call | 0 | -100,00 | 0 | -100,00 | |||
| 2026-04-21 | 13F | Gilpin Wealth Management, Llc | 19 | 90,00 | 1 | |||||
| 2026-02-09 | 13F | Quest Partners LLC | 8.728 | -2,17 | 301 | 14,94 | ||||
| 2026-04-07 | 13F | Signaturefd, Llc | 461 | -9,43 | 21 | 23,53 | ||||
| 2026-02-13 | 13F | Mariner, LLC | 106.397 | 1,02 | 3.668 | 18,83 | ||||
| 2026-02-17 | 13F | Miller Capital Partners, Inc. | 25 | 1 | ||||||
| 2026-02-06 | 13F | ProShare Advisors LLC | 24.161 | 7,40 | 833 | 26,25 | ||||
| 2026-02-10 | 13F | Nomura Asset Management Co Ltd | 6.700 | 0,00 | 231 | 17,35 | ||||
| 2026-02-04 | 13F | Argos Wealth Advisors, LLC | 16.884 | 582 | ||||||
| 2026-04-24 | 13F | IFM Investors Pty Ltd | 7.616 | 349 | ||||||
| 2026-02-17 | 13F | Jones Financial Companies Lllp | 1.308 | 20,89 | 45 | 45,16 | ||||
| 2025-11-14 | 13F | ExodusPoint Capital Management, LP | 0 | -100,00 | 0 | -100,00 | ||||
| 2026-02-17 | 13F | Susquehanna Fundamental Investments, Llc | 149.444 | -11,70 | 5.150 | 3,85 | ||||
| 2025-11-04 | 13F | Westside Investment Management, Inc. | 0 | -100,00 | 0 | |||||
| 2026-02-13 | 13F | Financial Sense Advisors, Inc. | 13.110 | 19,18 | 452 | 40,06 | ||||
| 2026-01-29 | 13F | Comerica Bank | 94.184 | 16,81 | 3.246 | 37,38 | ||||
| 2026-01-28 | 13F | Legacy Capital Group California, Inc. | 42.103 | -0,59 | 1.451 | 16,94 | ||||
| 2026-02-12 | 13F | Triumph Capital Management | 33 | 1 |