Grundlæggende statistik
| Institutionelle aktier (lange) | 101.835.460 - 95,80% (ex 13D/G) - change of -22,22MM shares -17,93% MRQ |
| Institutionel værdi (lang) | $ 4.141.381 USD ($1000) |
Institutionelt ejerskab og aktionærer
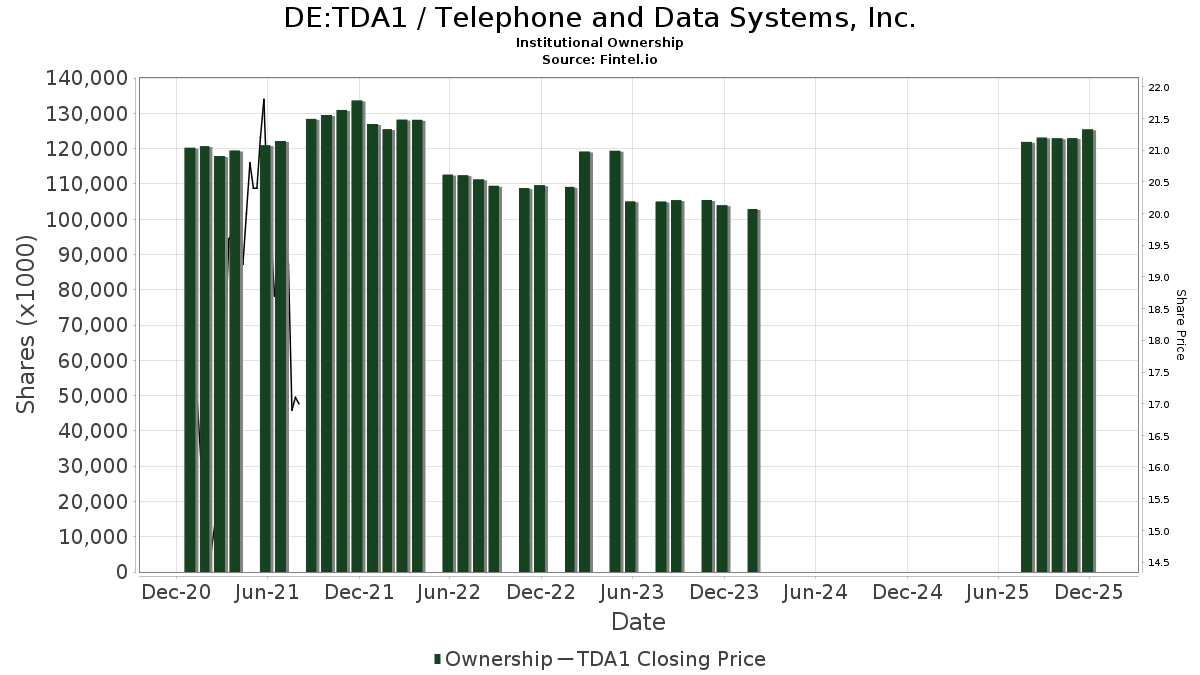
Telephone and Data Systems, Inc. (DE:TDA1) har 352 institutionelle ejere og aktionærer, der har indsendt 13D/G- eller 13F-formularer til Securities Exchange Commission (SEC). Disse institutioner har i alt 101,835,460 aktier. Største aktionærer omfatter BlackRock, Inc., Vanguard Group Inc, Third Point LLC, Dimensional Fund Advisors Lp, Carronade Capital Management, LP, State Street Corp, Oaktree Capital Management Lp, American Century Companies Inc, Geode Capital Management, Llc, and Goldman Sachs Group Inc .
Telephone and Data Systems, Inc. (DB:TDA1) institutionel ejerskabsstruktur viser aktuelle positioner i virksomheden efter institutioner og fonde, samt seneste ændringer i positionsstørrelse. Større aktionærer kan omfatte individuelle investorer, investeringsforeninger, hedgefonde eller institutioner. Skema 13D angiver, at investoren besidder (eller besidder) mere end 5 % af virksomheden og har til hensigt (eller har til hensigt at) aktivt at forfølge en ændring i forretningsstrategi. Skema 13G indikerer en passiv investering på over 5%.
Fondens stemningsscore
Fund Sentiment Score (fka Ownership Accumulation Score) finder de aktier, der bliver mest købt af fonde. Det er resultatet af en sofistikeret, multi-faktor kvantitativ model, der identificerer virksomheder med de højeste niveauer af institutionel akkumulering. Scoringsmodellen bruger en kombination af den samlede stigning i oplyste ejere, ændringerne i porteføljeallokeringer i disse ejere og andre målinger. Tallet går fra 0 til 100, hvor højere tal indikerer et højere niveau af akkumulering for sine jævnaldrende, og 50 er gennemsnittet.
Opdateringsfrekvens: Dagligt
Se Ownership Explorer, som giver en liste over højest rangerende virksomheder.
AI+ Ask Fintel’s AI assistant about Telephone and Data Systems, Inc..
Select a question to share a public post with an AI-crafted answer.
Thinking of good questions…
13F og NPORT arkivering
Detaljer om 13F-arkivering er gratis. Detaljer om NP-ansøgninger kræver et premium-medlemskab. Grønne rækker angiver nye positioner. Røde rækker angiver lukkede positioner. Klik på linket ikon for at se den fulde transaktionshistorik.
Opgrader
for at låse premium-data op og eksportere til Excel ![]() .
.
| Fil dato | Kilde | Investor | Type | Gennemsnitlig pris (Øst) |
Aktier | Δ Aktier (%) |
Rapporteret Værdi ($1000) |
Δ Værdi (%) |
Port Alloc (%) |
|
|---|---|---|---|---|---|---|---|---|---|---|
| 2026-02-17 | 13F | Governors Lane LP | 72.777 | -4,13 | 2.984 | 0,17 | ||||
| 2026-04-24 | 13F | Root Financial Partners, LLC | 377 | 14,94 | 16 | 15,38 | ||||
| 2026-02-17 | 13F | Diameter Capital Partners LP | 1.067.297 | 4,13 | 43.759 | 8,80 | ||||
| 2026-02-13 | 13F | Hudson Bay Capital Management LP | 750.000 | 0,00 | 30.750 | 4,49 | ||||
| 2026-04-17 | 13F | Brown, Lisle/cummings, Inc. | 56 | 2 | ||||||
| 2026-04-28 | 13F | Hoey Investments, Inc | 1.668 | 0,00 | 70 | 2,94 | ||||
| 2026-02-17 | 13F | Jain Global LLC | 139.634 | 47,73 | 5.725 | 54,37 | ||||
| 2026-04-20 | 13F | State of Alaska, Department of Revenue | 52.117 | -2,85 | 2 | 0,00 | ||||
| 2026-02-12 | 13F | Counterpoint Mutual Funds LLC | 0 | -100,00 | 0 | |||||
| 2026-02-10 | 13F | Savant Capital, LLC | 8.811 | 37,39 | 361 | 43,82 | ||||
| 2026-02-17 | 13F | Empyrean Capital Partners, LP | 300.000 | 0,00 | 12.300 | 4,49 | ||||
| 2026-02-17 | 13F | Moore Capital Management, Lp | 0 | -100,00 | 0 | |||||
| 2026-02-17 | 13F | Whitebark Investors LP | 0 | -100,00 | 0 | |||||
| 2026-04-20 | 13F | Louisiana State Employees Retirement System | 43.600 | -3,11 | 1.836 | -0,54 | ||||
| 2026-02-11 | 13F | O'shaughnessy Asset Management, Llc | 9.525 | -8,71 | 391 | -4,65 | ||||
| 2026-02-17 | 13F | Beartown Capital Management, LLC | 75.000 | 3.075 | ||||||
| 2026-04-23 | 13F | Ameliora Wealth Management Ltd. | 2.145 | 90 | ||||||
| 2026-01-16 | 13F | FNY Investment Advisers, LLC | 0 | -100,00 | 0 | |||||
| 2026-02-17 | 13F | XTX Topco Ltd | 22.690 | 142,34 | 930 | 153,41 | ||||
| 2026-02-12 | 13F | Wealthspire Advisors, LLC | 0 | -100,00 | 0 | |||||
| 2026-02-17 | 13F | Oxford Asset Management Llp | 9.625 | -42,53 | 395 | -40,03 | ||||
| 2026-01-23 | 13F | Sumitomo Mitsui Trust Holdings, Inc. | 0 | -100,00 | 0 | -100,00 | ||||
| 2026-02-17 | 13F | Balyasny Asset Management Llc | 69.099 | -77,16 | 2.833 | -76,14 | ||||
| 2026-02-13 | 13F | First Trust Advisors Lp | 127.018 | 36,98 | 5.208 | 43,13 | ||||
| 2026-02-09 | 13F | Jefferies Financial Group Inc. | 40.144 | -9,85 | 1.646 | -5,84 | ||||
| 2026-01-30 | 13F | Mitsubishi UFJ Trust & Banking Corp | 15.944 | 76,20 | 654 | 83,94 | ||||
| 2026-02-12 | 13F | Hrt Financial Lp | 0 | -100,00 | 0 | |||||
| 2026-02-17 | 13F | VR Advisory Services Ltd | 573.005 | 23.493 | ||||||
| 2026-02-17 | 13F | Aquatic Capital Management LLC | 19.468 | -51,59 | 798 | -49,43 | ||||
| 2026-02-10 | 13F | Goldman Sachs Group Inc | Put | 0 | -100,00 | 0 | -100,00 | |||
| 2026-02-18 | 13F | Vident Advisory, LLC | 23.117 | -6,10 | 948 | -1,97 | ||||
| 2026-01-28 | 13F | Universal- Beteiligungs- und Servicegesellschaft mbH | 9.494 | -23,18 | 389 | -19,63 | ||||
| 2026-02-09 | 13F | Geode Capital Management, Llc | 2.415.553 | 2,84 | 99.053 | 7,46 | ||||
| 2025-11-21 | 13F | Forefront Analytics, LLC | 0 | -100,00 | 0 | -100,00 | ||||
| 2026-02-17 | 13F | Nomura Holdings Inc | 0 | -100,00 | 0 | |||||
| 2026-02-12 | 13F | Cibc World Markets Corp | 6.588 | -45,54 | 270 | -37,21 | ||||
| 2026-02-09 | 13F | Royce & Associates Lp | 104.487 | 4.284 | ||||||
| 2026-02-17 | 13F | United Capital Financial Advisers, Llc | 5.372 | -0,37 | 220 | 4,27 | ||||
| 2026-02-13 | 13F | BNP Paribas Asset Management Holding S.A. | 1.375 | 37,78 | 0 | |||||
| 2026-04-16 | 13F | SG Americas Securities, LLC | 12.758 | -67,78 | 1 | -100,00 | ||||
| 2026-04-07 | 13F | Central Pacific Bank - Trust Division | 26.200 | 0,00 | 1.103 | 2,70 | ||||
| 2026-02-17 | 13F | Kemnay Advisory Services Inc. | 269 | 11 | ||||||
| 2026-02-17 | 13F | Oaktree Capital Management Lp | 3.688.386 | 0,00 | 151.224 | 4,48 | ||||
| 2026-02-17 | 13F | Bank Of America Corp /de/ | 336.751 | -35,99 | 13.807 | -33,12 | ||||
| 2026-01-30 | 13F | State of New Jersey Common Pension Fund D | 56.625 | 4,68 | 2.322 | 9,38 | ||||
| 2026-02-13 | 13F | Entropy Technologies, LP | 24.150 | 990 | ||||||
| 2025-11-14 | 13F | Capitolis Liquid Global Markets LLC | 0 | -100,00 | 0 | |||||
| 2026-02-10 | 13F | Mutual Of America Capital Management Llc | 237.108 | -4,52 | 9.721 | -0,24 | ||||
| 2026-02-05 | 13F | HFM Investment Advisors, LLC | 7 | 16,67 | 0 | |||||
| 2026-02-17 | 13F | Aqr Capital Management Llc | 82.618 | 0,67 | 3.387 | 6,21 | ||||
| 2026-02-17 | 13F | Tower Research Capital LLC (TRC) | 5.807 | 5,85 | 238 | 10,70 | ||||
| 2026-04-29 | 13F | Police & Firemen's Retirement System of New Jersey | 27.226 | 3,22 | 1.146 | 6,01 | ||||
| 2026-04-13 | 13F | IFP Advisors, Inc | 11 | 0 | -100,00 | |||||
| 2026-02-11 | 13F | Franklin Resources Inc | 23.695 | 2,85 | 971 | 7,41 | ||||
| 2026-02-10 | 13F | Goldman Sachs Group Inc | 2.254.908 | -21,33 | 92.451 | -17,81 | ||||
| 2026-02-13 | 13F | Neo Ivy Capital Management | 22.696 | 931 | ||||||
| 2026-02-10 | 13F | Goldman Sachs Group Inc | Call | 50.500 | 44,29 | 2.070 | 50,76 | |||
| 2026-01-30 | 13F | Torren Management, LLC | 5.372 | 220 | ||||||
| 2026-02-17 | 13F | Redwood Capital Management, Llc | 876.580 | 0,00 | 35.940 | 4,49 | ||||
| 2025-11-21 | 13F/A | CIBC Bancorp USA Inc. | 10.615 | 417 | ||||||
| 2026-02-10 | 13F | Quantbot Technologies LP | 13.232 | -63,92 | 543 | -62,33 | ||||
| 2026-02-13 | 13F | Public Employees Retirement Association Of Colorado | 11.670 | 0,00 | 0 | |||||
| 2026-04-15 | 13F | Journey Strategic Wealth Llc | 6.165 | 2,17 | 260 | 4,86 | ||||
| 2026-02-02 | 13F | Principal Financial Group Inc | 468.462 | -1,30 | 19.207 | 3,12 | ||||
| 2026-04-27 | 13F | HB Wealth Management, LLC | 5.882 | -0,02 | 248 | 2,49 | ||||
| 2026-02-13 | 13F | Inspire Advisors, LLC | 5.727 | -51,91 | 235 | -49,89 | ||||
| 2026-04-22 | 13F | Sterling Capital Management LLC | 3.311 | -42,79 | 139 | -41,35 | ||||
| 2026-04-23 | 13F | CWM Advisors, LLC | 14.998 | -67,69 | 631 | -66,84 | ||||
| 2026-02-11 | 13F | Vestcor Inc | 150.000 | -16,67 | 6 | -14,29 | ||||
| 2026-02-06 | 13F | Larson Financial Group LLC | 294 | 7,30 | 12 | 20,00 | ||||
| 2026-02-06 | 13F | Bare Financial Services, Inc | 137 | 15,13 | 6 | 25,00 | ||||
| 2026-02-17 | 13F | LMR Partners LLP | 40.000 | -69,58 | 1.640 | -68,21 | ||||
| 2026-02-17 | 13F | Tudor Investment Corp Et Al | Put | 5.700 | -54,03 | 234 | -52,06 | |||
| 2026-02-17 | 13F | Tudor Investment Corp Et Al | Call | 6.200 | -79,40 | 254 | -78,49 | |||
| 2026-02-17 | 13F | Guggenheim Capital Llc | 5.089 | -38,41 | 209 | -35,80 | ||||
| 2026-04-24 | 13F | Yousif Capital Management, Llc | 28.988 | -0,18 | 1.220 | -2,94 | ||||
| 2026-01-23 | 13F | Assetmark, Inc | 1.296 | 1,17 | 53 | 6,00 | ||||
| 2026-02-17 | 13F | Amundi | 18.554 | -29,98 | 761 | -26,43 | ||||
| 2026-02-10 | 13F | Intech Investment Management Llc | 95.393 | -23,32 | 3.911 | -19,87 | ||||
| 2026-02-13 | 13F | Umb Bank N A/mo | 505 | 18,27 | 21 | 25,00 | ||||
| 2026-02-17 | 13F | Css Llc/il | 19.835 | 1,72 | 813 | 6,27 | ||||
| 2026-02-11 | 13F | Prestige Wealth Management Group LLC | 130 | 0,00 | 5 | 0,00 | ||||
| 2026-02-11 | 13F | Manchester Capital Management LLC | 54 | 2 | ||||||
| 2026-02-10 | 13F | Rothschild Investment Llc | 149 | 6,43 | 6 | 20,00 | ||||
| 2026-02-13 | 13F | Verition Fund Management LLC | 51.027 | 14,11 | 2.092 | 19,27 | ||||
| 2026-02-12 | 13F | JPL Wealth Management, LLC | 0 | -100,00 | 0 | |||||
| 2026-04-08 | 13F | Arlington Trust Co LLC | 70 | 3 | ||||||
| 2026-02-17 | 13F | Captrust Financial Advisors | 6.026 | 3,79 | 247 | 8,81 | ||||
| 2026-02-17 | 13F | Tudor Investment Corp Et Al | 12.904 | 529 | ||||||
| 2025-11-07 | 13F | CenterBook Partners LP | 77.170 | -78,21 | 3.028 | -75,96 | ||||
| 2026-02-11 | 13F | Simplex Trading, Llc | Call | 114.500 | -34,42 | 4.694 | 78.133,33 | |||
| 2026-02-13 | 13F | JustInvest LLC | 10.774 | 1,70 | 442 | 6,27 | ||||
| 2026-02-17 | 13F | Occudo Quantitative Strategies Lp | 9.046 | 371 | ||||||
| 2026-02-17 | 13F | Susquehanna Fundamental Investments, Llc | 0 | -100,00 | 0 | |||||
| 2026-04-24 | 13F | Profund Advisors Llc | 5.424 | -54,96 | 228 | -53,75 | ||||
| 2026-02-11 | 13F | Simplex Trading, Llc | 31.116 | 225,18 | 1.276 | |||||
| 2026-02-13 | 13F | Bridgewater Associates, LP | 14.967 | 614 | ||||||
| 2026-04-29 | 13F | Envestnet Portfolio Solutions, Inc. | 20.615 | -0,01 | 868 | 2,60 | ||||
| 2026-02-13 | 13F | Manufacturers Life Insurance Company, The | 0 | -100,00 | 0 | |||||
| 2026-02-12 | 13F | Voya Investment Management Llc | 56.155 | 1,07 | 2.302 | 5,60 | ||||
| 2026-02-02 | 13F | Danske Bank A/s | 100 | 0,00 | 4 | 33,33 | ||||
| 2026-04-06 | 13F | Versant Capital Management, Inc | 2.347 | 0,00 | 99 | 2,08 | ||||
| 2026-02-17 | 13F/A | Laurion Capital Management LP | 18.154 | 744 | ||||||
| 2026-04-08 | 13F | DiNuzzo Private Wealth, Inc. | 18 | 12,50 | 1 | |||||
| 2026-02-10 | 13F | Bank of New York Mellon Corp | 858.450 | -2,66 | 35.196 | 1,70 | ||||
| 2026-02-12 | 13F | Ankerstar Wealth, LLC | 16 | 1 | ||||||
| 2026-02-17 | 13F | Foursixthree Capital Lp | Put | 0 | -100,00 | 0 | ||||
| 2026-02-09 | 13F | Fidelis Capital Partners, LLC | 16.598 | -0,20 | 681 | 4,29 | ||||
| 2026-02-12 | 13F | Ensign Peak Advisors, Inc | 9.750 | -63,35 | 400 | -61,74 | ||||
| 2025-11-14 | 13F | Texas Permanent School Fund | 0 | -100,00 | 0 | |||||
| 2026-02-12 | 13F | Bank Of Montreal /can/ | 36.608 | -0,58 | 1.501 | 3,88 | ||||
| 2026-04-15 | 13F | Exchange Traded Concepts, Llc | 21.727 | 414,49 | 915 | 428,32 | ||||
| 2026-04-27 | 13F | Greenleaf Trust | 5.534 | 0,58 | 233 | 3,11 | ||||
| 2026-02-10 | 13F | Commonwealth Of Pennsylvania Public School Empls Retrmt Sys | 24.331 | -2,79 | 998 | 1,53 | ||||
| 2026-02-17 | 13F | Tcw Group Inc | 605.232 | 0,00 | 24.815 | 4,48 | ||||
| 2025-11-14 | 13F | Two Sigma Securities, Llc | 0 | -100,00 | 0 | |||||
| 2026-04-15 | 13F | Bayforest Capital Ltd | 76 | 3 | ||||||
| 2026-04-22 | 13F | Pictet Asset Management Holding SA | 16.706 | 13,68 | 703 | 16,78 | ||||
| 2025-11-04 | 13F | IMC-Chicago, LLC | 0 | -100,00 | 0 | -100,00 | ||||
| 2026-02-12 | 13F | Elo Mutual Pension Insurance Co | 16.859 | -12,80 | 691 | -8,84 | ||||
| 2026-02-13 | 13F | Public Sector Pension Investment Board | 0 | -100,00 | 0 | |||||
| 2025-11-14 | 13F | Cubist Systematic Strategies, LLC | 4.741 | 186 | ||||||
| 2026-02-10 | 13F | Acadian Asset Management Llc | 20.952 | 1 | ||||||
| 2026-02-17 | 13F | SageView Advisory Group, LLC | 3.000 | 123 | ||||||
| 2026-02-11 | 13F | Cerity Partners LLC | 12.556 | -20,94 | 515 | -17,50 | ||||
| 2026-02-11 | 13F | Group One Trading, L.p. | Call | 134.300 | -17,81 | 5.506 | -14,12 | |||
| 2026-04-10 | 13F | Abound Wealth Management | 0 | -100,00 | 0 | |||||
| 2026-04-27 | 13F | New York State Teachers Retirement System | 104.370 | -10,07 | 4 | 0,00 | ||||
| 2025-10-30 | 13F | Twin Peaks Wealth Advisors, LLC | 0 | -100,00 | 0 | -100,00 | ||||
| 2026-02-17 | 13F | Saba Capital Management, L.P. | 80.000 | 0,00 | 3.280 | 4,49 | ||||
| 2026-01-29 | 13F | Vanguard Group Inc | 11.375.121 | -1,06 | 466.380 | 3,38 | ||||
| 2026-02-17 | 13F | Boothbay Fund Management, Llc | 263.216 | 10.792 | ||||||
| 2026-01-29 | 13F | IMC-Chicago, LLC | Call | 17.500 | -71,07 | 718 | -69,80 | |||
| 2026-02-13 | 13F | Squarepoint Ops LLC | 22.876 | -94,35 | 938 | -94,10 | ||||
| 2026-02-17 | 13F | Bank Of America Corp /de/ | Call | 0 | -100,00 | 0 | ||||
| 2026-04-08 | 13F | Wealth Enhancement Advisory Services, Llc | 7.197 | 0,00 | 323 | 11,00 | ||||
| 2026-02-13 | 13F | Smartleaf Asset Management LLC | 3.465 | 0,99 | 142 | 6,82 | ||||
| 2026-02-11 | 13F | Allianz Asset Management GmbH | 335.061 | -26,59 | 13.738 | -23,30 | ||||
| 2026-02-12 | 13F | Nuveen, LLC | 254.939 | -1,86 | 10.452 | 2,54 | ||||
| 2026-02-10 | 13F | State of Wyoming | 0 | -100,00 | 0 | |||||
| 2026-02-17 | 13F | Jones Financial Companies Lllp | 1.404 | 69,16 | 58 | 83,87 | ||||
| 2026-02-09 | 13F | Hartland & Co., LLC | 4.100 | -2,57 | 168 | 1,82 | ||||
| 2026-04-28 | 13F | Flagship Harbor Advisors, Llc | 0 | -100,00 | 0 | |||||
| 2026-02-17 | 13F | Citadel Advisors Llc | Put | 0 | -100,00 | 0 | ||||
| 2026-02-17 | 13F | Quantinno Capital Management LP | 26.464 | 50,65 | 1.085 | 57,47 | ||||
| 2026-04-17 | 13F | Krilogy Financial LLC | 101.030 | -9,96 | 4.604 | -6,86 | ||||
| 2026-02-13 | 13F | Carronade Capital Management, LP | 4.203.594 | 14,21 | 172.347 | 19,33 | ||||
| 2026-02-17 | 13F | Northern Trust Corp | 998.345 | -5,72 | 40.932 | -1,49 | ||||
| 2026-02-13 | 13F | American Century Companies Inc | 3.564.761 | -1,28 | 146.155 | 3,15 | ||||
| 2026-02-17 | 13F | Point72 Asset Management, L.P. | 1.137.957 | 44,62 | 46.656 | 51,11 | ||||
| 2026-04-20 | 13F | Hilton Head Capital Partners, LLC | 57 | 0,00 | 2 | 0,00 | ||||
| 2026-02-13 | 13F | Parkside Financial Bank & Trust | 154 | 31,62 | 6 | 50,00 | ||||
| 2026-02-17 | 13F | Stonehill Capital Management Llc | 0 | -100,00 | 0 | |||||
| 2026-04-14 | 13F | Congress Asset Management Co /ma | 278.324 | 22,01 | 11.717 | 25,29 | ||||
| 2026-02-12 | 13F | Loomis Sayles & Co L P | 531.439 | 4,59 | 21.789 | 9,28 | ||||
| 2026-04-20 | 13F/A | OP Asset Management Ltd | 0 | -100,00 | 0 | -100,00 | ||||
| 2026-02-17 | 13F | Bank Of America Corp /de/ | Put | 0 | -100,00 | 0 | ||||
| 2026-02-18 | 13F | First Citizens Bank & Trust Co | 21.266 | -0,42 | 872 | 4,06 | ||||
| 2026-02-12 | 13F | Dimensional Fund Advisors Lp | 6.392.050 | 1,61 | 262.072 | 6,17 | ||||
| 2026-02-12 | 13F | Colony Capital, Inc. | 205.700 | -8,98 | 8.434 | -4,91 | ||||
| 2026-01-26 | 13F | Private Trust Co Na | 358 | 0,00 | 15 | 0,00 | ||||
| 2026-02-13 | 13F | Panagora Asset Management Inc | 5.042 | -11,00 | 207 | -7,21 | ||||
| 2026-04-22 | 13F | Spire Wealth Management | 0 | -100,00 | 0 | |||||
| 2026-02-17 | 13F | D. E. Shaw & Co., Inc. | 119.381 | -15,01 | 4.895 | -11,21 | ||||
| 2025-11-13 | 13F | Scoggin Management Lp | Put | 0 | -100,00 | 0 | -100,00 | |||
| 2026-02-09 | 13F | Legal & General Group Plc | 268.078 | -3,98 | 10.991 | 0,33 | ||||
| 2026-02-09 | 13F | Hantz Financial Services, Inc. | 155 | 44,86 | 0 | |||||
| 2025-11-13 | 13F | UBS Group AG | Put | 0 | -100,00 | 0 | -100,00 | |||
| 2026-02-13 | 13F | Caitong International Asset Management Co., Ltd | 0 | -100,00 | 0 | |||||
| 2026-02-17 | 13F | CastleKnight Management LP | 137.400 | 0,00 | 5.633 | 4,49 | ||||
| 2026-02-13 | 13F | Healthcare Of Ontario Pension Plan Trust Fund | 850.400 | -13,40 | 34.866 | -9,52 | ||||
| 2026-02-17 | 13F | Lighthouse Investment Partners, LLC | 6.300 | 258 | ||||||
| 2026-02-13 | 13F | Morgan Stanley | 1.869.536 | -9,76 | 76.651 | -5,71 | ||||
| 2026-02-17 | 13F | Alliancebernstein L.p. | 120.440 | 4,48 | 4.938 | 9,18 | ||||
| 2026-01-29 | 13F | Dunhill Financial, LLC | 2 | 0 | ||||||
| 2026-02-05 | 13F | Gamco Investors, Inc. Et Al | 1.603.026 | -2,90 | 65.724 | 1,45 | ||||
| 2026-01-30 | 13F | Us Bancorp \de\ | 10.443 | -0,11 | 428 | 4,39 | ||||
| 2026-02-13 | 13F | Neuberger Berman Group LLC | 10.422 | 30,01 | 427 | 35,99 | ||||
| 2026-02-13 | 13F | Kettle Hill Capital Management, Llc | 236.635 | 9.702 | ||||||
| 2026-02-19 | 13F | CI Private Wealth, LLC | 15.033 | -1,38 | 616 | 3,01 | ||||
| 2026-02-17 | 13F | Man Group plc | 127.920 | 5.245 | ||||||
| 2026-04-17 | 13F | Bell Investment Advisors, Inc | 24 | 0,00 | 1 | |||||
| 2025-11-12 | 13F | Group One Trading, L.p. | 0 | -100,00 | 0 | -100,00 | ||||
| 2026-02-13 | 13F | Ubs Asset Management Americas Inc | 255.612 | 0,96 | 10.480 | 5,49 | ||||
| 2026-04-23 | 13F | North Star Investment Management Corp. | 0 | -100,00 | 0 | |||||
| 2026-02-09 | 13F | New Age Alpha Advisors, LLC | 15.454 | 1.166,72 | 634 | 1.246,81 | ||||
| 2026-02-12 | 13F | Xponance, Inc. | 7.891 | 0,64 | 324 | 5,21 | ||||
| 2026-03-06 | 13F | Hsbc Holdings Plc | 23.315 | 198,95 | 956 | 213,44 | ||||
| 2026-02-03 | 13F | We Are One Seven, LLC | 4.920 | 202 | ||||||
| 2026-04-28 | 13F | SBI Securities Co., Ltd. | 1.340 | -6,88 | 56 | -3,45 | ||||
| 2026-02-17 | 13F | MIRAE ASSET GLOBAL ETFS HOLDINGS Ltd. | 46.256 | -0,01 | 1.896 | 4,46 | ||||
| 2025-11-14 | 13F | Wolverine Trading, Llc | 9.068 | -47,05 | 350 | -40,37 | ||||
| 2025-11-14 | 13F | Wolverine Trading, Llc | Call | 55.700 | 69,30 | 2.153 | 90,78 | |||
| 2025-11-14 | 13F | WealthTrak Capital Management LLC | 0 | -100,00 | 0 | |||||
| 2026-02-17 | 13F | Citadel Advisors Llc | Call | 48.800 | -41,70 | 2.001 | -39,10 | |||
| 2026-02-17 | 13F | Citadel Advisors Llc | 478.911 | 1.185,05 | 19.635 | 1.243,02 | ||||
| 2026-02-17 | 13F | Aristeia Capital Llc | 450.000 | 0,00 | 18.450 | 4,49 | ||||
| 2026-04-06 | 13F | GAMMA Investing LLC | 6.660 | 4,36 | 280 | 7,28 | ||||
| 2026-02-17 | 13F | Creative Planning | 20.160 | -11,04 | 827 | -7,09 | ||||
| 2026-02-13 | 13F | Toroso Investments, LLC | 9.182 | -19,47 | 376 | -15,88 | ||||
| 2026-02-13 | 13F | Kilter Group LLC | 32 | 1 | ||||||
| 2026-02-13 | 13F | Charles Schwab Investment Management Inc | 1.130.205 | -1,34 | 46.338 | 3,08 | ||||
| 2026-02-13 | 13F | Sei Investments Co | 31.715 | 176,62 | 1.300 | 189,53 | ||||
| 2026-02-11 | 13F | T3 Companies, LLC | 17.436 | 715 | ||||||
| 2026-02-17 | 13F | Knighthead Capital Management, LLC | 516.000 | 200,11 | 21.156 | 213,61 | ||||
| 2026-02-13 | 13F | Edgestream Partners, L.P. | 0 | -100,00 | 0 | -100,00 | ||||
| 2026-02-13 | 13F | Victory Capital Management Inc | 136.386 | 22,88 | 5.592 | 28,38 | ||||
| 2025-11-13 | 13F | Renaissance Technologies Llc | 0 | -100,00 | 0 | |||||
| 2026-01-12 | 13F | Rialto Wealth Management, LLC | 10 | 0,00 | 0 | |||||
| 2026-02-17 | 13F | Lazard Asset Management Llc | 0 | -100,00 | 0 | |||||
| 2026-01-14 | 13F | Net Worth Advisory Group | 0 | -100,00 | 0 | |||||
| 2026-02-05 | 13F | Allworth Financial LP | 329 | 21,85 | 13 | 30,00 | ||||
| 2026-02-17 | 13F | Canada Pension Plan Investment Board | 52.700 | -71,83 | 2.161 | -70,58 | ||||
| 2026-02-17 | 13F | Qube Research & Technologies Ltd | 1.282.357 | 14,37 | 52.577 | 19,50 | ||||
| 2025-11-14 | 13F | Voleon Capital Management Lp | 0 | -100,00 | 0 | -100,00 | ||||
| 2026-02-17 | 13F | Susquehanna Portfolio Strategies, LLC | 109.177 | 24,74 | 4.476 | 30,34 | ||||
| 2026-02-13 | 13F | Prudential Financial Inc | 155.766 | 2,14 | 6.386 | 6,72 | ||||
| 2026-02-04 | 13F | Bailard, Inc. | 5.300 | 217 | ||||||
| 2026-02-12 | 13F | Quadrant Capital Group Llc | 3.573 | 3,15 | 146 | 8,15 | ||||
| 2026-02-06 | 13F | Pnc Financial Services Group, Inc. | 14.316 | -0,57 | 587 | 3,90 | ||||
| 2026-02-11 | 13F | SOUTH STATE Corp | 174 | 0,00 | 7 | 16,67 | ||||
| 2026-02-17 | 13F | Graham Capital Management, L.P. | 34.152 | 45,78 | 1.400 | 52,34 | ||||
| 2026-02-11 | 13F | Illinois Municipal Retirement Fund | 56.502 | 5,74 | 2.317 | 10,50 | ||||
| 2026-02-10 | 13F | Axq Capital, Lp | 10.934 | 63,78 | 448 | 71,65 | ||||
| 2025-11-12 | 13F | Sierra Summit Advisors Llc | 0 | -100,00 | 0 | |||||
| 2026-02-17 | 13F | Davidson Kempner Capital Management Lp | 1.411.700 | 0,00 | 57.880 | 4,48 | ||||
| 2026-02-17 | 13F | Prelude Capital Management, Llc | 89.643 | 20,03 | 3.675 | 25,43 | ||||
| 2026-04-29 | 13F/A | True Link Financial Advisors, LLC | 2.700 | 114 | ||||||
| 2026-04-28 | 13F | Bfsg, Llc | 0 | -100,00 | 0 | |||||
| 2026-03-11 | 13F | Leonteq Securities AG | 0 | -100,00 | 0 | |||||
| 2025-11-12 | 13F | Catalyst Funds Management Pty Ltd | 0 | -100,00 | 0 | -100,00 | ||||
| 2026-02-10 | 13F | CIBC Asset Management Inc | 9.804 | 2,42 | 402 | 6,93 | ||||
| 2026-04-21 | 13F | Gilpin Wealth Management, Llc | 16 | 77,78 | 1 | |||||
| 2026-02-03 | 13F | Crossmark Global Holdings, Inc. | 7.095 | 0,00 | 291 | 4,32 | ||||
| 2026-02-17 | 13F | Silver Point Capital L.P. | 0 | -100,00 | 0 | |||||
| 2026-04-29 | 13F | Klp Kapitalforvaltning As | 25.900 | 2,78 | 1.090 | 5,52 | ||||
| 2025-11-06 | 13F | Ameritas Advisory Services, LLC | 0 | -100,00 | 0 | |||||
| 2026-01-14 | 13F | Hennion & Walsh Asset Management, Inc. | 24.790 | 225,41 | 1.016 | 240,94 | ||||
| 2026-02-17 | 13F | Dark Forest Capital Management Lp | 0 | -100,00 | 0 | |||||
| 2026-02-18 | 13F | Sunstone Asset Management, L.P. | 70.604 | 2.895 | ||||||
| 2026-02-12 | 13F | Cloud Capital Management, LLC | 0 | -100,00 | 0 | |||||
| 2026-02-17 | 13F | Toronto Dominion Bank | 67.122 | -60,07 | 2.752 | -58,29 | ||||
| 2026-01-30 | 13F | Innealta Capital, Llc | 0 | -100,00 | 0 | |||||
| 2026-02-02 | 13F | Fifth Third Bancorp | 1.499 | 1,22 | 61 | 5,17 | ||||
| 2026-02-17 | 13F | Nomura Holdings Inc | Call | 313.800 | 94,42 | 12.866 | 103,14 | |||
| 2026-02-17 | 13F | Scoggin Management Lp | 0 | -100,00 | 0 | |||||
| 2026-02-04 | 13F | Virginia Retirement Systems Et Al | 37.400 | 1.533 | ||||||
| 2026-02-11 | 13F | Empowered Funds, LLC | 104.457 | -69,48 | 4.283 | -68,11 | ||||
| 2026-02-17 | 13F | Kerrisdale Advisers, LLC | 506.067 | 20.749 | ||||||
| 2026-01-23 | 13F | Rsm Us Wealth Management Llc | 7.756 | -7,11 | 317 | -3,06 | ||||
| 2026-02-17 | 13F | Scoggin Management Lp | Call | 225.000 | 0,00 | 9.225 | 4,49 | |||
| 2026-04-27 | 13F | Truist Financial Corp | 40.647 | 6,81 | 1.711 | 9,68 | ||||
| 2026-02-10 | 13F | Natixis Advisors, L.p. | 38.502 | 0,95 | 2 | 0,00 | ||||
| 2026-01-08 | 13F | True Wealth Design, LLC | 0 | -100,00 | 0 | |||||
| 2026-02-09 | 13F | Atlantic Trust, LLC | 0 | -100,00 | 0 | |||||
| 2026-02-13 | 13F | 140 Summer Partners LP | 1.315.306 | 5,30 | 53.928 | 10,02 | ||||
| 2026-02-13 | 13F | Barclays Plc | 346.611 | -20,54 | 14.211 | -16,98 | ||||
| 2026-02-13 | 13F | Barclays Plc | Call | 56.600 | -41,71 | 2.321 | -39,11 | |||
| 2025-11-07 | 13F | Shell Asset Management Co | 2.742 | -58,61 | 0 | |||||
| 2026-02-05 | 13F | Amalgamated Bank | 28.596 | 1,38 | 1 | 0,00 | ||||
| 2026-02-11 | 13F | Los Angeles Capital Management Llc | 393 | 15 | ||||||
| 2025-11-03 | 13F | Summit Global Investments | 0 | -100,00 | 0 | |||||
| 2026-04-15 | 13F | Fortitude Family Office, LLC | 100 | 112,77 | 4 | 300,00 | ||||
| 2026-02-12 | 13F | Callan Family Office, LLC | 14.877 | 3,40 | 610 | 7,98 | ||||
| 2026-02-17 | 13F | Raymond James Financial Inc | 171.152 | 0,02 | 7.017 | 4,51 | ||||
| 2026-02-17 | 13F | Magnetar Financial LLC | 12.555 | 515 | ||||||
| 2026-04-23 | 13F | Forum Financial Management, LP | 0 | -100,00 | 0 | |||||
| 2026-02-17 | 13F | Russell Investments Group, Ltd. | 45.286 | -66,97 | 1.857 | -65,50 | ||||
| 2026-02-17 | 13F | Advisor Group Holdings, Inc. | 3.131 | -3,81 | 128 | 1,59 | ||||
| 2026-02-17 | 13F | Millennium Management Llc | 1.044.166 | 112,84 | 42.811 | 122,39 | ||||
| 2026-02-04 | 13F | Swiss Life Asset Management Ltd | 4.935 | 202 | ||||||
| 2026-02-10 | 13F | Nomura Asset Management Co Ltd | 1.830 | 0,00 | 75 | 5,63 | ||||
| 2026-04-28 | 13F | Sage Rhino Capital Llc | 5.454 | 3,12 | 230 | 6,02 | ||||
| 2026-02-13 | 13F | Resources Investment Advisors, LLC. | 10.035 | 1,36 | 411 | 5,93 | ||||
| 2026-02-05 | 13F | Elyxium Wealth, LLC | 37 | 2 | ||||||
| 2026-02-09 | 13F | Quest Partners LLC | 16.803 | 23,81 | 689 | 29,32 | ||||
| 2026-02-13 | 13F | Walleye Trading LLC | 0 | -100,00 | 0 | -100,00 | ||||
| 2026-04-27 | 13F | Y-Intercept (Hong Kong) Ltd | 43.768 | -12,99 | 1.843 | -10,67 | ||||
| 2026-02-06 | 13F | HighTower Advisors, LLC | 5.866 | 4,27 | 241 | 9,09 | ||||
| 2026-02-09 | 13F | Keating Financial Advisory Services, Inc. | 311 | 13 | ||||||
| 2026-04-13 | 13F | Jackson Square Capital, Llc | 4.800 | 202 | ||||||
| 2026-02-10 | 13F | Bruce G. Allen Investments, LLC | 12 | 0,00 | 0 | |||||
| 2026-02-17 | 13F | Capstone Investment Advisors, Llc | 0 | -100,00 | 0 | -100,00 | ||||
| 2026-04-23 | 13F | Marquette Asset Management, LLC | 13 | 0,00 | 1 | |||||
| 2026-02-11 | 13F | Jpmorgan Chase & Co | Call | 0 | -100,00 | 0 | -100,00 | |||
| 2026-02-11 | 13F | Deutsche Bank Ag\ | 1.111.928 | -11,66 | 45.589 | -7,69 | ||||
| 2025-11-13 | 13F | Jump Financial, LLC | 0 | -100,00 | 0 | |||||
| 2025-11-14 | 13F | Caption Management, LLC | Put | 0 | -100,00 | 0 | ||||
| 2026-02-11 | 13F | Winton Capital Group Ltd | 165.657 | 1.924,90 | 6.792 | 2.015,58 | ||||
| 2026-02-17 | 13F | Fmr Llc | 261.857 | -52,34 | 10.736 | -50,20 | ||||
| 2025-11-13 | 13F | Dynamic Technology Lab Private Ltd | 0 | -100,00 | 0 | |||||
| 2026-02-17 | 13F | Aster Capital Management (DIFC) Ltd | 0 | -100,00 | 0 | |||||
| 2026-04-21 | 13F | Hennessy Advisors Inc | 225.400 | -3,39 | 9.489 | -0,79 | ||||
| 2026-02-12 | 13F | Steward Partners Investment Advisory, Llc | 1.734 | -42,24 | 71 | -39,32 | ||||
| 2026-02-13 | 13F | Barclays Plc | Put | 0 | -100,00 | 0 | -100,00 | |||
| 2026-04-13 | 13F | Highland Capital Management, Llc | 0 | -100,00 | 0 | |||||
| 2026-01-29 | 13F | Teachers Retirement System Of The State Of Kentucky | 24.734 | -12,19 | 1 | 0,00 | ||||
| 2026-02-13 | 13F | Walleye Capital LLC | Call | 0 | -100,00 | 0 | ||||
| 2026-02-13 | 13F | Walleye Capital LLC | Put | 0 | -100,00 | 0 | ||||
| 2026-04-22 | 13F | Janney Montgomery Scott LLC | 36.337 | 5,75 | 2 | 0,00 | ||||
| 2026-02-17 | 13F | Third Point LLC | 6.675.000 | -0,48 | 273.675 | 3,98 | ||||
| 2026-02-13 | 13F | Walleye Capital LLC | 0 | -100,00 | 0 | |||||
| 2025-11-14 | 13F | Verition Fund Management LLC | Put | 0 | -100,00 | 0 | -100,00 | |||
| 2026-02-13 | 13F | Rubric Capital Management LP | 1.850.000 | 15,62 | 75.850 | 20,81 | ||||
| 2026-04-24 | 13F | Strs Ohio | 13.200 | 4,76 | 556 | 7,56 | ||||
| 2026-02-17 | 13F | Optiver Holding B.V. | 134 | -65,99 | 5 | -66,67 | ||||
| 2026-04-10 | 13F | Waldron Private Wealth LLC | 7.400 | 0,00 | 312 | 2,64 | ||||
| 2026-04-21 | 13F | Venturi Wealth Management, LLC | 5.393 | 227 | ||||||
| 2026-02-13 | 13F | Mariner, LLC | 11.332 | -58,34 | 465 | -56,51 | ||||
| 2026-04-10 | 13F | Country Trust Bank | 90 | 0,00 | 4 | 0,00 | ||||
| 2026-02-06 | 13F | Global Retirement Partners, LLC | 139 | 41,84 | 6 | 66,67 | ||||
| 2026-04-29 | 13F | Hughes Financial Services, LLC | 25 | -32,43 | 1 | 0,00 | ||||
| 2026-04-20 | 13F | Axecap Investments, LLC | 0 | -100,00 | 0 | |||||
| 2026-02-17 | 13F | Cambria Investment Management, L.P. | 17.396 | 18,73 | 713 | 24,22 | ||||
| 2026-02-17 | 13F | Susquehanna International Group, Llp | 54.771 | -48,16 | 2.246 | -45,84 | ||||
| 2026-02-17 | 13F | Susquehanna International Group, Llp | Put | 13.000 | -26,97 | 533 | -23,64 | |||
| 2026-04-28 | 13F | Handelsbanken Fonder AB | 30.725 | 0,00 | 1 | 0,00 | ||||
| 2026-02-17 | 13F | Susquehanna International Group, Llp | Call | 170.600 | -49,84 | 6.995 | -47,59 | |||
| 2026-02-03 | 13F | Ballentine Partners, LLC | 7.362 | -4,55 | 302 | -0,33 | ||||
| 2026-02-06 | 13F | EverSource Wealth Advisors, LLC | 840 | -26,70 | 34 | -22,73 | ||||
| 2026-01-29 | 13F | Comerica Bank | 27.457 | -7,32 | 1.126 | -3,18 | ||||
| 2026-04-23 | 13F | SJS Investment Consulting Inc. | 20 | 53,85 | 1 | |||||
| 2026-02-17 | 13F | Algert Global Llc | 0 | -100,00 | 0 | |||||
| 2026-02-17 | 13F | California State Teachers Retirement System | 97.210 | 1,53 | 3.986 | 6,07 | ||||
| 2026-04-30 | 13F | Teacher Retirement System Of Texas | 146.013 | 1.550,42 | 6.147 | 1.598,07 | ||||
| 2026-01-22 | 13F | Bartlett & Co. Wealth Management Llc | 6.354 | 0,00 | 261 | 4,42 | ||||
| 2026-02-09 | 13F | Harbour Investments, Inc. | 4 | -87,88 | 0 | -100,00 | ||||
| 2026-02-17 | 13F | Price T Rowe Associates Inc /md/ | 101.671 | 1,79 | 4 | 33,33 | ||||
| 2026-02-12 | 13F | Jane Street Group, Llc | Call | 111.000 | -41,64 | 4.551 | -39,02 | |||
| 2026-02-12 | 13F | Jane Street Group, Llc | 118.453 | 7,62 | 4.857 | 12,46 | ||||
| 2026-02-12 | 13F | Jane Street Group, Llc | Put | 44.200 | -4,12 | 1.812 | 0,22 | |||
| 2026-02-12 | 13F | CIBC Private Wealth Group, LLC | 2.224 | 91 | ||||||
| 2026-02-13 | 13F | State Street Corp | 4.049.385 | 1,46 | 166.025 | 6,02 | ||||
| 2026-02-05 | 13F | GABELLI & Co INVESTMENT ADVISERS, INC. | 11.000 | -79,79 | 451 | -78,88 | ||||
| 2026-02-13 | 13F | Jacobs Levy Equity Management, Inc | 102.080 | 4.185 | ||||||
| 2026-02-14 | 13F | Rockefeller Capital Management L.P. | 57 | -92,58 | 2 | -93,33 | ||||
| 2025-11-14 | 13F | Engineers Gate Manager LP | 0 | -100,00 | 0 | |||||
| 2026-02-17 | 13F | Royal Bank Of Canada | 54.696 | 37,08 | 2.242 | 43,26 | ||||
| 2026-04-07 | 13F | Signaturefd, Llc | 2.588 | 0,00 | 109 | 1,89 | ||||
| 2026-02-13 | 13F | Quarry LP | 53.258 | 409.576,92 | 2.184 | |||||
| 2026-02-17 | 13F | Bridgeway Capital Management Inc | 157.393 | -73,20 | 6.453 | -71,99 | ||||
| 2026-02-12 | 13F | BlackRock, Inc. | 14.872.075 | 0,04 | 609.755 | 4,53 | ||||
| 2026-01-28 | 13F | Arizona State Retirement System | 28.578 | -5,17 | 1.172 | -0,93 | ||||
| 2026-02-17 | 13F | Two Sigma Advisers, Lp | 91.300 | 4,46 | 3.743 | 9,16 | ||||
| 2026-02-17 | 13F | Janus Henderson Group Plc | 43.214 | 0,00 | 1.772 | 4,54 | ||||
| 2026-02-10 | 13F | Norges Bank | 541.663 | 22.208 | ||||||
| 2026-04-17 | 13F | Vermillion Wealth Management, Inc. | 4 | 0 | ||||||
| 2026-02-18 | 13F | State of Tennessee, Treasury Department | 22.513 | -22,03 | 1.016 | -10,33 | ||||
| 2026-02-13 | 13F | Great West Life Assurance Co /can/ | 89.149 | 2,99 | 4 | 0,00 | ||||
| 2026-02-11 | 13F | Jpmorgan Chase & Co | 383.491 | -39,48 | 15.723 | -36,77 | ||||
| 2026-04-23 | 13F | Farmers & Merchants Investments Inc | 60 | 0,00 | 3 | 0,00 | ||||
| 2026-04-20 | 13F | Ronald Blue Trust, Inc. | 93 | -1,06 | 4 | 0,00 | ||||
| 2026-02-12 | 13F | State Board Of Administration Of Florida Retirement System | 38.016 | 0,00 | 1.559 | 4,49 | ||||
| 2026-02-17 | 13F | Foursixthree Capital Lp | 1.209.849 | -12,55 | 49.604 | -8,63 | ||||
| 2026-04-10 | 13F | Matrix Trust Co | 0 | -100,00 | 0 | |||||
| 2026-02-05 | 13F | Thrivent Financial For Lutherans | 67.531 | -4,75 | 3 | 0,00 | ||||
| 2026-02-03 | 13F | Carlson Capital L P | 9.000 | 369 | ||||||
| 2026-02-13 | 13F | Walleye Trading LLC | Call | 5.900 | -46,85 | 242 | -44,60 | |||
| 2026-04-21 | 13F | Pallas Capital Advisors LLC | 7.034 | -0,09 | 296 | 2,78 | ||||
| 2026-02-13 | 13F | Walleye Trading LLC | Put | 5.700 | -63,69 | 234 | -62,18 | |||
| 2026-01-28 | 13F | Salomon & Ludwin, LLC | 681 | 51,33 | 28 | 58,82 | ||||
| 2026-02-06 | 13F | Tortoise Investment Management, LLC | 0 | -100,00 | 0 | |||||
| 2026-01-23 | 13F | Optima Capital Llc | 13 | 1 | ||||||
| 2026-04-28 | 13F | Harbor Capital Advisors, Inc. | 217 | 47,62 | 0 | |||||
| 2026-02-11 | 13F | Parallel Advisors, LLC | 2.823 | 0,00 | 116 | 4,55 | ||||
| 2026-02-13 | 13F | SRS Capital Advisors, Inc. | 411 | 17 | ||||||
| 2026-02-13 | 13F | Caxton Associates Llp | 24.740 | 1.014 | ||||||
| 2026-02-13 | 13F | Croban | 37.526 | 1,18 | 1.539 | 5,78 | ||||
| 2026-02-12 | 13F | MetLife Investment Management, LLC | 55.858 | -2,22 | 2.290 | 2,19 | ||||
| 2026-01-29 | 13F | UBS Group AG | Call | 0 | -100,00 | 0 | -100,00 | |||
| 2026-02-18 | 13F | Mackenzie Financial Corp | 12.939 | -24,82 | 528 | -21,78 | ||||
| 2026-02-18 | 13F | GWM Advisors LLC | 74.338 | 1,55 | 3.048 | 6,09 | ||||
| 2026-01-29 | 13F | UBS Group AG | 909.686 | -38,38 | 37.297 | -35,62 | ||||
| 2026-02-17 | 13F | Ameriprise Financial Inc | 197.333 | -83,48 | 8.091 | -82,74 | ||||
| 2026-04-15 | 13F | Alhambra Investment Partners LLC | 34.000 | 0,00 | 1.431 | 2,65 | ||||
| 2026-04-20 | 13F | Jfs Wealth Advisors, Llc | 83 | -3,49 | 3 | 0,00 | ||||
| 2026-02-10 | 13F | Bnp Paribas Arbitrage, Sa | 202.851 | -5,83 | 8.317 | -1,61 | ||||
| 2026-02-13 | 13F | Citigroup Inc | 28.412 | -28,02 | 1.165 | -24,81 | ||||
| 2026-03-05 | 13F | Sentinel Dome Partners, LLC | 120.000 | 4.920 | ||||||
| 2025-11-14 | 13F | J. Goldman & Co LP | Put | 0 | -100,00 | 0 | -100,00 | |||
| 2026-01-16 | 13F | Empirical Financial Services, LLC d.b.a. Empirical Wealth Management | 11.570 | 24,15 | 474 | 29,86 | ||||
| 2026-02-10 | 13F/A | Northwestern Mutual Wealth Management Co | 186 | -2,62 | 8 | 0,00 | ||||
| 2025-11-13 | 13F | Clear Street Markets Llc | 0 | -100,00 | 0 | -100,00 | ||||
| 2026-04-14 | 13F | Bay Harbor Wealth Management, LLC | 14 | 100,00 | 1 | |||||
| 2026-04-27 | 13F | Pensionmark Financial Group, Llc | 9.012 | -6,35 | 379 | -3,81 | ||||
| 2026-02-13 | 13F | Martingale Asset Management L P | 26.718 | 1,52 | 1.095 | 6,10 | ||||
| 2025-11-18 | 13F | Colony Capital, Inc. | Call | 0 | -100,00 | 0 | -100,00 | |||
| 2026-04-14 | 13F | Beacon Investment Advisory Services, Inc. | 550 | 23 | ||||||
| 2026-01-27 | 13F | TD Waterhouse Canada Inc. | 245 | 0,00 | 10 | 11,11 | ||||
| 2025-11-14 | 13F | Toronto Dominion Bank | Put | 0 | -100,00 | 0 | -100,00 | |||
| 2026-02-05 | 13F | Bessemer Group Inc | 88.320 | 12.535,19 | 4 | |||||
| 2026-02-17 | 13F | Brevan Howard Capital Management LP | 41.482 | 44,71 | 1.701 | 51,25 | ||||
| 2026-02-13 | 13F | Pathstone Holdings, LLC | 9.768 | 31,70 | 400 | 37,46 | ||||
| 2026-02-17 | 13F | State Of Wisconsin Investment Board | 102.673 | 104,75 | 4.210 | 113,98 | ||||
| 2025-11-13 | 13F | Johnson Financial Group, Inc. | 0 | -100,00 | 0 | |||||
| 2026-02-17 | 13F | ThornTree Capital Partners LP | 0 | -100,00 | 0 | |||||
| 2026-02-02 | 13F | Horizon Investments, LLC | 39.891 | 186,66 | 1.636 | 199,45 | ||||
| 2026-02-09 | 13F | Huntington National Bank | 201 | -4,74 | 8 | 0,00 | ||||
| 2026-02-13 | 13F | Diametric Capital, LP | 102.257 | 124,98 | 4.193 | 135,11 | ||||
| 2026-02-13 | 13F | Rhumbline Advisers | 281.878 | -5,79 | 11.557 | -1,57 | ||||
| 2026-02-17 | 13F | Maryland State Retirement & Pension System | 14.362 | 1,65 | 589 | 6,14 | ||||
| 2025-11-14 | 13F | Toronto Dominion Bank | Call | 0 | -100,00 | 0 | -100,00 | |||
| 2026-04-07 | 13F | Farther Finance Advisors, LLC | 2.815 | 6,39 | 124 | 14,81 | ||||
| 2025-10-30 | 13F | Covestor Ltd | Call | 0 | -100,00 | 0 | ||||
| 2026-02-19 | 13F | Mcguire Capital Advisors Inc | 15 | 1 | ||||||
| 2026-02-26 | 13F | TD Capital Management LLC | 8 | 0 | ||||||
| 2026-01-26 | 13F | Cwm, Llc | 4.286 | -0,23 | 0 | |||||
| 2026-02-03 | 13F | Sequoia Financial Advisors, LLC | 8.879 | 14,43 | 364 | 19,74 | ||||
| 2025-11-14 | 13F | Hawk Ridge Capital Management Lp | 0 | -100,00 | 0 | -100,00 | ||||
| 2026-02-12 | 13F | New York State Common Retirement Fund | 32.435 | 0,00 | 1.330 | 4,48 | ||||
| 2026-04-23 | 13F | Private Wealth Management Group, LLC | 203 | 0,00 | 9 | 0,00 | ||||
| 2026-02-11 | 13F | Fox Run Management, L.l.c. | 20.205 | 828 | ||||||
| 2026-02-13 | 13F | Landscape Capital Management, L.l.c. | 23.758 | 974 | ||||||
| 2026-02-17 | 13F | Ionic Capital Management LLC | 0 | -100,00 | 0 | |||||
| 2026-04-21 | 13F | Pinnacle Associates Ltd | 208.769 | -2,46 | 8.789 | 0,16 | ||||
| 2026-02-12 | 13F | Federated Hermes, Inc. | 171 | -52,10 | 7 | -50,00 | ||||
| 2026-02-13 | 13F | Pinnacle Wealth Planning Services, Inc. | 2.056 | 84 | ||||||
| 2026-02-05 | 13F | Gabelli Funds Llc | 1.526.500 | -2,50 | 62.586 | 1,87 | ||||
| 2026-02-17 | 13F | Caption Management, LLC | Call | 25.000 | 1.025 | |||||
| 2026-04-20 | 13F | Assenagon Asset Management S.A. | 13.537 | -95,51 | 570 | -95,40 | ||||
| 2026-02-06 | 13F | Covestor Ltd | 6.428 | -0,02 | 0 | |||||
| 2026-02-11 | 13F | LPL Financial LLC | 15.208 | -63,24 | 624 | -61,61 | ||||
| 2026-04-29 | 13F | CVA Family Office, LLC | 149 | 520,83 | 6 | |||||
| 2026-02-13 | 13F | Wells Fargo & Company/mn | 119.054 | 43,28 | 4.881 | 49,72 | ||||
| 2026-02-17 | 13F | Cetera Investment Advisers | 8.564 | 351 | ||||||
| 2026-04-29 | 13F | Oregon Public Employees Retirement Fund | 22.422 | -0,44 | 944 | 2,17 | ||||
| 2026-02-13 | 13F | Segall Bryant & Hamill, Llc | 51.325 | 13,67 | 2.104 | 18,80 | ||||
| 2026-04-30 | 13F | BRYN MAWR TRUST Co | 96 | 0,00 | 4 | 33,33 | ||||
| 2026-02-11 | 13F | Ameritas Investment Partners, Inc. | 8.083 | 331 | ||||||
| 2026-04-29 | 13F | Skopos Labs, Inc. | 18.980 | 799 | ||||||
| 2026-04-30 | 13F | Nisa Investment Advisors, Llc | 5.679 | 0,76 | 239 | 3,46 | ||||
| 2026-02-19 | 13F | Invesco Ltd. | 1.249.344 | 5,28 | 51.223 | 10,01 | ||||
| 2026-04-24 | 13F | ProShare Advisors LLC | 15.480 | -19,98 | 652 | -17,91 | ||||
| 2025-11-14 | 13F | Integrity Alliance, Llc. | 0 | -100,00 | 0 | -100,00 | ||||
| 2026-02-11 | 13F | Highbridge Capital Management Llc | 10.000 | 0,00 | 410 | 4,59 | ||||
| 2026-02-12 | 13F | Advisors Asset Management, Inc. | 37.877 | -34,65 | 1.553 | -31,75 | ||||
| 2026-02-10 | 13F | Godfrey Financial Associates, Inc. | 8 | 0 | ||||||
| 2026-04-27 | 13F | Sound Income Strategies, LLC | 448 | 125,13 | 20 | 137,50 | ||||
| 2026-01-20 | 13F | Independence Bank of Kentucky | 1.200 | 0,00 | 49 | 4,26 | ||||
| 2026-01-27 | 13F | Zurcher Kantonalbank (Zurich Cantonalbank) | 32.722 | 6,06 | 1.342 | 10,83 | ||||
| 2026-02-12 | 13F | Swiss National Bank | 202.300 | 2,48 | 8.294 | 7,09 | ||||
| 2026-02-25 | 13F | Mariner Investment Group Llc | 5.000 | 205 | ||||||
| 2026-01-26 | 13F | KBC Group NV | 3.247 | 0,00 | 0 | |||||
| 2026-02-17 | 13F | Sona Asset Management (us) Llc | 0 | -100,00 | 0 | |||||
| 2026-04-27 | 13F | Cooper Investors Pty Ltd | 196.421 | 8.269 | ||||||
| 2026-02-09 | 13F | Annis Gardner Whiting Capital Advisors, LLC | 6 | 0 | ||||||
| 2026-04-13 | 13F | Massmutual Trust Co Fsb/adv | 101 | 0,00 | 4 | 0,00 | ||||
| 2025-11-13 | 13F | Connor, Clark & Lunn Investment Management Ltd. | 0 | -100,00 | 0 | |||||
| 2026-01-27 | 13F | Evergreen Capital Management Llc | 12.190 | -0,93 | 500 | 3,53 | ||||
| 2026-02-11 | 13F | Private Management Group Inc | 483.079 | -3,34 | 19.806 | 0,99 |
Other Listings
| US:TDS | 44,32 $ |