Grundlæggende statistik
| Institutionelle aktier (lange) | 204.877.748 - 59,29% (ex 13D/G) - change of -41,49MM shares -16,84% MRQ |
| Institutionel værdi (lang) | $ 2.485.541 USD ($1000) |
Institutionelt ejerskab og aktionærer
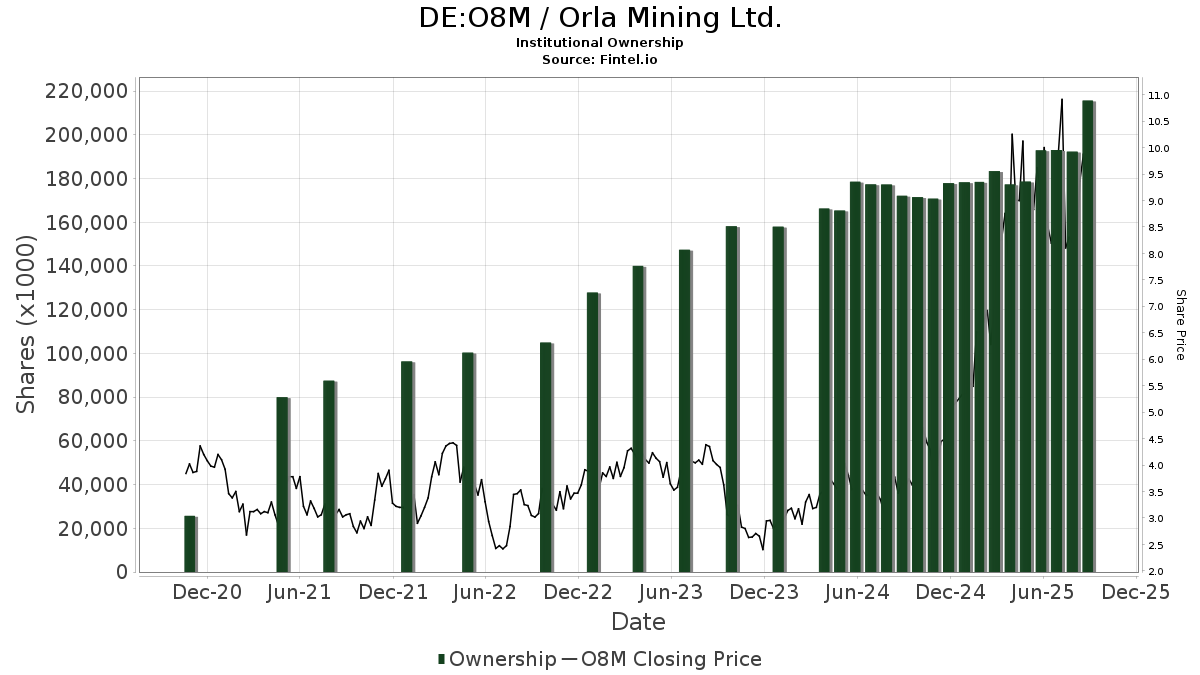
Orla Mining Ltd. (DE:O8M) har 196 institutionelle ejere og aktionærer, der har indsendt 13D/G- eller 13F-formularer til Securities Exchange Commission (SEC). Disse institutioner har i alt 204,877,748 aktier. Største aktionærer omfatter Fmr Llc, Fairfax Financial Holdings Ltd/ Can, Van Eck Associates Corp, Vanguard Group Inc, Connor, Clark & Lunn Investment Management Ltd., Franklin Resources Inc, Royal Bank Of Canada, Merk Investments LLC, First Eagle Investment Management, LLC, and Amundi .
Orla Mining Ltd. (DB:O8M) institutionel ejerskabsstruktur viser aktuelle positioner i virksomheden efter institutioner og fonde, samt seneste ændringer i positionsstørrelse. Større aktionærer kan omfatte individuelle investorer, investeringsforeninger, hedgefonde eller institutioner. Skema 13D angiver, at investoren besidder (eller besidder) mere end 5 % af virksomheden og har til hensigt (eller har til hensigt at) aktivt at forfølge en ændring i forretningsstrategi. Skema 13G indikerer en passiv investering på over 5%.
The share price as of April 23, 2026 is 12,30 / share. Previously, on April 28, 2025, the share price was 9,22 / share. This represents an increase of 33,35% over that period.
Fondens stemningsscore
Fund Sentiment Score (fka Ownership Accumulation Score) finder de aktier, der bliver mest købt af fonde. Det er resultatet af en sofistikeret, multi-faktor kvantitativ model, der identificerer virksomheder med de højeste niveauer af institutionel akkumulering. Scoringsmodellen bruger en kombination af den samlede stigning i oplyste ejere, ændringerne i porteføljeallokeringer i disse ejere og andre målinger. Tallet går fra 0 til 100, hvor højere tal indikerer et højere niveau af akkumulering for sine jævnaldrende, og 50 er gennemsnittet.
Opdateringsfrekvens: Dagligt
Se Ownership Explorer, som giver en liste over højest rangerende virksomheder.
AI+ Ask Fintel’s AI assistant about Orla Mining Ltd..
Select a question to share a public post with an AI-crafted answer.
Thinking of good questions…
13F og NPORT arkivering
Detaljer om 13F-arkivering er gratis. Detaljer om NP-ansøgninger kræver et premium-medlemskab. Grønne rækker angiver nye positioner. Røde rækker angiver lukkede positioner. Klik på linket ikon for at se den fulde transaktionshistorik.
Opgrader
for at låse premium-data op og eksportere til Excel ![]() .
.
| Fil dato | Kilde | Investor | Type | Gennemsnitlig pris (Øst) |
Aktier | Δ Aktier (%) |
Rapporteret Værdi ($1000) |
Δ Værdi (%) |
Port Alloc (%) |
|
|---|---|---|---|---|---|---|---|---|---|---|
| 2026-02-12 | 13F | Sprott Inc. | 45.822 | 1,77 | 617 | 26,95 | ||||
| 2026-04-15 | 13F | Addenda Capital Inc. | 28.440 | 636 | ||||||
| 2026-02-17 | 13F | Ancora Advisors, LLC | 3.180 | 0,00 | 43 | 23,53 | ||||
| 2026-02-13 | 13F | Financial Sense Advisors, Inc. | 146.661 | 1.976 | ||||||
| 2026-02-13 | 13F | Marshall Wace, Llp | 0 | -100,00 | 0 | |||||
| 2026-02-11 | 13F | Tacita Capital Inc | 66.483 | 0,00 | 895 | 24,69 | ||||
| 2026-02-17 | 13F | Guggenheim Capital Llc | 285.793 | -5,16 | 3.850 | 18,29 | ||||
| 2026-02-09 | 13F | Catalyst Funds Management Pty Ltd | 0 | -100,00 | 0 | |||||
| 2026-02-13 | 13F | Global Strategic Management Inc | 96.700 | 1 | ||||||
| 2026-02-17 | 13F | Amundi | 4.688.828 | -0,68 | 63.159 | 15,93 | ||||
| 2026-02-09 | 13F | Waratah Capital Advisors Ltd. | 0 | -100,00 | 0 | |||||
| 2025-11-14 | 13F | Cubist Systematic Strategies, LLC | 696.495 | 7.521 | ||||||
| 2026-02-12 | 13F | Groupe la Francaise | 700.000 | 4,48 | 9.412 | 30,13 | ||||
| 2026-02-13 | 13F | Morgan Stanley | 1.162.437 | -2,52 | 15.658 | 21,59 | ||||
| 2025-11-14 | 13F | Ubs Asset Management Americas Inc | 0 | -100,00 | 0 | |||||
| 2026-02-13 | 13F | Entropy Technologies, LP | 40.987 | 87,91 | 552 | 134,89 | ||||
| 2025-11-13 | 13F | Banque Cantonale Vaudoise | 0 | -100,00 | 0 | |||||
| 2026-02-12 | 13F | Skopos Labs, Inc. | 0 | -100,00 | 0 | |||||
| 2026-02-17 | 13F | Lighthouse Investment Partners, LLC | 99.866 | 1.344 | ||||||
| 2026-04-22 | 13F | Quattro Financial Advisors Llc | 214.015 | 0,00 | 3.452 | 19,78 | ||||
| 2026-02-10 | 13F | Td Asset Management Inc | 3.930.398 | 11,01 | 52.931 | 38,57 | ||||
| 2026-02-17 | 13F | Graham Capital Management, L.P. | 13.752 | 185 | ||||||
| 2026-02-19 | 13F | Invesco Ltd. | 3.539.392 | 994,69 | 47.676 | 1.265,65 | ||||
| 2026-04-16 | 13F | XML Financial, LLC | 39.300 | 8,26 | 634 | 29,71 | ||||
| 2026-02-17 | 13F | SIG North Trading, ULC | 79.947 | 241,74 | 1.077 | 326,98 | ||||
| 2026-02-17 | 13F | MIRAE ASSET GLOBAL ETFS HOLDINGS Ltd. | 223.989 | 42,04 | 3.016 | 77,31 | ||||
| 2026-02-17 | 13F | SIG North Trading, ULC | Put | 90.000 | 107,37 | 1.212 | 158,97 | |||
| 2026-02-17 | 13F | Moore Capital Management, Lp | 0 | -100,00 | 0 | |||||
| 2026-02-17 | 13F | SIG North Trading, ULC | Call | 291.600 | 47,72 | 3.928 | 84,28 | |||
| 2026-02-13 | 13F | Public Sector Pension Investment Board | 0 | -100,00 | 0 | |||||
| 2026-04-02 | 13F | Byrne Asset Management LLC | 900 | 15 | ||||||
| 2026-04-16 | 13F | Everstar Asset Management, LLC | 11.444 | -23,71 | 184 | -8,91 | ||||
| 2026-01-14 | 13F | Net Worth Advisory Group | 15.509 | 4,29 | 209 | 30,00 | ||||
| 2026-02-12 | 13F | Hollencrest Capital Management | 1.680 | -21,27 | 23 | -4,35 | ||||
| 2026-02-17 | 13F | Brevan Howard Capital Management LP | 0 | -100,00 | 0 | |||||
| 2026-02-17 | 13F | Parvin Asset Management, LLC | 70.500 | 1,18 | 950 | 26,20 | ||||
| 2026-02-11 | 13F | O'shaughnessy Asset Management, Llc | 178.055 | -30,36 | 2.398 | -13,08 | ||||
| 2026-01-29 | 13F | Vanguard Group Inc | 8.202.861 | 152,08 | 110.320 | 214,36 | ||||
| 2026-04-20 | 13F | Ronald Blue Trust, Inc. | 661 | 0,00 | 11 | 25,00 | ||||
| 2026-02-05 | 13F | Gabelli Funds Llc | 1.882.700 | 67,23 | 25.360 | 108,58 | ||||
| 2026-02-18 | 13F | State of Tennessee, Treasury Department | 19.208 | 290 | ||||||
| 2026-04-23 | 13F | Merrion Investment Management Co, LLC | 0 | -100,00 | 0 | |||||
| 2026-02-17 | 13F | Quantessence Capital LLC | 0 | -100,00 | 0 | |||||
| 2026-04-20 | 13F | CWA Asset Management Group, LLC | 2.299.644 | -31,80 | 37.093 | -18,33 | ||||
| 2026-02-10 | 13F | Norges Bank | 2.584.183 | 34.756 | ||||||
| 2026-02-13 | 13F | Wexford Capital Lp | 29.988 | 96,12 | 403 | 145,73 | ||||
| 2026-02-13 | 13F | Barclays Plc | 596.005 | 127,11 | 8.028 | 183,27 | ||||
| 2026-02-10 | 13F | State of Wyoming | 6.407 | -82,35 | 86 | -78,06 | ||||
| 2026-02-17 | 13F | Engineers Gate Manager LP | 18.761 | 32,16 | 253 | 64,71 | ||||
| 2026-02-17 | 13F | Angeles Wealth Management, Llc | 13.576 | 183 | ||||||
| 2026-02-13 | 13F | Victory Capital Management Inc | 316.166 | 0,00 | 4.259 | 24,72 | ||||
| 2026-02-13 | 13F | JustInvest LLC | 16.888 | 11,53 | 227 | 39,26 | ||||
| 2026-02-05 | 13F | Gamco Investors, Inc. Et Al | 82.945 | 27,32 | 1.117 | 58,89 | ||||
| 2026-02-13 | 13F | Mudita Advisors LLP | 1.440.000 | 2,86 | 19.395 | 28,28 | ||||
| 2026-02-03 | 13F | SBI Securities Co., Ltd. | 4.672 | 67,88 | 63 | 106,67 | ||||
| 2026-02-13 | 13F | Great West Life Assurance Co /can/ | 32.112 | -59,49 | 0 | |||||
| 2026-02-09 | 13F | Legal & General Group Plc | 327.610 | -35,50 | 4.412 | -19,49 | ||||
| 2026-02-17 | 13F | Jones Financial Companies Lllp | 136 | 2 | ||||||
| 2026-02-17 | 13F | XTX Topco Ltd | 33.292 | -2,67 | 448 | 21,41 | ||||
| 2026-02-13 | 13F | Dynamic Technology Lab Private Ltd | 0 | -100,00 | 0 | |||||
| 2026-02-17 | 13F | Public Employees Retirement System Of Ohio | 81.007 | 9,65 | 1.091 | 36,76 | ||||
| 2026-02-17 | 13F | Fmr Llc | 38.466.102 | 2,73 | 517.347 | 28,10 | ||||
| 2026-01-15 | 13F | Allspring Global Investments Holdings, LLC | 1.562.500 | 29,29 | 21.015 | 61,27 | ||||
| 2026-01-29 | 13F | Sanctuary Advisors, LLC | 18.274 | -47,96 | 246 | -35,09 | ||||
| 2026-01-29 | 13F | IMC-Chicago, LLC | Put | 45.500 | 130,96 | 613 | 188,68 | |||
| 2026-01-29 | 13F | IMC-Chicago, LLC | Call | 76.200 | 290,77 | 1.026 | 388,57 | |||
| 2026-04-17 | 13F | Anchyra Partners Llc | 14.044 | 0,31 | 227 | 20,21 | ||||
| 2026-04-24 | 13F | Vision Financial Markets Llc | 119 | 0,00 | 2 | 0,00 | ||||
| 2026-02-17 | 13F | Numerai GP LLC | 0 | -100,00 | 0 | |||||
| 2026-02-17 | 13F | Longaeva Partners L.P. | 0 | -100,00 | 0 | |||||
| 2026-01-29 | 13F | Montrusco Bolton Investments Inc. | 1.071.537 | 14.430 | ||||||
| 2026-02-17 | 13F | Jump Financial, LLC | 0 | -100,00 | 0 | |||||
| 2026-02-18 | 13F | Kitching Partners, Llc | 0 | -100,00 | 0 | |||||
| 2026-02-23 | 13F | Virtu Financial LLC | 11.893 | 0 | ||||||
| 2026-01-29 | 13F | UBS Group AG | 805.388 | 343,11 | 10.849 | 452,91 | ||||
| 2026-02-17 | 13F | Balyasny Asset Management Llc | 419.921 | -67,85 | 5.649 | -59,91 | ||||
| 2026-02-11 | 13F | Jpmorgan Chase & Co | 127.766 | 21.337,25 | 1.721 | 28.583,33 | ||||
| 2026-02-11 | 13F | Erste Asset Management GmbH | 60.850 | 832 | ||||||
| 2026-02-17 | 13F | Royal Bank Of Canada | Call | 327.000 | 4.405 | |||||
| 2026-02-10 | 13F | CIBC World Markets Inc. | 257.888 | 146,45 | 3.469 | 207,45 | ||||
| 2026-02-17 | 13F | Keebeck Alpha, LP | 15.742 | -63,27 | 212 | -54,11 | ||||
| 2026-02-17 | 13F | Royal Bank Of Canada | 6.292.197 | 54,58 | 84.756 | 92,79 | ||||
| 2026-02-18 | 13F | Mackenzie Financial Corp | 872.290 | 411,75 | 11.860 | 545,27 | ||||
| 2026-01-26 | 13F | La Banque Postale Asset Management SA | 17.758 | 239 | ||||||
| 2026-02-09 | 13F | Frazier Financial Advisors, LLC | 78 | 1 | ||||||
| 2026-02-09 | 13F | GeoSphere Capital Management | 0 | -100,00 | 0 | |||||
| 2026-02-04 | 13F | BCJ Capital Management, LLC | 0 | -100,00 | 0 | |||||
| 2026-02-13 | 13F | Quarry LP | 539 | 7 | ||||||
| 2026-02-17 | 13F | Tower Research Capital LLC (TRC) | 32 | -99,48 | 0 | -100,00 | ||||
| 2026-02-17 | 13F | Two Sigma Advisers, Lp | 0 | -100,00 | 0 | |||||
| 2026-04-13 | 13F | Nvest Wealth Strategies, Inc. | 1.431 | 0,00 | 23 | 21,05 | ||||
| 2026-02-09 | 13F | Themes Management Co LLC | 45.798 | 616 | ||||||
| 2026-02-12 | 13F | Hohimer Wealth Management, Llc | 0 | -100,00 | 0 | |||||
| 2026-02-27 | 13F | Groupama Asset Managment | 444.142 | 37,97 | 8.199 | 69,70 | ||||
| 2026-02-10 | 13F/A | Northwestern Mutual Wealth Management Co | 58 | 1 | ||||||
| 2026-04-22 | 13F | Pictet Asset Management Holding SA | 61.609 | 10,10 | 988 | 31,08 | ||||
| 2026-01-20 | 13F | Stratos Wealth Advisors, LLC | 81.185 | 0,00 | 1.094 | 24,77 | ||||
| 2026-02-17 | 13F | SummitTX Capital, L.P. | 0 | -100,00 | 0 | |||||
| 2026-02-06 | 13F/A | Rathbone Brothers plc | 21.950 | -38,94 | 296 | -23,97 | ||||
| 2026-02-10 | 13F | Acadian Asset Management Llc | 88.400 | 1 | ||||||
| 2026-04-13 | 13F | Salem Investment Counselors Inc | 9.200 | 148 | ||||||
| 2026-02-17 | 13F | Scientech Research LLC | 14.512 | 195 | ||||||
| 2026-02-04 | 13F | Dogwood Wealth Management LLC | 0 | -100,00 | 0 | |||||
| 2025-11-17 | 13F | PDT Partners, LLC | 0 | -100,00 | 0 | |||||
| 2026-02-17 | 13F | Edmond De Rothschild Holding S.a. | 288.264 | 12,36 | 3.886 | 40,54 | ||||
| 2026-02-13 | 13F | Wells Fargo & Company/mn | 2.039 | 0,00 | 27 | 22,73 | ||||
| 2026-02-06 | 13F | EverSource Wealth Advisors, LLC | 79 | 1 | ||||||
| 2026-02-13 | 13F | Evelyn Partners Investment Management LLP | 2.029 | 0,00 | 27 | 28,57 | ||||
| 2026-02-13 | 13F | National Bank Of Canada /fi/ | 627.292 | 7,27 | 8.327 | 32,43 | ||||
| 2026-03-06 | 13F | Hsbc Holdings Plc | 0 | -100,00 | 0 | |||||
| 2026-01-27 | 13F | TD Waterhouse Canada Inc. | 5.313 | 196,98 | 71 | 288,89 | ||||
| 2025-11-14 | 13F | Aigen Investment Management, Lp | 0 | -100,00 | 0 | |||||
| 2026-02-17 | 13F | Weiss Asset Management LP | 0 | -100,00 | 0 | -100,00 | ||||
| 2026-02-17 | 13F | Janus Henderson Group Plc | 712.500 | 9.577 | ||||||
| 2026-02-17 | 13F | Qube Research & Technologies Ltd | 108.270 | -74,77 | 1.458 | -68,54 | ||||
| 2026-02-17 | 13F | Prelude Capital Management, Llc | 15.742 | -63,27 | 212 | -54,11 | ||||
| 2026-02-11 | 13F | Franklin Resources Inc | 7.686.849 | 0,98 | 103.386 | 25,96 | ||||
| 2026-02-12 | 13F | Amitell Capital Pte Ltd | 0 | -100,00 | 0 | |||||
| 2026-02-17 | 13F | Voloridge Investment Management, Llc | 0 | -100,00 | 0 | |||||
| 2026-02-12 | 13F | Campbell & CO Investment Adviser LLC | 57.172 | 770 | ||||||
| 2026-02-17 | 13F | Susquehanna Advisors Group, Inc. | 119.100 | 1.604 | ||||||
| 2026-03-12 | 13F/A | Peak6 Llc | Call | 57.500 | 17,11 | 775 | 46,04 | |||
| 2026-02-06 | 13F | HighTower Advisors, LLC | 24.234 | -36,44 | 326 | -20,68 | ||||
| 2026-02-11 | 13F | Fiera Capital Corp | 539.966 | -16,11 | 7.265 | 4,68 | ||||
| 2026-02-17 | 13F | Toronto Dominion Bank | 141.389 | 100,28 | 1.902 | 149,80 | ||||
| 2026-02-17 | 13F | Toronto Dominion Bank | Put | 6.000 | 81 | |||||
| 2026-01-28 | 13F | U S Global Investors Inc | 0 | -100,00 | 0 | |||||
| 2026-02-17 | 13F | Jain Global LLC | 34.930 | 12,16 | 470 | 40,30 | ||||
| 2026-02-17 | 13F | Millennium Management Llc | 3.873.626 | -57,28 | 52.119 | -46,72 | ||||
| 2026-02-11 | 13F | Cerity Partners LLC | 12.750 | 0,00 | 172 | 24,82 | ||||
| 2026-02-12 | 13F | Counterpoint Mutual Funds LLC | 37.941 | -28,13 | 355 | 21,23 | ||||
| 2026-02-13 | 13F | Van Eck Associates Corp | 19.391.604 | 279,92 | 261 | 374,55 | ||||
| 2026-02-13 | 13F | Walleye Capital LLC | 997.235 | 77,96 | 13.433 | 121,98 | ||||
| 2026-02-17 | 13F | ExodusPoint Capital Management, LP | 0 | -100,00 | 0 | -100,00 | ||||
| 2025-11-12 | 13F | HAP Trading, LLC | Put | 18.800 | 0 | |||||
| 2026-04-02 | 13F | Marex Group plc | 0 | -100,00 | 0 | -100,00 | ||||
| 2026-04-21 | 13F | Decker Retirement Planning Inc. | 38 | 1 | ||||||
| 2026-02-06 | 13F | Leonteq Securities AG | 90.259 | 143,94 | 1.214 | 204,01 | ||||
| 2026-02-13 | 13F | Merk Investments LLC | 6.200.000 | 0,00 | 83.514 | 24,72 | ||||
| 2026-02-17 | 13F | D. E. Shaw & Co., Inc. | Call | 150.000 | 0,00 | 2.018 | 24,74 | |||
| 2026-02-11 | 13F | Picton Mahoney Asset Management | 37.884 | 510 | ||||||
| 2025-11-12 | 13F | Forge First Asset Management Inc. | 100.000 | 1.079 | ||||||
| 2026-02-12 | 13F | Jane Street Group, Llc | Call | 55.200 | 363,87 | 744 | 480,47 | |||
| 2026-02-17 | 13F | D. E. Shaw & Co., Inc. | 3.329.213 | 130,79 | 44.791 | 187,98 | ||||
| 2025-11-14 | 13F | Point72 (DIFC) Ltd | 31.317 | 338 | ||||||
| 2026-02-12 | 13F | Jane Street Group, Llc | 2.521.486 | -55,13 | 33.964 | -44,04 | ||||
| 2026-02-17 | 13F | D. E. Shaw & Co., Inc. | Put | 300.000 | 0,00 | 4.035 | 24,77 | |||
| 2026-02-17 | 13F | Quadrature Capital Ltd | 160.100 | 2.156 | ||||||
| 2026-02-13 | 13F | Verition Fund Management LLC | 0 | -100,00 | 0 | |||||
| 2026-02-17 | 13F | Citadel Advisors Llc | Put | 358.700 | -40,29 | 4.832 | -25,53 | |||
| 2026-02-12 | 13F | Jane Street Group, Llc | Put | 64.500 | 145,25 | 869 | 205,63 | |||
| 2026-02-17 | 13F | Citadel Advisors Llc | Call | 92.800 | 77,78 | 1.250 | 122,02 | |||
| 2026-02-13 | 13F | Clear Street Group Inc. | 0 | -100,00 | 0 | |||||
| 2026-01-27 | 13F | WealthCollab, LLC | 0 | -100,00 | 0 | |||||
| 2026-02-17 | 13F | Aquatic Capital Management LLC | 174.973 | 189,64 | 2.357 | 261,35 | ||||
| 2026-02-10 | 13F | CIBC Asset Management Inc | 327.826 | 17,45 | 4.412 | 46,74 | ||||
| 2026-02-13 | 13F | Alberta Investment Management Corp | 0 | -100,00 | 0 | |||||
| 2026-02-17 | 13F | Point72 Asset Management, L.P. | 299.027 | 4.025 | ||||||
| 2026-02-17 | 13F | DZ BANK AG Deutsche Zentral Genossenschafts Bank, Frankfurt am Main | 1.016.354 | -16,44 | 13.690 | 4,38 | ||||
| 2026-02-17 | 13F | FIL Ltd | 3.750.000 | 87,50 | 50.435 | 133,82 | ||||
| 2026-04-17 | 13F | PKO Investment Management Joint-Stock Co | 121.748 | 7,93 | 1.954 | 28,57 | ||||
| 2026-02-17 | 13F | Man Group plc | 183.400 | -2,52 | 2.470 | 21,69 | ||||
| 2026-02-12 | 13F | CIBC Private Wealth Group, LLC | 2.500 | 0,00 | 34 | 22,22 | ||||
| 2026-02-12 | 13F | StoneX Group Inc. | 0 | -100,00 | 0 | |||||
| 2026-02-13 | 13F | Carmignac Gestion | 0 | -100,00 | 0 | |||||
| 2026-02-04 | 13F | Swiss Life Asset Management Ltd | 27.859 | 111,58 | 375 | 163,38 | ||||
| 2026-02-17 | 13F | Susquehanna International Group, Llp | 0 | -100,00 | 0 | |||||
| 2025-11-12 | 13F | 111 Capital | 0 | -100,00 | 0 | |||||
| 2025-11-07 | 13F | Cumberland Partners Ltd | 0 | -100,00 | 0 | |||||
| 2025-11-14 | 13F | Capula Management Ltd | 0 | -100,00 | 0 | |||||
| 2026-02-17 | 13F | Investment Management Corp of Ontario | 32.488 | 438 | ||||||
| 2026-02-17 | 13F | Citadel Advisors Llc | 592.548 | -42,21 | 7.982 | -27,92 | ||||
| 2026-04-15 | 13F | Covea Finance | 642.600 | -20,83 | 10.316 | -5,73 | ||||
| 2026-02-05 | 13F | Allworth Financial LP | 20 | -96,75 | 0 | -100,00 | ||||
| 2026-04-24 | 13F | Innova Wealth Partners | 20.757 | 14,19 | 335 | 36,89 | ||||
| 2026-02-13 | 13F | Neuberger Berman Group LLC | 94.435 | 606,11 | 1.272 | 782,64 | ||||
| 2026-02-06 | 13F | Pnc Financial Services Group, Inc. | 287 | 4 | ||||||
| 2026-02-12 | 13F | Scotia Capital Inc. | 23.121 | 11,30 | 307 | 37,67 | ||||
| 2026-02-13 | 13F | Mariner, LLC | 14.929 | 15,26 | 201 | 44,60 | ||||
| 2026-02-17 | 13F | Gotham Asset Management, LLC | 23.998 | 0,52 | 323 | 25,68 | ||||
| 2026-02-13 | 13F | Citigroup Inc | 4.960 | -59,45 | 67 | -49,62 | ||||
| 2026-02-13 | 13F | Charles Schwab Investment Management Inc | 416.003 | 160,08 | 5.602 | 224,75 | ||||
| 2026-02-06 | 13F | Profund Advisors Llc | 27.234 | -12,95 | 367 | 8,61 | ||||
| 2026-02-12 | 13F | Renaissance Technologies Llc | 1.042.199 | 44,79 | 14.038 | 80,60 | ||||
| 2026-02-13 | 13F | Flow Traders U.s. Llc | 12.319 | 0 | ||||||
| 2026-02-06 | 13F | FourThought Financial Partners, LLC | 0 | -100,00 | 0 | |||||
| 2026-02-12 | 13F | Federation des caisses Desjardins du Quebec | 256.885 | -6,53 | 3.425 | 15,87 | ||||
| 2026-02-10 | 13F | Jupiter Asset Management Ltd | 2.770.161 | -0,76 | 37.306 | 23,89 | ||||
| 2026-02-11 | 13F | Simplex Trading, Llc | Put | 49.800 | 6,87 | 671 | ||||
| 2026-02-11 | 13F | Simplex Trading, Llc | Call | 62.300 | 291,82 | 839 | ||||
| 2026-02-17 | 13F | Tudor Investment Corp Et Al | 92.911 | 29,28 | 1.252 | 61,21 | ||||
| 2026-02-05 | 13F | Bessemer Group Inc | 81.500 | 0,00 | 1 | |||||
| 2026-02-11 | 13F | Group One Trading, L.p. | Put | 27.700 | 3,75 | 373 | 29,51 | |||
| 2026-02-12 | 13F | Brogan Financial, Inc. | 12.626 | 0,00 | 170 | 25,00 | ||||
| 2026-02-11 | 13F | BLI - Banque de Luxembourg Investments | 2.130.000 | 57,78 | 28.608 | 96,36 | ||||
| 2026-02-11 | 13F | Group One Trading, L.p. | Call | 98.300 | 686,40 | 1.324 | 880,74 | |||
| 2026-02-17 | 13F | Schonfeld Strategic Advisors LLC | 0 | -100,00 | 0 | |||||
| 2026-02-09 | 13F | Harbour Investments, Inc. | 4 | 0 | ||||||
| 2026-02-12 | 13F | BlackRock, Inc. | 54.745 | 3,41 | 737 | 29,07 | ||||
| 2026-02-13 | 13F | Arrowstreet Capital, Limited Partnership | 1.194.066 | 40,54 | 16.068 | 75,20 | ||||
| 2026-02-18 | 13F | Vident Advisory, LLC | 34.398 | 463 | ||||||
| 2026-02-13 | 13F | Y-Intercept (Hong Kong) Ltd | 0 | -100,00 | 0 | |||||
| 2026-02-11 | 13F | Prudential Plc | 25.692 | 346 | ||||||
| 2026-02-13 | 13F | Parkside Financial Bank & Trust | 87 | 0,00 | 1 | |||||
| 2026-02-10 | 13F | PCJ Investment Counsel Ltd. | 517.480 | 108,19 | 6.960 | 159,66 | ||||
| 2026-04-16 | 13F | SG Americas Securities, LLC | 11.070 | 0 | ||||||
| 2026-02-14 | 13F | Rockefeller Capital Management L.P. | 500 | 66,67 | 7 | 100,00 | ||||
| 2026-02-13 | 13F | American Century Companies Inc | 1.493.208 | 66,86 | 20.083 | 108,08 | ||||
| 2026-02-17 | 13F | Advisor Group Holdings, Inc. | 47.399 | 428,53 | 638 | 551,02 | ||||
| 2026-01-28 | 13F | CAPROCK Group, Inc. | 28.513 | 1,61 | 384 | 23,87 | ||||
| 2026-02-10 | 13F | Avestar Capital, LLC | 42.600 | 0,00 | 574 | 24,57 | ||||
| 2026-02-10 | 13F | Bnp Paribas Arbitrage, Sa | 459.365 | -4,09 | 6.188 | 19,62 | ||||
| 2026-04-07 | 13F | Farther Finance Advisors, LLC | 26 | 0 | ||||||
| 2026-02-17 | 13F | Ewing Morris & Co. Investment Partners Ltd. | 71.000 | 0,00 | 968 | 26,41 | ||||
| 2026-02-12 | 13F | Northwest & Ethical Investments L.P. | 13.690 | 23,11 | 184 | 54,62 | ||||
| 2025-11-13 | 13F | Spark Investment Management LLC | 0 | -100,00 | 0 | -100,00 | ||||
| 2026-04-16 | 13F | Brookstone Capital Management | 0 | -100,00 | 0 | |||||
| 2026-01-29 | 13F | IMC-Chicago, LLC | 0 | -100,00 | 0 | -100,00 | ||||
| 2026-02-11 | 13F | Deutsche Bank Ag\ | 1.580.696 | 23,69 | 21.292 | 54,26 | ||||
| 2026-02-13 | 13F | Stifel Financial Corp | 0 | -100,00 | 0 | |||||
| 2026-02-13 | 13F | BRITISH COLUMBIA INVESTMENT MANAGEMENT Corp | 140.774 | -4,66 | 1.893 | 18,91 | ||||
| 2026-02-17 | 13F | Bank Of America Corp /de/ | 1.626.130 | 74,88 | 21.904 | 118,11 | ||||
| 2026-02-10 | 13F | Goldman Sachs Group Inc | 274.656 | -86,63 | 3.700 | -83,32 | ||||
| 2026-02-12 | 13F | Hrt Financial Lp | 0 | -100,00 | 0 | |||||
| 2026-02-10 | 13F | Connor, Clark & Lunn Investment Management Ltd. | 7.692.670 | 6,08 | 103.473 | 32,33 | ||||
| 2026-02-11 | 13F | LPL Financial LLC | 60.549 | 816 | ||||||
| 2026-02-10 | 13F | Quantbot Technologies LP | 0 | -100,00 | 0 | |||||
| 2025-11-07 | 13F | Shell Asset Management Co | 3.356 | -73,83 | 0 | |||||
| 2026-02-17 | 13F | Cantor Fitzgerald, L. P. | 0 | -100,00 | 0 | -100,00 | ||||
| 2026-02-17 | 13F | Russell Investments Group, Ltd. | 61.912 | 252,51 | 834 | 340,74 | ||||
| 2026-02-12 | 13F | Dimensional Fund Advisors Lp | 118.066 | -89,11 | 1.590 | -86,42 | ||||
| 2025-11-14 | 13F | Northern Trust Corp | 0 | -100,00 | 0 | -100,00 | ||||
| 2026-02-17 | 13F | Ninepoint Partners LP | 222.500 | 27,14 | 2.997 | 58,57 | ||||
| 2026-02-17 | 13F | Susquehanna International Group, Llp | Put | 223.600 | 29,92 | 3.012 | 62,06 | |||
| 2026-02-17 | 13F | Susquehanna International Group, Llp | Call | 916.700 | 1.988,15 | 12.348 | 2.504,85 | |||
| 2025-11-14 | 13F | Wolverine Trading, Llc | Call | 66.400 | 46,26 | 720 | 65,90 | |||
| 2025-11-14 | 13F | Wolverine Trading, Llc | Put | 11.700 | 127 | |||||
| 2026-04-13 | 13F | IFP Advisors, Inc | 3.515 | -4,87 | 57 | 14,29 | ||||
| 2026-01-27 | 13F | Zurcher Kantonalbank (Zurich Cantonalbank) | 93.333 | 38,69 | 1.257 | 73,24 | ||||
| 2026-02-17 | 13F | Two Sigma Investments, Lp | 296.591 | -31,58 | 3.995 | -14,65 | ||||
| 2026-02-17 | 13F | Fairfax Financial Holdings Ltd/ Can | 31.817.229 | -44,00 | 423.611 | -30,61 | ||||
| 2026-04-14 | 13F | Nbc Securities, Inc. | 700 | 0,00 | 11 | 22,22 | ||||
| 2026-02-11 | 13F | Group One Trading, L.p. | 0 | -100,00 | 0 | -100,00 | ||||
| 2026-02-12 | 13F | Nuveen, LLC | 226.059 | 0,00 | 3.044 | 24,86 | ||||
| 2026-02-11 | 13F | Simplex Trading, Llc | 0 | -100,00 | 0 | |||||
| 2025-11-14 | 13F | Wolverine Trading, Llc | 20.787 | 93,62 | 226 | 120,59 | ||||
| 2025-10-27 | 13F | Kiker Wealth Management, LLC | 0 | -100,00 | 0 | |||||
| 2026-02-13 | 13F | Manufacturers Life Insurance Company, The | 0 | -100,00 | 0 | |||||
| 2026-04-14 | 13F | Baldwin Brothers Inc/ma | 29.720 | 0,00 | 476 | 19,00 | ||||
| 2026-02-12 | 13F | Robotti Robert | 15.000 | 0,00 | 162 | 0,00 | ||||
| 2026-02-04 | 13F | First Eagle Investment Management, LLC | 4.769.471 | -29,02 | 64.148 | -11,47 | ||||
| 2026-04-20 | 13F | Concurrent Investment Advisors, LLC | 0 | -100,00 | 0 | -100,00 | ||||
| 2026-02-12 | 13F | Swiss National Bank | 601.700 | 1,02 | 8.109 | 26,19 | ||||
| 2026-02-13 | 13F | Goehring & Rozencwajg Associates, LLC | 777.949 | -34,22 | 10.464 | -17,95 | ||||
| 2025-11-10 | 13F | Hillsdale Investment Management Inc. | 0 | -100,00 | 0 | -100,00 | ||||
| 2026-02-05 | 13F | Phoenix Holdings Ltd. | 0 | -100,00 | 0 | |||||
| 2026-04-24 | 13F | Triasima Portfolio Management inc. | 249.877 | 16,91 | 4.005 | 39,16 | ||||
| 2026-02-17 | 13F | Raymond James Financial Inc | 24.746 | 121,24 | 333 | 177,50 | ||||
| 2026-01-21 | 13F/A | Euro Pacific Asset Management, LLC | 867.495 | 159,44 | 11 | 266,67 | ||||
| 2026-02-17 | 13F | Alliancebernstein L.p. | 240.238 | -14,50 | 3.236 | 6,66 | ||||
| 2026-01-14 | 13F | ORG Partners LLC | 110 | 1 | ||||||
| 2026-02-13 | 13F | Formula Growth Ltd | 182.000 | 2.452 | ||||||
| 2026-02-09 | 13F | Geode Capital Management, Llc | 205.626 | 54,59 | 2.817 | 95,28 | ||||
| 2026-04-20 | 13F | Ritholtz Wealth Management | 55.331 | 8,00 | 892 | 29,28 | ||||
| 2026-02-12 | 13F | Bank Of Montreal /can/ | 1.587.968 | -19,56 | 21.358 | 0,34 | ||||
| 2026-02-02 | 13F | Intact Investment Management Inc. | 470.029 | -13,59 | 6.321 | 7,74 | ||||
| 2026-04-22 | 13F | Mindset Wealth Management, Llc | 18.733 | 302 | ||||||
| 2026-02-13 | 13F | Centiva Capital, LP | 0 | -100,00 | 0 | |||||
| 2026-02-13 | 13F | Wells Fargo & Company/mn | Call | 0 | -100,00 | 0 | -100,00 | |||
| 2026-02-13 | 13F | Caitong International Asset Management Co., Ltd | 2.162 | 29 | ||||||
| 2026-04-16 | 13F | Baron Wealth Management LLC | 12.480 | -28,90 | 201 | -14,83 | ||||
| 2026-04-07 | 13F | Estate Planners Group, LLC | 200 | 3 | ||||||
| 2025-11-14 | 13F | Point72 Asia (Singapore) Pte. Ltd. | 36.660 | 396 |