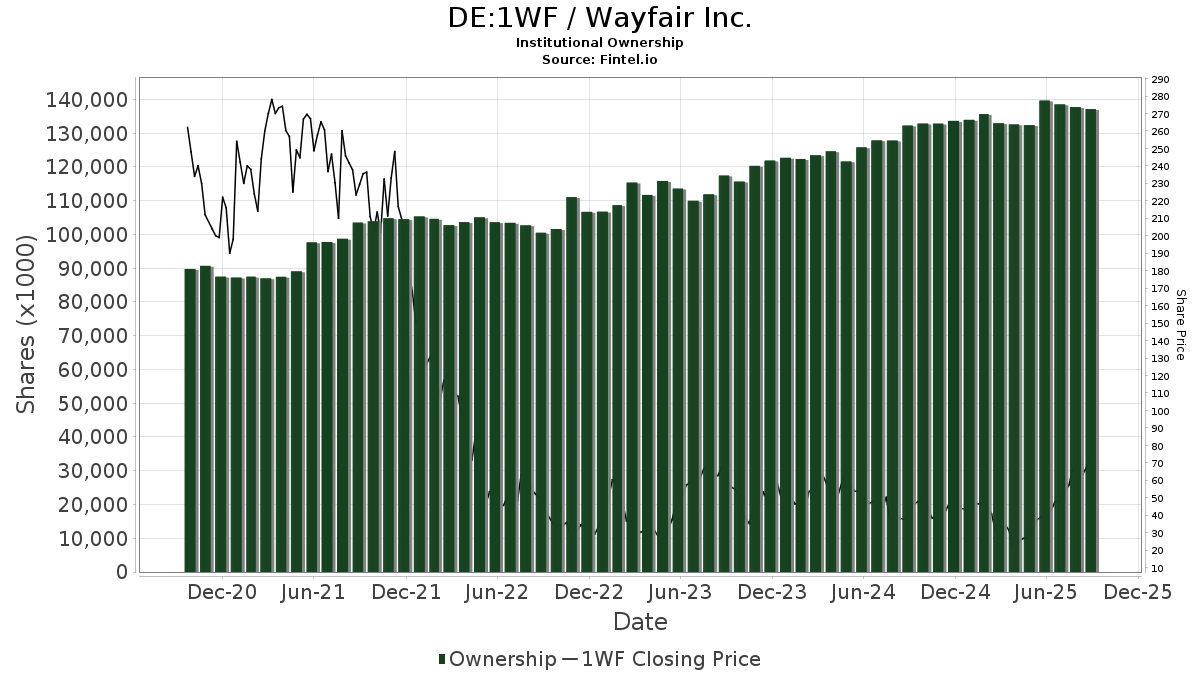
Grundlæggende statistik
| Institutionelle aktier (lange) | 122.300.297 - 112,43% (ex 13D/G) - change of -13,70MM shares -10,07% MRQ |
| Institutionel værdi (lang) | $ 12.013.210 USD ($1000) |
Institutionelt ejerskab og aktionærer
Wayfair Inc. (DE:1WF) har 472 institutionelle ejere og aktionærer, der har indsendt 13D/G- eller 13F-formularer til Securities Exchange Commission (SEC). Disse institutioner har i alt 122,300,297 aktier. Største aktionærer omfatter Fmr Llc, Capital World Investors, Vanguard Group Inc, Renaissance Technologies Llc, BlackRock, Inc., Jane Street Group, Llc, Baillie Gifford & Co, Janus Henderson Group Plc, Prescott General Partners LLC, and Arrowstreet Capital, Limited Partnership .
Wayfair Inc. (DB:1WF) institutionel ejerskabsstruktur viser aktuelle positioner i virksomheden efter institutioner og fonde, samt seneste ændringer i positionsstørrelse. Større aktionærer kan omfatte individuelle investorer, investeringsforeninger, hedgefonde eller institutioner. Skema 13D angiver, at investoren besidder (eller besidder) mere end 5 % af virksomheden og har til hensigt (eller har til hensigt at) aktivt at forfølge en ændring i forretningsstrategi. Skema 13G indikerer en passiv investering på over 5%.
The share price as of April 24, 2026 is 66,94 / share. Previously, on April 28, 2025, the share price was 27,02 / share. This represents an increase of 147,74% over that period.
Fondens stemningsscore
Fund Sentiment Score (fka Ownership Accumulation Score) finder de aktier, der bliver mest købt af fonde. Det er resultatet af en sofistikeret, multi-faktor kvantitativ model, der identificerer virksomheder med de højeste niveauer af institutionel akkumulering. Scoringsmodellen bruger en kombination af den samlede stigning i oplyste ejere, ændringerne i porteføljeallokeringer i disse ejere og andre målinger. Tallet går fra 0 til 100, hvor højere tal indikerer et højere niveau af akkumulering for sine jævnaldrende, og 50 er gennemsnittet.
Opdateringsfrekvens: Dagligt
Se Ownership Explorer, som giver en liste over højest rangerende virksomheder.
AI+ Ask Fintel’s AI assistant about Wayfair Inc..
Select a question to share a public post with an AI-crafted answer.
Thinking of good questions…
13F og NPORT arkivering
Detaljer om 13F-arkivering er gratis. Detaljer om NP-ansøgninger kræver et premium-medlemskab. Grønne rækker angiver nye positioner. Røde rækker angiver lukkede positioner. Klik på linket ikon for at se den fulde transaktionshistorik.
Opgrader
for at låse premium-data op og eksportere til Excel ![]() .
.
| Fil dato | Kilde | Investor | Type | Gennemsnitlig pris (Øst) |
Aktier | Δ Aktier (%) |
Rapporteret Værdi ($1000) |
Δ Værdi (%) |
Port Alloc (%) |
|
|---|---|---|---|---|---|---|---|---|---|---|
| 2026-04-07 | 13F | Central Pacific Bank - Trust Division | 450 | 34 | ||||||
| 2026-02-17 | 13F | Atom Investors LP | 28.783 | 2.890 | ||||||
| 2026-02-05 | 13F | Elyxium Wealth, LLC | 37 | 4 | ||||||
| 2026-02-05 | 13F | Bessemer Group Inc | 65 | 0,00 | 0 | |||||
| 2026-02-13 | 13F | Aigen Investment Management, Lp | 0 | -100,00 | 0 | |||||
| 2026-02-17 | 13F | Cetera Investment Advisers | 20.707 | 13,69 | 2.079 | 27,78 | ||||
| 2026-04-20 | 13F | Kestra Private Wealth Services, Llc | 0 | -100,00 | 0 | |||||
| 2026-02-13 | 13F | Bridgefront Capital, LLC | 0 | -100,00 | 0 | |||||
| 2026-02-17 | 13F | Guggenheim Capital Llc | 2.594 | -42,71 | 260 | -35,64 | ||||
| 2026-04-06 | 13F | CX Institutional | 160 | 0 | ||||||
| 2026-01-28 | 13F | CAPROCK Group, Inc. | 11.607 | 1.165 | ||||||
| 2026-02-17 | 13F | Strive Financial Group ,LLC | 126 | 13 | ||||||
| 2026-02-17 | 13F | Dv Equities, Llc | 0 | 0 | ||||||
| 2026-02-17 | 13F | Utah Retirement Systems | 5.194 | 3,34 | 522 | 16,29 | ||||
| 2025-11-12 | 13F | HAP Trading, LLC | Call | 574.000 | 16.131 | |||||
| 2025-11-12 | 13F | HAP Trading, LLC | Put | 42.500 | 8 | |||||
| 2026-02-17 | 13F | Amundi | 189.092 | 118,35 | 18.987 | 160,40 | ||||
| 2026-02-17 | 13F/A | Northwest & Ethical Investments L.P. | 2.400 | 242 | ||||||
| 2025-11-12 | 13F | HAP Trading, LLC | 59.630 | 5.327 | ||||||
| 2026-02-17 | 13F | Capstone Investment Advisors, Llc | 0 | -100,00 | 0 | -100,00 | ||||
| 2026-04-13 | 13F | Creative Financial Designs Inc /adv | 5 | 0,00 | 0 | |||||
| 2026-02-17 | 13F | Bayesian Capital Management, LP | 0 | -100,00 | 0 | |||||
| 2025-11-13 | 13F | Eisler Capital Management Ltd. | 0 | -100,00 | 0 | -100,00 | ||||
| 2025-11-14 | 13F | Glenview Capital Management, Llc | 0 | -100,00 | 0 | -100,00 | ||||
| 2026-02-13 | 13F | JustInvest LLC | 14.232 | 4,25 | 1.429 | 17,23 | ||||
| 2026-02-11 | 13F | Havemeyer Place LP | 392 | 39 | ||||||
| 2026-04-21 | 13F | Wedbush Securities Inc | 0 | -100,00 | 0 | |||||
| 2026-02-11 | 13F | Strategic Advocates LLC | 23 | 0,00 | 2 | 0,00 | ||||
| 2026-02-04 | 13F | Ameritas Advisory Services, LLC | 0 | -100,00 | 0 | |||||
| 2026-04-07 | 13F | Retirement Wealth Solutions LLC | 14 | -33,33 | 1 | -50,00 | ||||
| 2026-01-30 | 13F | R Squared Ltd | 0 | -100,00 | 0 | |||||
| 2026-02-17 | 13F | Lazard Asset Management Llc | 4.302 | 35,33 | 432 | 52,30 | ||||
| 2026-02-17 | 13F | Spears Abacus Advisors LLC | 2.000 | 201 | ||||||
| 2026-02-17 | 13F | Millennium Management Llc | Call | 63.700 | -60,09 | 6.396 | -55,14 | |||
| 2026-02-17 | 13F | Two Sigma Advisers, Lp | 2.056.700 | 2,90 | 206.513 | 15,66 | ||||
| 2026-02-17 | 13F | Millennium Management Llc | 228.685 | 132,09 | 22.962 | 160,90 | ||||
| 2026-02-17 | 13F | LMR Partners LLP | Put | 200.000 | 185,71 | 20.082 | 221,16 | |||
| 2026-02-17 | 13F | Millennium Management Llc | Put | 107.600 | -33,87 | 10.804 | -25,66 | |||
| 2026-02-17 | 13F | LMR Partners LLP | 22.509 | 2.260 | ||||||
| 2026-01-30 | 13F | Torren Management, LLC | 6 | 1 | ||||||
| 2026-02-12 | 13F | Hrt Financial Lp | 41.100 | -7,85 | 4 | 33,33 | ||||
| 2026-02-13 | 13F | Marshall Wace, Llp | Put | 0 | -100,00 | 0 | ||||
| 2026-02-13 | 13F | Marshall Wace, Llp | Call | 0 | -100,00 | 0 | ||||
| 2026-02-02 | 13F | Truist Financial Corp | 2.735 | -84,04 | 275 | -82,09 | ||||
| 2026-02-03 | 13F | Mitsubishi UFJ Kokusai Asset Management Co., Ltd. | 47 | 0,00 | 5 | 25,00 | ||||
| 2026-02-13 | 13F | Marshall Wace, Llp | 0 | -100,00 | 0 | |||||
| 2026-01-30 | 13F | Bogart Wealth, LLC | 90 | 0,00 | 9 | 12,50 | ||||
| 2026-02-12 | 13F | MetLife Investment Management, LLC | 2.449 | 2,51 | 246 | 15,02 | ||||
| 2026-02-12 | 13F | Adviser Investments LLC | 2.375 | 238 | ||||||
| 2026-01-23 | 13F | Avion Wealth | 36 | 0,00 | 0 | |||||
| 2025-11-14 | 13F | Twinbeech Capital Lp | 0 | -100,00 | 0 | |||||
| 2026-02-06 | 13F | Tredje AP-fonden | 90.000 | 9.037 | ||||||
| 2026-02-17 | 13F | Janus Henderson Group Plc | 3.570.475 | 4,90 | 358.514 | 17,91 | ||||
| 2026-02-13 | 13F | Bridgewater Associates, LP | 85.467 | 20,69 | 8.582 | 35,65 | ||||
| 2026-02-17 | 13F | Wealth Watch Advisors, INC | 1 | 0,00 | 0 | |||||
| 2026-01-28 | 13F | Arizona State Retirement System | 28.138 | -3,44 | 2.825 | 8,57 | ||||
| 2026-01-30 | 13F/A | M&t Bank Corp | 4.798 | 8,58 | 482 | 22,08 | ||||
| 2026-02-13 | 13F | Caxton Associates Llp | 0 | -100,00 | 0 | |||||
| 2026-04-08 | 13F | DiNuzzo Private Wealth, Inc. | 15 | -6,25 | 1 | 0,00 | ||||
| 2026-02-12 | 13F | Scotia Capital Inc. | 3.095 | 23,21 | 311 | 38,39 | ||||
| 2026-02-12 | 13F | State Board Of Administration Of Florida Retirement System | 81.497 | -2,73 | 8.183 | 9,34 | ||||
| 2026-04-21 | 13F | PharVision Advisers, LLC | 0 | -100,00 | 0 | |||||
| 2026-02-13 | 13F | Great West Life Assurance Co /can/ | 11.493 | -50,08 | 1 | -50,00 | ||||
| 2026-02-17 | 13F | Css Llc/il | Put | 32.000 | 42,86 | 3.213 | 60,65 | |||
| 2026-02-17 | 13F | Moore Capital Management, Lp | 197.468 | 19.828 | ||||||
| 2026-02-12 | 13F | Ensign Peak Advisors, Inc | 5.475 | -68,94 | 550 | -65,12 | ||||
| 2025-11-13 | 13F | Boston Partners | 0 | -100,00 | 0 | |||||
| 2026-02-12 | 13F | EAM Investors, LLC | 57.521 | -1,96 | 5.776 | 12,03 | ||||
| 2026-04-17 | 13F | Webster Bank, N. A. | 0 | -100,00 | 0 | |||||
| 2026-04-22 | 13F | Spirepoint Private Client, Llc | 3.730 | 281 | ||||||
| 2026-01-12 | 13F | CVA Family Office, LLC | 19 | 0,00 | 2 | 0,00 | ||||
| 2026-01-28 | 13F | West Michigan Advisors, Llc | 5.379 | -0,57 | 540 | 11,80 | ||||
| 2026-04-20 | 13F | Jfs Wealth Advisors, Llc | 44 | -29,03 | 3 | -50,00 | ||||
| 2026-01-28 | 13F | Barrett & Company, Inc. | 100 | 0,00 | 10 | 25,00 | ||||
| 2026-02-02 | 13F | Danske Bank A/s | 1.600 | 700,00 | 161 | 841,18 | ||||
| 2026-02-13 | 13F | Quarry LP | 305 | -82,82 | 31 | -81,01 | ||||
| 2026-04-17 | 13F | Vermillion Wealth Management, Inc. | 9 | 1 | ||||||
| 2026-02-17 | 13F | Price T Rowe Associates Inc /md/ | 911.583 | 983,76 | 92 | 1.200,00 | ||||
| 2026-02-06 | 13F | Pinnbrook Capital Management Lp | 16.364 | -76,06 | 1.643 | -73,09 | ||||
| 2026-02-03 | 13F | Ethic Inc. | 4.194 | 17,97 | 421 | 32,81 | ||||
| 2026-02-13 | 13F | Pinnacle Wealth Planning Services, Inc. | 1.668 | 167 | ||||||
| 2026-04-08 | 13F | Arlington Trust Co LLC | 29 | 2 | ||||||
| 2026-02-17 | 13F/A | RBF Capital, LLC | 5.000 | -50,00 | 502 | -43,78 | ||||
| 2026-02-17 | 13F | Smith Thomas W | 237.100 | -0,17 | 23.807 | 65,50 | ||||
| 2026-02-13 | 13F | Barclays Plc | Call | 85.000 | -87,50 | 8.535 | -85,95 | |||
| 2026-01-21 | 13F | Flagship Harbor Advisors, Llc | 10 | 1 | ||||||
| 2026-02-13 | 13F | Police & Firemen's Retirement System of New Jersey | 41.858 | 0,11 | 4.203 | 12,50 | ||||
| 2026-02-17 | 13F | Fmr Llc | 15.997.458 | 1,79 | 1.606.305 | 14,42 | ||||
| 2026-02-02 | 13F | Wolverine Asset Management Llc | Put | 354.500 | -68,87 | 35.595 | -65,00 | |||
| 2026-02-13 | 13F | Barclays Plc | Put | 630.000 | 10,43 | 63.258 | 24,13 | |||
| 2026-02-13 | 13F | Barclays Plc | 691.003 | 40,20 | 69.384 | 57,58 | ||||
| 2026-02-09 | 13F | Atlantic Trust, LLC | 19 | 0,00 | 2 | 0,00 | ||||
| 2026-02-17 | 13F | Polar Asset Management Partners Inc. | 29.723 | -58,96 | 2.984 | -53,87 | ||||
| 2026-01-05 | 13F | Chesapeake Asset Management Llc | 0 | -100,00 | 0 | |||||
| 2026-02-17 | 13F | Quantessence Capital LLC | 0 | -100,00 | 0 | |||||
| 2026-02-13 | 13F | Intrepid Financial Planning Group LLC | 5.000 | 0,00 | 502 | 12,56 | ||||
| 2026-02-11 | 13F | Fox Run Management, L.l.c. | 0 | -100,00 | 0 | |||||
| 2026-01-21 | 13F | Westfuller Advisors, LLC | 80 | 14,29 | 8 | 33,33 | ||||
| 2026-02-10 | 13F | Norges Bank | 1.174.915 | 117.973 | ||||||
| 2026-02-17 | 13F | Bridgeway Capital Management Inc | 17.000 | -0,58 | 1.707 | 11,72 | ||||
| 2026-04-15 | 13F | Cypress Wealth Services, LLC | 2.673 | 0,00 | 201 | -25,00 | ||||
| 2026-02-19 | 13F | Invesco Ltd. | 170.160 | -8,87 | 17.086 | 2,43 | ||||
| 2026-02-12 | 13F | Counterpoint Mutual Funds LLC | 0 | -100,00 | 0 | -100,00 | ||||
| 2026-02-06 | 13F | Cullen/frost Bankers, Inc. | 800 | 0,00 | 80 | 12,68 | ||||
| 2026-02-17 | 13F | Occudo Quantitative Strategies Lp | 68.717 | 108,42 | 6.900 | 134,26 | ||||
| 2026-02-10 | 13F | Bruce G. Allen Investments, LLC | 7 | 0,00 | 1 | |||||
| 2026-04-14 | 13F | Thurston, Springer, Miller, Herd & Titak, Inc. | 0 | -100,00 | 0 | |||||
| 2025-11-14 | 13F | Maverick Capital Ltd | 0 | -100,00 | 0 | |||||
| 2026-02-13 | 13F | Pathstone Holdings, LLC | 5.386 | 19,53 | 541 | 34,33 | ||||
| 2026-02-10 | 13F | Smith Group Asset Management, LLC | 16.747 | 13,69 | 1.682 | 27,83 | ||||
| 2026-02-13 | 13F | RH Tailwind Management, LLC | Call | 40.000 | 4.016 | |||||
| 2026-02-06 | 13F | Covestor Ltd | 260 | -0,38 | 0 | |||||
| 2025-11-14 | 13F | Bollard Group LLC | 0 | -100,00 | 0 | |||||
| 2026-02-13 | 13F | RH Tailwind Management, LLC | 49.000 | 4.920 | ||||||
| 2026-01-09 | 13F | Capital CS Group, LLC | Call | 26.100 | 123 | |||||
| 2026-02-13 | 13F | RH Tailwind Management, LLC | Put | 160.000 | 16.066 | |||||
| 2026-02-13 | 13F | Glen Eagle Advisors, LLC | 4 | 0,00 | 0 | |||||
| 2026-04-16 | 13F | SG Americas Securities, LLC | Put | 84.100 | -40,57 | 0 | ||||
| 2026-01-27 | 13F | TD Waterhouse Canada Inc. | 114 | 0,00 | 11 | 22,22 | ||||
| 2026-02-11 | 13F | Buckingham Strategic Partners | 8.186 | 45,79 | 822 | 50,92 | ||||
| 2026-02-17 | 13F | Trexquant Investment LP | 0 | -100,00 | 0 | -100,00 | ||||
| 2026-02-17 | 13F | Point72 Asset Management, L.P. | Put | 34.900 | 546,30 | 3.504 | 626,97 | |||
| 2026-02-17 | 13F | Point72 Asset Management, L.P. | Call | 89.600 | 8.997 | |||||
| 2026-02-17 | 13F | Qube Research & Technologies Ltd | Put | 121.200 | -17,89 | 12.170 | -7,71 | |||
| 2026-02-17 | 13F | Qube Research & Technologies Ltd | Call | 57.000 | -25,20 | 5.723 | -15,91 | |||
| 2026-02-17 | 13F | Point72 Asset Management, L.P. | 9.700 | 974 | ||||||
| 2026-02-17 | 13F | Qube Research & Technologies Ltd | 579.357 | 58.173 | ||||||
| 2025-11-14 | 13F | J. Goldman & Co LP | Put | 0 | -100,00 | 0 | -100,00 | |||
| 2026-02-12 | 13F | New York State Common Retirement Fund | 51.489 | 0,00 | 5.170 | 12,42 | ||||
| 2026-02-06 | 13F | Pnc Financial Services Group, Inc. | 4.206 | -1,71 | 422 | 10,47 | ||||
| 2025-11-14 | 13F | Masters Capital Management Llc | Call | 0 | -100,00 | 0 | -100,00 | |||
| 2026-02-17 | 13F | Raymond James Financial Inc | 34.330 | 20,30 | 3.447 | 35,23 | ||||
| 2026-04-14 | 13F | Bay Harbor Wealth Management, LLC | 9 | -10,00 | 1 | -100,00 | ||||
| 2026-04-21 | 13F | Pallas Capital Advisors LLC | 4.893 | -25,11 | 368 | -43,90 | ||||
| 2026-01-12 | 13F | Heartwood Wealth Advisors LLC | 0 | -100,00 | 0 | |||||
| 2026-02-06 | 13F | Handelsbanken Fonder AB | 31.100 | 0,32 | 3 | 50,00 | ||||
| 2026-02-17 | 13F | Blair William & Co/il | 8.233 | -4,16 | 827 | 7,69 | ||||
| 2026-02-13 | 13F | Charles Schwab Investment Management Inc | 1.135.287 | -1,05 | 113.994 | 11,22 | ||||
| 2026-02-17 | 13F | Advisor Group Holdings, Inc. | 6.384 | 41,68 | 641 | 80,56 | ||||
| 2026-01-14 | 13F | ORG Partners LLC | 34 | 3 | ||||||
| 2026-02-12 | 13F | Federated Hermes, Inc. | 651.173 | 15,07 | 65.384 | 29,34 | ||||
| 2026-02-12 | 13F | Marex Group plc | 4.197 | -49,95 | 421 | -43,79 | ||||
| 2026-02-12 | 13F | Steward Partners Investment Advisory, Llc | 1.790 | 21,69 | 180 | 36,64 | ||||
| 2026-02-17 | 13F | Banco Bilbao Vizcaya Argentaria, S.a. | 0 | -100,00 | 0 | |||||
| 2026-04-13 | 13F | St Germain D J Co Inc | 200 | 0,00 | 15 | -25,00 | ||||
| 2026-01-23 | 13F | Baillie Gifford & Co | 4.002.104 | -3,55 | 401.851 | 8,42 | ||||
| 2026-01-26 | 13F | Key Capital Management, INC | 664 | 67 | ||||||
| 2026-01-29 | 13F | UBS Group AG | Put | 147.500 | 22,92 | 14.810 | 38,17 | |||
| 2026-02-13 | 13F | Edgestream Partners, L.P. | 31.125 | 3.125 | ||||||
| 2025-11-14 | 13F | XTX Topco Ltd | 0 | -100,00 | 0 | -100,00 | ||||
| 2026-04-21 | 13F | WT Wealth Management | 19.941 | 26,96 | 1.500 | -4,95 | ||||
| 2026-01-29 | 13F | UBS Group AG | 1.980.566 | 6,60 | 198.869 | 19,82 | ||||
| 2026-02-17 | 13F | State Of Wisconsin Investment Board | 62.408 | 42,90 | 6.266 | 60,63 | ||||
| 2026-02-13 | 13F | Sculptor Capital LP | Put | 28.200 | 0,00 | 2.832 | 12,39 | |||
| 2026-04-03 | 13F | Investors Research Corp | 25 | 66,67 | 2 | 0,00 | ||||
| 2026-04-24 | 13F | Root Financial Partners, LLC | 145 | -9,38 | 11 | -37,50 | ||||
| 2026-02-13 | 13F | Formula Growth Ltd | 0 | -100,00 | 0 | |||||
| 2026-02-13 | 13F | Entropy Technologies, LP | 12.218 | -76,94 | 1.227 | -74,10 | ||||
| 2025-11-10 | 13F | Options Solutions, Llc | 0 | -100,00 | 0 | |||||
| 2026-01-28 | 13F | Teacher Retirement System Of Texas | 4.287 | -66,67 | 430 | -62,54 | ||||
| 2026-02-13 | 13F | Neo Ivy Capital Management | 17.388 | 176,79 | 1.746 | 211,05 | ||||
| 2026-02-13 | 13F | Dynamic Technology Lab Private Ltd | 0 | -100,00 | 0 | |||||
| 2026-02-17 | 13F | Driehaus Capital Management Llc | 143.638 | 2,81 | 14.423 | 15,56 | ||||
| 2025-11-14 | 13F | Credit Agricole S A | 0 | -100,00 | 0 | |||||
| 2026-02-17 | 13F | Hook Mill Capital Partners, LP | 862.992 | 26,43 | 86.653 | 42,12 | ||||
| 2026-04-21 | 13F | Aaron Wealth Advisors LLC | 0 | -100,00 | 0 | |||||
| 2026-01-29 | 13F | Vanguard Group Inc | 9.634.757 | 0,76 | 967.426 | 13,26 | ||||
| 2026-02-17 | 13F | Maryland State Retirement & Pension System | 4.739 | 0,00 | 476 | 12,29 | ||||
| 2026-02-03 | 13F | Sequoia Financial Advisors, LLC | 2.410 | 242 | ||||||
| 2026-01-28 | 13F | Klp Kapitalforvaltning As | 21.300 | 4,41 | 2.139 | 17,34 | ||||
| 2026-04-13 | 13F | Massmutual Trust Co Fsb/adv | 372 | 0,00 | 28 | -27,03 | ||||
| 2026-02-13 | 13F | Gluskin Sheff & Assoc Inc | 157.799 | -9,16 | 15.845 | 2,11 | ||||
| 2026-02-17 | 13F | Russell Investments Group, Ltd. | 183.835 | 11,01 | 18.459 | 24,78 | ||||
| 2026-01-23 | 13F | Assetmark, Inc | 122 | 46,99 | 12 | 71,43 | ||||
| 2026-02-12 | 13F | BlackRock, Inc. | 5.299.765 | 10,01 | 532.149 | 23,65 | ||||
| 2026-02-05 | 13F | Baader Bank INC | 12.258 | -1,68 | 1.228 | 11,03 | ||||
| 2026-02-17 | 13F | Creative Planning | 32.699 | 23,63 | 3.283 | 38,99 | ||||
| 2026-02-13 | 13F | Citigroup Inc | 123.737 | -48,76 | 12.424 | -42,41 | ||||
| 2026-02-13 | 13F | Citigroup Inc | Call | 1.175.000 | 0,00 | 117.982 | 12,40 | |||
| 2026-02-19 | 13F | Atomi Financial Group, Inc. | 2.225 | 223 | ||||||
| 2026-02-13 | 13F | Integrated Wealth Concepts LLC | 2.790 | 280 | ||||||
| 2026-01-29 | 13F | Concurrent Investment Advisors, LLC | 52.501 | 40,77 | 5.272 | 58,24 | ||||
| 2026-02-11 | 13F | Franklin Resources Inc | 54.736 | 8.547,08 | 5.496 | 9.714,29 | ||||
| 2026-02-13 | 13F | Citigroup Inc | Put | 50.000 | 0,00 | 5.020 | 12,40 | |||
| 2026-02-10 | 13F | Daiwa Securities Group Inc. | 8.868 | 17,74 | 1 | |||||
| 2026-03-04 | 13F | SHP Wealth Management | 3 | 0 | ||||||
| 2026-02-13 | 13F | Healthcare Of Ontario Pension Plan Trust Fund | 17.148 | -56,62 | 1.722 | -51,26 | ||||
| 2026-02-12 | 13F | Great Lakes Advisors, Llc | 31.471 | -28,76 | 3.160 | -19,92 | ||||
| 2026-02-13 | 13F | Wells Fargo & Company/mn | 842.603 | 37,57 | 84.606 | 54,63 | ||||
| 2026-02-17 | 13F | Hidden Lake Asset Management LP | 13.419 | 1.347 | ||||||
| 2026-02-11 | 13F | Ing Groep Nv | 0 | -100,00 | 0 | |||||
| 2026-02-13 | 13F | AlTi Global, Inc. | 2.045 | 205 | ||||||
| 2026-02-04 | 13F | Tsfg, Llc | 0 | -100,00 | 0 | |||||
| 2026-02-13 | 13F | First Trust Advisors Lp | 148.570 | -7,45 | 14.918 | 4,03 | ||||
| 2026-02-13 | 13F | Divisadero Street Capital Management, LP | 0 | -100,00 | 0 | |||||
| 2026-04-23 | 13F | Mayflower Financial Advisors, LLC | 17.378 | -89,32 | 1.307 | -92,00 | ||||
| 2026-01-15 | 13F | Nisa Investment Advisors, Llc | 8.801 | 3,54 | 884 | 16,34 | ||||
| 2026-02-13 | 13F | Morgan Stanley | 937.425 | -56,95 | 94.127 | -51,61 | ||||
| 2026-01-22 | 13F | Massachusetts Financial Services Co /ma/ | 0 | -100,00 | 0 | |||||
| 2026-01-15 | 13F | Range Financial Group LLC | 13.793 | -7,37 | 1.385 | 4,06 | ||||
| 2026-02-02 | 13F | Sachetta, LLC | 45 | 0,00 | 5 | 0,00 | ||||
| 2025-11-07 | 13F | Rothschild Investment Llc | Put | 0 | -100,00 | 0 | -100,00 | |||
| 2026-02-12 | 13F | Xponance, Inc. | 6.661 | 6,12 | 669 | 19,29 | ||||
| 2026-02-17 | 13F | Lighthouse Investment Partners, LLC | 20.682 | 2.077 | ||||||
| 2026-02-06 | 13F | Tortoise Investment Management, LLC | 0 | -100,00 | 0 | |||||
| 2026-02-10 | 13F | Bnp Paribas Arbitrage, Sa | Call | 942 | 36,13 | 9.459 | 53,02 | |||
| 2026-01-27 | 13F | Brighton Jones Llc | 0 | -100,00 | 0 | |||||
| 2026-02-10 | 13F | Bnp Paribas Arbitrage, Sa | 1.015.677 | 27,11 | 101.984 | 42,88 | ||||
| 2026-02-13 | 13F | Panagora Asset Management Inc | 153.540 | 15.417 | ||||||
| 2026-02-20 | 13F | Kovitz Investment Group Partners, LLC | 0 | -100,00 | 0 | |||||
| 2026-02-10 | 13F | Bnp Paribas Arbitrage, Sa | Put | 841 | 0,00 | 8.444 | 12,41 | |||
| 2026-01-16 | 13F | FNY Investment Advisers, LLC | 0 | -100,00 | 0 | |||||
| 2026-02-13 | 13F | Centaurus Financial, Inc. | 13.843 | 1 | ||||||
| 2026-02-17 | 13F | Ancora Advisors, LLC | 242 | 86,15 | 24 | 118,18 | ||||
| 2026-02-17 | 13F | Great Hill Partners, L.p. | 2.788.912 | 0,00 | 280.035 | 12,40 | ||||
| 2026-02-13 | 13F | Avalon Global Asset Management LLC | 45.000 | 12,50 | 5 | 33,33 | ||||
| 2026-02-11 | 13F | Meeder Asset Management Inc | 33 | -50,00 | 3 | -40,00 | ||||
| 2026-02-12 | 13F | Penserra Capital Management LLC | 36.435 | -68,32 | 4 | -70,00 | ||||
| 2026-02-12 | 13F | Polen Capital Management Llc | 0 | -100,00 | 0 | |||||
| 2026-02-04 | 13F | BCJ Capital Management, LLC | 4.968 | 499 | ||||||
| 2026-02-11 | 13F | LPL Financial LLC | 19.675 | -0,78 | 1.976 | 11,52 | ||||
| 2026-02-12 | 13F | Brown Brothers Harriman & Co | 703 | 71 | ||||||
| 2026-02-13 | 13F | FORA Capital, LLC | 0 | -100,00 | 0 | |||||
| 2026-02-17 | 13F | Capital Fund Management S.a. | Put | 105.700 | 42,65 | 10.613 | 60,34 | |||
| 2026-02-17 | 13F | Capital Fund Management S.a. | Call | 43.400 | 17,62 | 4.358 | 32,19 | |||
| 2026-01-29 | 13F | Sanctuary Advisors, LLC | 5.376 | 54,39 | 540 | 73,31 | ||||
| 2026-02-17 | 13F | Public Employees Retirement System Of Ohio | 31.101 | 2,21 | 3.123 | 14,86 | ||||
| 2026-02-17 | 13F | Voloridge Investment Management, Llc | 1.360.345 | 12,39 | 136.592 | 26,33 | ||||
| 2026-04-06 | 13F | Versant Capital Management, Inc | 2.537 | -5,02 | 191 | -29,10 | ||||
| 2026-02-10 | 13F | Baker Avenue Asset Management, LP | 10.381 | 1.042 | ||||||
| 2026-04-13 | 13F | Artemis Investment Management LLP | 877.117 | 83,47 | 65.968 | 37,42 | ||||
| 2026-04-20 | 13F | Contravisory Investment Management, Inc. | 0 | -100,00 | 0 | |||||
| 2026-04-24 | 13F | Optas, LLC | 4.283 | -15,31 | 322 | -36,49 | ||||
| 2026-04-20 | 13F | State of Alaska, Department of Revenue | 5.418 | 0,00 | 0 | |||||
| 2026-04-07 | 13F | Farther Finance Advisors, LLC | 599 | -67,64 | 45 | -75,68 | ||||
| 2026-02-04 | 13F | Atlantic Union Bankshares Corp | 16 | 2 | ||||||
| 2026-01-21 | 13F | Newbridge Financial Services Group, Inc. | 20 | 2 | ||||||
| 2026-02-10 | 13F | Bank of New York Mellon Corp | 305.239 | 8,44 | 30.649 | 21,90 | ||||
| 2026-02-11 | 13F | Parallel Advisors, LLC | 1.400 | 12,81 | 141 | 27,27 | ||||
| 2026-02-13 | 13F | Arrowstreet Capital, Limited Partnership | 2.825.654 | 0,31 | 283.724 | 12,75 | ||||
| 2026-02-13 | 13F | Mariner, LLC | 42.011 | 94,57 | 4.221 | 118,93 | ||||
| 2026-04-20 | 13F | Inscription Capital, LLC | 4.901 | -9,12 | 369 | -31,98 | ||||
| 2026-02-11 | 13F | O'shaughnessy Asset Management, Llc | 4.564 | 34,63 | 458 | 51,66 | ||||
| 2026-02-10 | 13F | Intech Investment Management Llc | 5.017 | -38,79 | 504 | -31,28 | ||||
| 2026-02-12 | 13F | Wealthspire Advisors, LLC | 0 | -100,00 | 0 | |||||
| 2026-02-11 | 13F | Capital World Investors | 13.457.158 | 0,62 | 1.351.237 | 13,10 | ||||
| 2026-04-15 | 13F | Activest Wealth Management | 0 | -100,00 | 0 | |||||
| 2026-02-13 | 13F | Kestra Advisory Services, LLC | 442 | 44 | ||||||
| 2026-02-13 | 13F | MAI Capital Management | 38 | 4 | ||||||
| 2026-04-22 | 13F | Sterling Capital Management LLC | 2.822 | -42,17 | 212 | -56,73 | ||||
| 2026-02-17 | 13F | Tudor Investment Corp Et Al | Call | 118.700 | 11.919 | |||||
| 2026-02-17 | 13F | Mane Global Capital Management Lp | 4.000 | -98,95 | 402 | -98,82 | ||||
| 2026-02-17 | 13F | Tudor Investment Corp Et Al | Put | 139.400 | 13.997 | |||||
| 2026-02-17 | 13F | Tudor Investment Corp Et Al | 215.784 | 21.667 | ||||||
| 2026-02-02 | 13F | Wolverine Asset Management Llc | 0 | -100,00 | 0 | -100,00 | ||||
| 2026-02-05 | 13F | North Dakota State Investment Board | 36.210 | 3.636 | ||||||
| 2026-02-13 | 13F | SRS Capital Advisors, Inc. | 468 | -96,69 | 47 | -96,36 | ||||
| 2026-04-15 | 13F | Merit Financial Group, LLC | 4.975 | -24,31 | 374 | -43,25 | ||||
| 2025-11-14 | 13F | Sycale Advisors (NY) LLC | 0 | -100,00 | 0 | -100,00 | ||||
| 2026-01-28 | 13F | Universal- Beteiligungs- und Servicegesellschaft mbH | 109.434 | 7,05 | 10.988 | 20,32 | ||||
| 2026-02-17 | 13F | Scopus Asset Management, L.p. | 489.500 | 49.151 | ||||||
| 2026-02-09 | 13F | Huntington National Bank | 113 | 0,00 | 11 | 10,00 | ||||
| 2026-02-17 | 13F | Brevan Howard Capital Management LP | 0 | -100,00 | 0 | |||||
| 2026-02-17 | 13F | Interval Partners, LP | 184.223 | 1.581,17 | 18.498 | 1.791,31 | ||||
| 2026-04-20 | 13F | Friedenthal Financial | 0 | -100,00 | 0 | |||||
| 2026-02-13 | 13F | Verition Fund Management LLC | 119.243 | 23,51 | 11.973 | 38,83 | ||||
| 2026-02-17 | 13F | RMB Capital Management, LLC | 2.715 | 273 | ||||||
| 2025-11-14 | 13F | Par Capital Management Inc | 0 | -100,00 | 0 | -100,00 | ||||
| 2026-02-12 | 13F | Proficio Capital Partners LLC | 83.405 | -10,71 | 8.375 | 0,37 | ||||
| 2026-02-13 | 13F | Walleye Trading LLC | Call | 316.300 | -11,23 | 31.760 | -0,22 | |||
| 2026-02-13 | 13F | National Bank Of Canada /fi/ | Put | 0 | -100,00 | 0 | -100,00 | |||
| 2026-02-10 | 13F | REAP Financial Group, LLC | 150 | 15 | ||||||
| 2026-02-23 | 13F | Kera Capital Partners, Inc. | 3.503 | 363 | ||||||
| 2026-02-17 | 13F | Summit Trail Advisors, Llc | 18.038 | 19,78 | 1.811 | 34,65 | ||||
| 2026-02-18 | 13F | Vident Advisory, LLC | 2.277 | 229 | ||||||
| 2025-10-27 | 13F | First Horizon Corp | 0 | -100,00 | 0 | |||||
| 2026-01-30 | 13F | State of New Jersey Common Pension Fund D | 35.449 | -2,63 | 3.559 | 9,44 | ||||
| 2026-02-13 | 13F | Walleye Trading LLC | Put | 473.900 | -4,90 | 47.584 | 6,90 | |||
| 2026-02-17 | 13F | Nomura Holdings Inc | 0 | -100,00 | 0 | |||||
| 2026-02-17 | 13F | Jain Global LLC | 38.187 | -84,45 | 3.834 | -82,52 | ||||
| 2026-04-16 | 13F | SG Americas Securities, LLC | 211.005 | -14,78 | 16 | -37,50 | ||||
| 2026-02-13 | 13F | Hudson Bay Capital Management LP | 80.281 | 8.061 | ||||||
| 2026-04-22 | 13F | CrossGen Wealth, LLC | 183 | 0,00 | 14 | -27,78 | ||||
| 2026-02-13 | 13F | Walleye Capital LLC | Put | 122.300 | 77,25 | 12.280 | 99,25 | |||
| 2026-02-13 | 13F | Umb Bank N A/mo | 12 | 50,00 | 1 | |||||
| 2026-02-17 | 13F | Mercer Global Advisors Inc /adv | 26.536 | 60,42 | 2.664 | 80,37 | ||||
| 2026-02-13 | 13F | Walleye Capital LLC | 220.607 | -36,70 | 22.151 | -28,85 | ||||
| 2026-02-17 | 13F | Algert Global Llc | 90.965 | -18,39 | 9 | 0,00 | ||||
| 2026-02-13 | 13F | Walleye Capital LLC | Call | 61.000 | 900,00 | 6.125 | 1.025,92 | |||
| 2026-02-17 | 13F | Cypress Point Investment Management Lp | 33.937 | 3.412 | ||||||
| 2025-10-31 | 13F | Orion Capital Management LLC | 0 | -100,00 | 0 | |||||
| 2026-02-12 | 13F | Federation des caisses Desjardins du Quebec | 7.792 | 17,21 | 782 | 31,87 | ||||
| 2026-01-22 | 13F | Bfsg, Llc | 10 | 0,00 | 1 | |||||
| 2026-02-13 | 13F | Blueshift Asset Management, LLC | 0 | -100,00 | 0 | -100,00 | ||||
| 2026-01-22 | 13F | V-Square Quantitative Management LLC | 328 | 33 | ||||||
| 2025-11-14 | 13F | Squarepoint Ops LLC | 0 | -100,00 | 0 | -100,00 | ||||
| 2026-04-08 | 13F | Wealth Enhancement Trust Services, Inc. | 0 | -100,00 | 0 | |||||
| 2026-02-09 | 13F | Williamson Legacy Group, LLC | 24.967 | 86,22 | 2.507 | 109,36 | ||||
| 2026-02-17 | 13F | Aquatic Capital Management LLC | 69.782 | -70,33 | 7.007 | -66,65 | ||||
| 2026-01-16 | 13F | Crewe Advisors LLC | 2.100 | 0,00 | 211 | 12,30 | ||||
| 2026-02-05 | 13F | HFM Investment Advisors, LLC | 7 | 40,00 | 1 | |||||
| 2026-02-10 | 13F | Savant Capital, LLC | 0 | -100,00 | 0 | |||||
| 2026-02-17 | 13F | Bank Of America Corp /de/ | Call | 0 | -100,00 | 0 | ||||
| 2026-02-02 | 13F | Principal Financial Group Inc | 2.665 | -94,16 | 268 | -93,45 | ||||
| 2026-02-05 | 13F | Thrivent Financial For Lutherans | 5.459 | -11,70 | 1 | |||||
| 2026-02-13 | 13F | Public Employees Retirement Association Of Colorado | 9.016 | 0,00 | 1 | |||||
| 2026-02-12 | 13F | Elo Mutual Pension Insurance Co | 23.672 | 2.377 | ||||||
| 2026-04-14 | 13F | Nbc Securities, Inc. | 2.172 | 0,65 | 163 | -24,54 | ||||
| 2026-02-11 | 13F | Invst, LLC | 8.681 | 872 | ||||||
| 2026-02-12 | 13F | Principal Securities, Inc. | 0 | -100,00 | 0 | -100,00 | ||||
| 2026-02-13 | 13F | Macquarie Group Ltd | 0 | -100,00 | 0 | |||||
| 2026-02-20 | 13F | Sunbelt Securities, Inc. | 6 | 1 | ||||||
| 2026-01-30 | 13F | Mitsubishi UFJ Trust & Banking Corp | 25.553 | -11,98 | 2.566 | -1,08 | ||||
| 2026-02-17 | 13F | Ameriprise Financial Inc | 594.766 | 8,58 | 59.720 | 22,05 | ||||
| 2026-02-06 | 13F | Vestmark Advisory Solutions, Inc. | 5.173 | 519 | ||||||
| 2026-02-17 | 13F | Captrust Financial Advisors | 8.001 | 9,78 | 803 | 23,35 | ||||
| 2026-02-12 | 13F | Renaissance Technologies Llc | 5.407.325 | 3,45 | 542.950 | 16,29 | ||||
| 2026-01-29 | 13F | Rakuten Securities, Inc. | 778 | 265,26 | 78 | 310,53 | ||||
| 2026-02-13 | 13F | Dockside LLC | 19.817 | 1.990 | ||||||
| 2026-02-13 | 13F | Treasurer of the State of North Carolina | 41.029 | -3,91 | 4 | 33,33 | ||||
| 2026-02-12 | 13F | Voya Investment Management Llc | 7.663 | -7,82 | 769 | 3,64 | ||||
| 2026-02-11 | 13F | Group One Trading, L.p. | Put | 118.900 | 11,43 | 11.939 | 25,25 | |||
| 2026-04-13 | 13F | True Wealth Design, LLC | 393 | -12,47 | 30 | -35,56 | ||||
| 2026-02-11 | 13F | Group One Trading, L.p. | 74.919 | -22,18 | 7.523 | -12,53 | ||||
| 2026-01-29 | 13F | Dunhill Financial, LLC | 2 | 0 | ||||||
| 2026-02-09 | 13F | Arista Wealth Management, LLC | 3.300 | 331 | ||||||
| 2026-02-11 | 13F | Group One Trading, L.p. | Call | 150.200 | 44,01 | 15.082 | 61,87 | |||
| 2026-01-26 | 13F | Childress Capital Advisors, Llc | 2.529 | 11,46 | 254 | 25,25 | ||||
| 2026-02-10 | 13F/A | Northwestern Mutual Wealth Management Co | 4.695 | 35,38 | 471 | 52,43 | ||||
| 2026-02-04 | 13F | Wsfs Capital Management, Llc | 2.478 | 249 | ||||||
| 2026-02-17 | 13F | Tabor Asset Management, LP | 168.684 | 67,29 | 16.938 | 88,04 | ||||
| 2026-04-08 | 13F | NorthCrest Asset Manangement, LLC | 0 | -100,00 | 0 | |||||
| 2026-02-17 | 13F | Engineers Gate Manager LP | 174.768 | 35,76 | 17.548 | 52,60 | ||||
| 2026-02-13 | 13F | Rhumbline Advisers | 95.058 | 3,93 | 9.545 | 16,82 | ||||
| 2026-03-12 | 13F/A | Peak6 Llc | Put | 650.100 | -28,09 | 65.277 | -19,17 | |||
| 2026-02-17 | 13F | Summit Partners Public Asset Management, Llc | Put | 0 | -100,00 | 0 | ||||
| 2026-03-12 | 13F/A | Peak6 Llc | Call | 477.700 | 20,66 | 47.966 | 35,63 | |||
| 2026-02-13 | 13F | Parkside Financial Bank & Trust | 87 | 10,13 | 9 | 14,29 | ||||
| 2026-02-10 | 13F | Goldman Sachs Group Inc | Put | 100.000 | 0,00 | 10.041 | 12,40 | |||
| 2026-02-10 | 13F | Goldman Sachs Group Inc | 663.410 | 67,39 | 66.613 | 88,15 | ||||
| 2026-02-17 | 13F | Worldquant Millennium Advisors Llc | 47.708 | 4.790 | ||||||
| 2026-02-17 | 13F | Odyssean, LLC | 6.997 | 703 | ||||||
| 2025-11-04 | 13F | NAN FUNG TRINITY (HK) Ltd | 0 | -100,00 | 0 | |||||
| 2026-02-13 | 13F | National Bank Of Canada /fi/ | 21.390 | -84,72 | 2.147 | -82,83 | ||||
| 2026-04-16 | 13F | Diversified Trust Co | 0 | -100,00 | 0 | |||||
| 2026-01-30 | 13F | Us Bancorp \de\ | 2.661 | 11,43 | 267 | 25,35 | ||||
| 2026-04-10 | 13F | Magnus Financial Group LLC | 3.301 | -0,06 | 248 | -25,08 | ||||
| 2026-02-13 | 13F | Eventide Asset Management, Llc | 4.315 | 436 | ||||||
| 2026-02-13 | 13F | Bank Of Nova Scotia | Put | 0 | -100,00 | 0 | -100,00 | |||
| 2026-04-17 | 13F | First National Bank Sioux Falls | 0 | -100,00 | 0 | |||||
| 2026-02-10 | 13F | Goldman Sachs Group Inc | Call | 590.600 | 0,00 | 59.302 | 12,40 | |||
| 2026-02-17 | 13F | Signature Equity Partners, LLC | 51 | 5 | ||||||
| 2026-02-12 | 13F | Jane Street Group, Llc | Put | 811.000 | -11,68 | 81.433 | -0,72 | |||
| 2026-02-12 | 13F | Jane Street Group, Llc | Call | 4.285.600 | 19,16 | 430.317 | 33,94 | |||
| 2026-02-17 | 13F | Quantinno Capital Management LP | 310.986 | 124,29 | 31.226 | 152,13 | ||||
| 2025-10-30 | 13F | Twin Peaks Wealth Advisors, LLC | 0 | -100,00 | 0 | |||||
| 2026-02-04 | 13F | Virginia Retirement Systems Et Al | 22.256 | 26,05 | 2.235 | 41,66 | ||||
| 2026-02-17 | 13F | Shellback Capital, LP | 128.429 | -68,13 | 12.896 | -64,18 | ||||
| 2026-01-29 | 13F | IMC-Chicago, LLC | 42.207 | -29,36 | 4.238 | -20,59 | ||||
| 2026-01-29 | 13F | IMC-Chicago, LLC | Put | 673.700 | -17,15 | 67.646 | -6,88 | |||
| 2026-01-29 | 13F | IMC-Chicago, LLC | Call | 640.400 | -12,48 | 64.303 | -1,62 | |||
| 2026-02-11 | 13F | Picton Mahoney Asset Management | 36.380 | 3.653 | ||||||
| 2026-02-13 | 13F | Corient IA LLC | 7.500 | 0,00 | 753 | 12,56 | ||||
| 2026-02-10 | 13F | State of Wyoming | 3.724 | -31,15 | 374 | -22,77 | ||||
| 2026-02-17 | 13F | Aster Capital Management (DIFC) Ltd | 1.441 | 145 | ||||||
| 2026-04-21 | 13F | Berkshire Money Management, Inc. | 0 | -100,00 | 0 | |||||
| 2026-04-10 | 13F | Oak Thistle LLC | 23.805 | 1.790 | ||||||
| 2026-02-17 | 13F | SageView Advisory Group, LLC | 475 | 48 | ||||||
| 2026-04-07 | 13F | CoreCap Advisors, LLC | 50 | 0,00 | 4 | -40,00 | ||||
| 2026-02-10 | 13F | Lido Advisors, LLC | 3.809 | 2,89 | 341 | 3,33 | ||||
| 2026-04-22 | 13F | Pictet Asset Management Holding SA | 16.528 | 12,24 | 1.243 | -15,90 | ||||
| 2026-02-04 | 13F | Independent Advisor Alliance | 4.993 | 13,81 | 501 | 28,13 | ||||
| 2026-02-13 | 13F | Colony Group, LLC | 24.043 | 272,01 | 2.414 | 318,37 | ||||
| 2026-02-12 | 13F | Ci Investments Inc. | 0 | -100,00 | 0 | |||||
| 2026-02-06 | 13F | EverSource Wealth Advisors, LLC | 1.888 | 45,90 | 190 | 64,35 | ||||
| 2026-02-06 | 13F | Gsa Capital Partners Llp | 0 | -100,00 | 0 | |||||
| 2026-02-10 | 13F | Acadian Asset Management Llc | 71.890 | -46,30 | 7 | -36,36 | ||||
| 2026-04-23 | 13F | Marquette Asset Management, LLC | 1.500 | 113 | ||||||
| 2026-02-17 | 13F | Two Sigma Securities, Llc | 2.365 | 237 | ||||||
| 2026-02-11 | 13F | Meeder Advisory Services, Inc. | 2.103 | 211 | ||||||
| 2026-02-11 | 13F | Winton Capital Group Ltd | 26.470 | -10,28 | 2.658 | 0,83 | ||||
| 2026-02-17 | 13F | Cinctive Capital Management LP | 39.413 | 355,43 | 3.957 | 411,90 | ||||
| 2025-11-12 | 13F | CMT Capital Markets Trading GmbH | 0 | -100,00 | 0 | |||||
| 2026-02-17 | 13F | Advisory Services Network, LLC | 15.105 | -0,28 | 1.517 | 12,05 | ||||
| 2026-02-13 | 13F | Ubs Asset Management Americas Inc | 256.797 | 0,01 | 25.785 | 12,41 | ||||
| 2026-02-11 | 13F | Winnow Wealth Llc | 1 | 0 | ||||||
| 2026-02-09 | 13F | Legal & General Group Plc | 103.043 | -26,11 | 10.347 | -16,94 | ||||
| 2026-02-11 | 13F | Los Angeles Capital Management Llc | 8.206 | 840 | ||||||
| 2026-02-10 | 13F | Allen Investment Management LLC | 749.250 | 32,32 | 75.232 | 48,73 | ||||
| 2026-02-13 | 13F | Golden State Wealth Management, LLC | 215 | 22 | ||||||
| 2026-02-13 | 13F | Goodnow Investment Group, Llc | 632.952 | -2,57 | 63.555 | 9,51 | ||||
| 2026-02-17 | 13F | California State Teachers Retirement System | 94.455 | 1,28 | 9.484 | 13,85 | ||||
| 2026-01-28 | 13F | WPG Advisers, LLC | 17 | 13,33 | 2 | 0,00 | ||||
| 2026-01-29 | 13F | Quent Capital, LLC | 247 | -0,40 | 25 | 9,09 | ||||
| 2025-12-16 | 13F | Garde Capital, Inc. | 0 | -100,00 | 0 | |||||
| 2026-02-12 | 13F | Dimensional Fund Advisors Lp | 708.173 | 16,57 | 71.111 | 31,04 | ||||
| 2026-02-12 | 13F | Jane Street Group, Llc | 442.357 | -69,67 | 44.417 | -65,91 | ||||
| 2026-04-14 | 13F | Zrc Wealth Management, Llc | 30 | 42,86 | 2 | 0,00 | ||||
| 2026-04-15 | 13F | Bayforest Capital Ltd | 0 | -100,00 | 0 | |||||
| 2026-02-13 | 13F | American Century Companies Inc | 689.464 | 4,48 | 69.229 | 17,44 | ||||
| 2026-04-10 | 13F/A | OP Asset Management Ltd | 66.458 | 272,06 | 4.998 | 178,75 | ||||
| 2026-04-21 | 13F | GFG Capital, LLC | 0 | -100,00 | 0 | |||||
| 2026-04-24 | 13F | Strs Ohio | 175.742 | 26,03 | 13.218 | -5,60 | ||||
| 2026-02-17 | 13F | Concentric Capital Strategies, LP | 110.305 | 11.076 | ||||||
| 2026-02-17 | 13F | Optiver Holding B.V. | Call | 138.300 | 100,14 | 13.887 | 124,98 | |||
| 2026-02-17 | 13F | Optiver Holding B.V. | Put | 267.600 | 102,73 | 26.870 | 127,88 | |||
| 2026-02-12 | 13F | Nuveen, LLC | 303.996 | 5,19 | 30.524 | 18,24 | ||||
| 2026-02-17 | 13F | Optiver Holding B.V. | 21.455 | -65,98 | 2.154 | -61,76 | ||||
| 2026-02-17 | 13F | Alliancebernstein L.p. | 134.891 | 270,33 | 13.544 | 316,35 | ||||
| 2026-04-14 | 13F | Prospera Financial Services Inc | 0 | -100,00 | 0 | |||||
| 2026-02-18 | 13F | GWM Advisors LLC | 0 | -100,00 | 0 | |||||
| 2026-02-13 | 13F | Kayne Anderson Rudnick Investment Management Llc | 6 | 0,00 | 1 | |||||
| 2026-02-17 | 13F | Eddie Patel Inc | 12.378 | 1.243 | ||||||
| 2026-02-09 | 13F | Hartland & Co., LLC | 59 | -95,39 | 6 | -95,61 | ||||
| 2025-11-14 | 13F | WealthTrak Capital Management LLC | 0 | -100,00 | 0 | |||||
| 2026-04-03 | 13F | Adirondack Trust Co | 100 | 0,00 | 8 | -30,00 | ||||
| 2026-04-21 | 13F | Hennessy Advisors Inc | 416.500 | -9,46 | 31.325 | -32,18 | ||||
| 2026-04-22 | 13F | Patriot Financial Group Insurance Agency, LLC | 7.458 | 206,16 | 561 | 129,51 | ||||
| 2026-02-09 | 13F | Optimist Retirement Group LLC | 5.160 | -2,25 | 518 | 9,98 | ||||
| 2026-02-17 | 13F | SummitTX Capital, L.P. | 2.110 | 212 | ||||||
| 2026-02-03 | 13F | Garner Asset Management Corp | 2 | 0 | ||||||
| 2026-02-17 | 13F | Fred Alger Management, Llc | 45.619 | -59,66 | 4.581 | -54,66 | ||||
| 2026-01-28 | 13F | DekaBank Deutsche Girozentrale | 1.074 | 0,00 | 0 | |||||
| 2026-02-09 | 13F | Blue Bell Private Wealth Management, Llc | 95 | 10 | ||||||
| 2026-02-17 | 13F | Boothbay Fund Management, Llc | 209.577 | 14,98 | 21.044 | 29,24 | ||||
| 2026-02-17 | 13F | Panoramic Capital, LLC | 93.727 | 2,94 | 9.411 | 15,71 | ||||
| 2026-02-17 | 13F | Canada Pension Plan Investment Board | 116.200 | -12,89 | 11.668 | -2,09 | ||||
| 2026-02-17 | 13F | Citadel Advisors Llc | Put | 1.471.600 | -19,95 | 147.763 | -10,02 | |||
| 2026-02-17 | 13F | Lazard Asset Management Llc | Put | 0 | -100,00 | 0 | ||||
| 2026-02-11 | 13F | Twin Tree Management, LP | Call | 40.400 | -20,00 | 4.057 | -10,09 | |||
| 2026-02-11 | 13F | Twin Tree Management, LP | Put | 4.100 | -98,70 | 412 | -98,54 | |||
| 2026-02-06 | 13F | Larson Financial Group LLC | 708 | 36,15 | 71 | 54,35 | ||||
| 2026-02-17 | 13F | Citadel Advisors Llc | Call | 1.049.000 | -13,76 | 105.330 | -3,07 | |||
| 2026-02-17 | 13F | Citadel Advisors Llc | 828.285 | -31,02 | 83.168 | -22,46 | ||||
| 2026-02-20 | 13F/A | CMT Capital Markets Trading GmbH | Put | 39.600 | -53,36 | 4 | -57,14 | |||
| 2026-02-11 | 13F | Allianz Asset Management GmbH | 8.071 | 810 | ||||||
| 2026-02-20 | 13F/A | CMT Capital Markets Trading GmbH | Call | 21.500 | -65,49 | 2 | -60,00 | |||
| 2026-02-13 | 13F | Jacobs Levy Equity Management, Inc | 693.905 | 13,23 | 69.675 | 27,28 | ||||
| 2026-02-11 | 13F | Jpmorgan Chase & Co | Call | 764.800 | 84,02 | 76.794 | 106,85 | |||
| 2026-04-15 | 13F | Fortitude Family Office, LLC | 136 | 13,33 | 10 | -16,67 | ||||
| 2026-02-11 | 13F | Jpmorgan Chase & Co | Put | 925.100 | 67,89 | 92.889 | 88,72 | |||
| 2026-04-24 | 13F | Clarity Wealth Advisors, LLC | 0 | -100,00 | 0 | |||||
| 2026-02-13 | 13F | Toroso Investments, LLC | 31.672 | -9,72 | 3.180 | 1,50 | ||||
| 2026-02-19 | 13F | CI Private Wealth, LLC | 77.167 | 609,58 | 2.009 | 106,90 | ||||
| 2026-02-11 | 13F | Jpmorgan Chase & Co | 267.233 | -66,29 | 26.833 | -62,11 | ||||
| 2026-02-17 | 13F | Man Group plc | Call | 6.000 | 22,45 | 602 | 37,76 | |||
| 2026-02-17 | 13F | Man Group plc | 25.056 | 1.981,06 | 2.516 | 2.250,47 | ||||
| 2026-02-17 | 13F | Elequin Capital Lp | 542 | 54 | ||||||
| 2026-02-17 | 13F | Man Group plc | Put | 6.000 | 22,45 | 602 | 37,76 | |||
| 2026-02-17 | 13F | MIRAE ASSET GLOBAL ETFS HOLDINGS Ltd. | 11.255 | -8,35 | 1.130 | 3,10 | ||||
| 2026-04-17 | 13F | Krilogy Financial LLC | 0 | -100,00 | 0 | |||||
| 2026-02-13 | 13F | Manufacturers Life Insurance Company, The | 0 | -100,00 | 0 | |||||
| 2026-01-13 | 13F | Mather Group, Llc. | 0 | -100,00 | 0 | |||||
| 2026-02-09 | 13F | Hantz Financial Services, Inc. | 5 | 0,00 | 0 | |||||
| 2026-04-27 | 13F | Leonteq Securities AG | 269 | 20,63 | 20 | -9,09 | ||||
| 2026-02-17 | 13F | Cresset Asset Management, LLC | 0 | -100,00 | 0 | -100,00 | ||||
| 2026-04-17 | 13F | AdvisorNet Financial, Inc | 0 | -100,00 | 0 | |||||
| 2026-04-22 | 13F | Adams Diversified Equity Fund, Inc. | 116.700 | 8.777 | ||||||
| 2026-01-12 | 13F | Rialto Wealth Management, LLC | 4 | 33,33 | 0 | |||||
| 2026-02-12 | 13F | Cloud Capital Management, LLC | 0 | -100,00 | 0 | |||||
| 2026-02-17 | 13F | Royal Bank Of Canada | 335.194 | -46,48 | 33.656 | -39,85 | ||||
| 2026-02-12 | 13F | California Public Employees Retirement System | 178.162 | 6,79 | 17.889 | 20,04 | ||||
| 2026-02-13 | 13F | Centiva Capital, LP | Call | 4.200 | -38,24 | 422 | -30,64 | |||
| 2026-02-12 | 13F | Commonwealth Equity Services, Llc | 9.369 | 34,71 | 941 | |||||
| 2026-02-17 | 13F | Sig Brokerage, Lp | Call | 25.000 | 0,00 | 2.510 | 12,40 | |||
| 2026-02-17 | 13F | Benchstone Capital Management LP | 228.226 | 22.916 | ||||||
| 2026-04-13 | 13F | IFP Advisors, Inc | 452 | 15,01 | 34 | -15,38 | ||||
| 2026-02-06 | 13F | Global Retirement Partners, LLC | 3.331 | 915,55 | 334 | 1.051,72 | ||||
| 2026-02-10 | 13F | Skaana Management L.P. | Put | 500 | 0,00 | 50 | 13,64 | |||
| 2026-02-06 | 13F | Mach-1 Financial Group, Inc. | 2.192 | 220 | ||||||
| 2026-02-10 | 13F | Skaana Management L.P. | 4.743 | 0,00 | 476 | 12,53 | ||||
| 2026-02-13 | 13F | Centiva Capital, LP | 2.355 | 236 | ||||||
| 2026-02-13 | 13F | Victory Capital Management Inc | 30.179 | 174,48 | 3.030 | 208,55 | ||||
| 2026-02-10 | 13F | Skaana Management L.P. | Call | 1.900 | -20,83 | 191 | -11,21 | |||
| 2026-02-13 | 13F | Centiva Capital, LP | Put | 32.300 | 280,00 | 3.243 | 327,27 | |||
| 2026-02-17 | 13F | Numerai GP LLC | 24.019 | 228,26 | 2.412 | 269,22 | ||||
| 2025-11-14 | 13F | Skopos Labs, Inc. | 0 | -100,00 | 0 | |||||
| 2026-02-18 | 13F | Beacon Pointe Advisors, LLC | Call | 1.200 | 120 | |||||
| 2026-02-17 | 13F | Voleon Capital Management Lp | 22.602 | 609,42 | 2.269 | 698,94 | ||||
| 2026-02-18 | 13F | Beacon Pointe Advisors, LLC | 1.399 | 140 | ||||||
| 2026-03-06 | 13F | Hsbc Holdings Plc | 129.707 | 215,28 | 13.038 | 263,55 | ||||
| 2026-02-02 | 13F | Qrg Capital Management, Inc. | 3.794 | -0,08 | 381 | 12,09 | ||||
| 2026-02-17 | 13F | Tower Research Capital LLC (TRC) | 1.027 | 5.305,26 | 103 | 10.200,00 | ||||
| 2026-02-13 | 13F | Wells Fargo & Company/mn | Put | 250.000 | 25,00 | 25.102 | 40,50 | |||
| 2026-02-17 | 13F | Aqr Capital Management Llc | 1.901.210 | 15,38 | 190.900 | 29,70 | ||||
| 2025-11-17 | 13F | Alyeska Investment Group, L.P. | 0 | -100,00 | 0 | -100,00 | ||||
| 2026-01-28 | 13F | Chicago Partners Investment Group LLC | 5.506 | 137,63 | 604 | 145,53 | ||||
| 2026-02-09 | 13F | Geode Capital Management, Llc | 1.903.219 | 10,82 | 191.145 | 24,57 | ||||
| 2025-10-29 | 13F/A | J.Safra Asset Management Corp | 0 | -100,00 | 0 | -100,00 | ||||
| 2026-04-17 | 13F | Bell Investment Advisors, Inc | 101 | 0,00 | 8 | -30,00 | ||||
| 2026-02-17 | 13F | Balyasny Asset Management Llc | Call | 116.100 | -53,07 | 11.658 | -47,25 | |||
| 2026-02-17 | 13F | Balyasny Asset Management Llc | Put | 391.000 | -14,24 | 39.260 | -3,60 | |||
| 2026-02-17 | 13F | Balyasny Asset Management Llc | 1.612.754 | 28,74 | 161.937 | 44,70 | ||||
| 2025-11-21 | 13F | Nebula Research & Development LLC | 0 | -100,00 | 0 | |||||
| 2026-02-13 | 13F | K2 Principal Fund, L.p. | Call | 0 | -100,00 | 0 | ||||
| 2026-02-06 | 13F | Legato Capital Management LLC | 13.215 | 1.327 | ||||||
| 2026-01-27 | 13F | PFG Advisors | 4.059 | 408 | ||||||
| 2025-11-06 | 13F | RFG Advisory, LLC | 0 | -100,00 | 0 | |||||
| 2026-02-13 | 13F | Cynosure Management, Llc | 4.964 | 498 | ||||||
| 2026-02-09 | 13F | Employees Retirement System of Texas | 35.897 | 0,00 | 4 | 0,00 | ||||
| 2026-02-17 | 13F | Quadrature Capital Ltd | 0 | -100,00 | 0 | |||||
| 2026-01-26 | 13F | Private Trust Co Na | 19 | 0,00 | 2 | 0,00 | ||||
| 2026-02-05 | 13F | Cambridge Investment Research Advisors, Inc. | 3.846 | 0 | ||||||
| 2026-04-16 | 13F | SG Americas Securities, LLC | Call | 323.100 | -48,49 | 0 | -100,00 | |||
| 2026-02-13 | 13F | Neuberger Berman Group LLC | 308.856 | -3,53 | 31.012 | 8,44 | ||||
| 2026-02-13 | 13F | Sei Investments Co | 68.762 | -5,60 | 6.904 | 6,09 | ||||
| 2026-02-12 | 13F | Advisors Asset Management, Inc. | 3.658 | 367 | ||||||
| 2026-01-20 | 13F | Cromwell Holdings LLC | 17 | 0,00 | 2 | 0,00 | ||||
| 2026-01-22 | 13F | Financial Consulate, Inc | 0 | -100,00 | 0 | |||||
| 2026-02-17 | 13F | Quantitative Investment Management, LLC | 0 | -100,00 | 0 | |||||
| 2026-02-03 | 13F | SBI Securities Co., Ltd. | 149 | 351,52 | 15 | 600,00 | ||||
| 2026-02-12 | 13F | Swiss National Bank | 196.600 | 2,99 | 19.741 | 15,76 | ||||
| 2026-02-10 | 13F | Hillsdale Investment Management Inc. | 41.800 | 4,24 | 4.197 | 17,17 | ||||
| 2026-02-11 | 13F | Twin Tree Management, LP | 0 | -100,00 | 0 | -100,00 | ||||
| 2026-02-03 | 13F | Everence Capital Management Inc | 5.090 | 0,00 | 1 | |||||
| 2026-04-24 | 13F | ProShare Advisors LLC | 38.266 | 18,85 | 2.878 | -10,98 | ||||
| 2026-02-13 | 13F | Public Sector Pension Investment Board | 0 | -100,00 | 0 | |||||
| 2026-02-10 | 13F | Godfrey Financial Associates, Inc. | 16 | 2 | ||||||
| 2026-02-17 | 13F | Polar Asset Management Partners Inc. | Put | 0 | -100,00 | 0 | ||||
| 2026-04-22 | 13F | Advocate Investing Services LLC | 0 | -100,00 | 0 | |||||
| 2026-02-17 | 13F | Harvest Investment Services, LLC | 5.190 | 521 | ||||||
| 2026-02-13 | 13F | Ingalls & Snyder Llc | 98.807 | -0,39 | 10 | 12,50 | ||||
| 2026-02-17 | 13F | Caption Management, LLC | 56.800 | -25,36 | 5.703 | -16,11 | ||||
| 2026-02-17 | 13F | Caption Management, LLC | Call | 640.000 | 18,52 | 64.262 | 33,22 | |||
| 2026-01-27 | 13F | Evergreen Capital Management Llc | 3.034 | 305 | ||||||
| 2026-02-02 | 13F | Fifth Third Bancorp | 6 | 0,00 | 1 | |||||
| 2026-02-13 | 13F | Wolf Hill Capital Management, LP | 1.273.004 | 62,46 | 127.822 | 82,61 | ||||
| 2025-11-13 | 13F | Fieldview Capital Management, LLC | 0 | -100,00 | 0 | |||||
| 2026-02-02 | 13F | Wolverine Asset Management Llc | Call | 145.000 | 0,00 | 14.559 | 12,41 | |||
| 2026-02-12 | 13F | Caerus Investment Advisors, LLC | 3.053 | 307 | ||||||
| 2025-11-14 | 13F | Bares Capital Management, Inc. | 672.486 | -8,63 | 60.073 | 59,60 | ||||
| 2026-02-17 | 13F | Atreides Management, LP | 870.864 | 1,93 | 87.443 | 14,57 | ||||
| 2026-01-16 | 13F | Empirical Financial Services, LLC d.b.a. Empirical Wealth Management | 3.510 | 352 | ||||||
| 2026-01-28 | 13F | Financial Perspectives, Inc | 57 | 0,00 | 6 | 0,00 | ||||
| 2026-03-12 | 13F/A | Peak6 Llc | 0 | -100,00 | 0 | -100,00 | ||||
| 2026-02-17 | 13F | Gotham Asset Management, LLC | 161.404 | 2,47 | 16.207 | 15,18 | ||||
| 2026-02-03 | 13F/A | Bank Of America Corp /de/ | Put | 0 | -100,00 | 0 | -100,00 | |||
| 2025-11-13 | 13F | Bank Of Montreal /can/ | Call | 0 | -100,00 | 0 | -100,00 | |||
| 2026-02-12 | 13F | Quadrant Capital Group Llc | 6 | 0,00 | 1 | |||||
| 2026-02-10 | 13F | CIBC World Markets Inc. | 4.057 | -3,50 | 407 | 8,53 | ||||
| 2026-04-16 | 13F | Evolve Private Wealth, Llc | 2.681 | -24,37 | 202 | -43,38 | ||||
| 2026-02-11 | 13F | Inceptionr Llc | 0 | -100,00 | 0 | |||||
| 2026-02-14 | 13F | American Trust | 5.250 | -2,23 | 527 | 21,15 | ||||
| 2026-01-27 | 13F | Zurcher Kantonalbank (Zurich Cantonalbank) | 31.541 | 9,67 | 3.167 | 23,28 | ||||
| 2026-02-17 | 13F | Mirabella Financial Services Llp | 3.609 | 362 | ||||||
| 2026-02-12 | 13F | Grey Fox Wealth Advisors, LLC | 0 | -100,00 | 0 | |||||
| 2026-02-03 | 13F | International Assets Investment Management, Llc | 202 | 20 | ||||||
| 2026-02-20 | 13F/A | Prestige Wealth Management Group LLC | 0 | -100,00 | 0 | |||||
| 2026-02-17 | 13F | PDT Partners, LLC | 38.689 | 0,00 | 3.885 | 12,38 | ||||
| 2026-02-17 | 13F | Holocene Advisors, LP | 923.040 | -26,20 | 92.682 | -17,04 | ||||
| 2026-02-17 | 13F | Two Sigma Investments, Lp | 2.036.019 | 6,60 | 204.437 | 19,82 | ||||
| 2026-01-23 | 13F | Optima Capital Llc | 6 | 1 | ||||||
| 2026-02-10 | 13F | Envestnet Asset Management Inc | 18.168 | -5,60 | 1.824 | 6,11 | ||||
| 2026-02-17 | 13F | T. Rowe Price Investment Management, Inc. | 21 | 0 | ||||||
| 2026-01-23 | 13F | Portman Square Capital LLP | Put | 6.100 | -23,75 | 613 | -14,29 | |||
| 2026-01-23 | 13F | Portman Square Capital LLP | 28.422 | -54,20 | 2.854 | -48,53 | ||||
| 2026-01-26 | 13F | Cwm, Llc | 48.821 | 23,63 | 5 | 33,33 | ||||
| 2026-02-17 | 13F | Two Sigma Investments, Lp | Put | 3.000 | 301 | |||||
| 2026-02-17 | 13F | Two Sigma Investments, Lp | Call | 2.000 | 201 | |||||
| 2026-04-20 | 13F | Assenagon Asset Management S.A. | 575.800 | 23.901,67 | 43.306 | 17.943,75 | ||||
| 2026-04-20 | 13F | Ronald Blue Trust, Inc. | 3.035 | 0,00 | 228 | -25,00 | ||||
| 2026-02-17 | 13F | Sherbrooke Park Advisers Llc | 0 | -100,00 | 0 | |||||
| 2026-02-02 | 13F | Cornerstone Planning Group LLC | 3 | -98,94 | 0 | -100,00 | ||||
| 2026-02-05 | 13F | Td Private Client Wealth Llc | 44 | 2,33 | 4 | 33,33 | ||||
| 2025-11-14 | 13F | Corton Capital Inc. | 2.327 | 208 | ||||||
| 2026-02-17 | 13F | Prescott General Partners LLC | 2.922.401 | 0,00 | 293.438 | 12,40 | ||||
| 2026-02-13 | 13F | Landscape Capital Management, L.l.c. | 18.655 | -21,74 | 1.873 | -12,02 | ||||
| 2025-11-14 | 13F | Cinctive Capital Management LP | Put | 0 | -100,00 | 0 | -100,00 | |||
| 2026-02-13 | 13F | Prudential Financial Inc | 4.563 | -36,03 | 458 | -28,10 | ||||
| 2026-02-17 | 13F | Spruce House Investment Management Llc | 0 | -100,00 | 0 | |||||
| 2025-11-06 | 13F | Bryce Point Capital, LLC | 8.271 | 739 | ||||||
| 2026-02-13 | 13F | Kennondale Capital Management LLC | 16.885 | -30,00 | 1.695 | -21,31 | ||||
| 2026-02-12 | 13F | BRYN MAWR TRUST Co | 0 | -100,00 | 0 | -100,00 | ||||
| 2026-04-16 | 13F | Toth Financial Advisory Corp | 2 | 0,00 | 0 | |||||
| 2026-02-06 | 13F | GPS Wealth Strategies Group, LLC | 0 | -100,00 | 0 | |||||
| 2026-04-21 | 13F | Vise Technologies, Inc. | 6.400 | 0,00 | 643 | 0,00 | ||||
| 2026-02-17 | 13F | Parallax Volatility Advisers, L.P. | 32.291 | -27,03 | 3.242 | -17,99 | ||||
| 2026-02-17 | 13F | Parallax Volatility Advisers, L.P. | Put | 194.500 | -17,16 | 19.530 | -6,89 | |||
| 2026-02-17 | 13F | Nomura Holdings Inc | Call | 259.000 | 0,00 | 26.006 | 12,40 | |||
| 2026-02-17 | 13F | Caption Management, LLC | Put | 0 | -100,00 | 0 | ||||
| 2026-01-26 | 13F | KBC Group NV | 12.699 | 350,96 | 1 | |||||
| 2026-02-09 | 13F | Annis Gardner Whiting Capital Advisors, LLC | 5.760 | 0,00 | 578 | 12,45 | ||||
| 2026-02-17 | 13F | Parallax Volatility Advisers, L.P. | Call | 342.100 | -11,42 | 34.350 | -0,43 | |||
| 2026-02-17 | 13F | Nomura Holdings Inc | Put | 100.000 | 0,00 | 10.041 | 12,40 | |||
| 2026-02-06 | 13F | HighTower Advisors, LLC | 2.353 | -2,37 | 236 | 9,77 | ||||
| 2026-02-06 | 13F | BloombergSen Inc. | 61.186 | 5,81 | 6.144 | 18,94 | ||||
| 2026-02-11 | 13F | Deutsche Bank Ag\ | 8.808 | -22,12 | 884 | -12,48 | ||||
| 2026-02-13 | 13F | State Street Corp | 2.289.354 | 38,21 | 229.874 | 55,35 | ||||
| 2026-02-13 | 13F | National Bank Of Canada /fi/ | Call | 0 | -100,00 | 0 | -100,00 | |||
| 2026-02-17 | 13F | Schonfeld Strategic Advisors LLC | 11.052 | -3,68 | 1.110 | 8,30 | ||||
| 2026-02-14 | 13F | Rockefeller Capital Management L.P. | 295 | 9,26 | 30 | 20,83 | ||||
| 2026-02-09 | 13F | Clear Investment Research, Llc | 0 | -100,00 | 0 | |||||
| 2026-02-10 | 13F | Nomura Asset Management Co Ltd | 20.212 | 1.642,41 | 2.029 | 1.869,90 | ||||
| 2026-02-17 | 13F | Graham Capital Management, L.P. | 30.150 | 174,69 | 3.027 | 208,88 | ||||
| 2026-02-06 | 13F | Check Capital Management Inc/ca | 167.192 | -0,39 | 16.788 | 11,96 | ||||
| 2026-02-10 | 13F | Rothschild Investment Llc | 1.401 | 27,95 | 141 | 44,33 | ||||
| 2026-02-17 | 13F | Prelude Capital Management, Llc | 2.516 | 253 | ||||||
| 2026-02-17 | 13F | Night Squared LP | 42.067 | -30,37 | 4.224 | -21,74 | ||||
| 2025-11-13 | 13F | Css Llc/il | Call | 0 | -100,00 | 0 | -100,00 | |||
| 2025-11-14 | 13F | Natixis | 0 | -100,00 | 0 | |||||
| 2026-04-07 | 13F | Signaturefd, Llc | 7.184 | 1,27 | 540 | -24,16 | ||||
| 2026-02-17 | 13F | Limestone Investment Advisors LP | 0 | -100,00 | 0 | |||||
| 2026-04-14 | 13F | Covenant Asset Management, LLC | 0 | -100,00 | 0 | |||||
| 2026-01-28 | 13F | Rothschild & Co Wealth Management UK Ltd | 263.147 | 5,28 | 26.423 | 18,34 | ||||
| 2026-02-12 | 13F | Bank Of Montreal /can/ | 559.668 | -6,52 | 56.196 | 5,08 | ||||
| 2026-02-17 | 13F | Jones Financial Companies Lllp | 2.126 | 163,44 | 213 | 204,29 | ||||
| 2026-02-11 | 13F | Syon Capital Llc | 3.841 | 50,98 | 386 | 69,60 | ||||
| 2026-02-06 | 13F | Flynn Zito Capital Management, Llc | 2.607 | -13,90 | 262 | -3,33 | ||||
| 2026-02-12 | 13F | Rossby Financial, LCC | 4 | 0 | ||||||
| 2026-01-29 | 13F | UBS Group AG | Call | 0 | -100,00 | 0 | -100,00 | |||
| 2026-02-12 | 13F | CIBC Private Wealth Group, LLC | 63 | 90,91 | 6 | 200,00 | ||||
| 2026-02-17 | 13F | Susquehanna Portfolio Strategies, LLC | 182.231 | 0,00 | 18.298 | 12,40 | ||||
| 2026-02-10 | 13F | CIBC Asset Management Inc | 3.392 | 14,63 | 341 | 28,79 | ||||
| 2026-02-17 | 13F | Susquehanna International Group, Llp | Call | 1.792.200 | 2,20 | 179.955 | 14,87 | |||
| 2026-04-06 | 13F | GAMMA Investing LLC | 1.952 | 2,09 | 147 | -23,56 | ||||
| 2026-01-22 | 13F | Bear Mountain Capital, Inc. | 6 | 0,00 | 1 | |||||
| 2026-04-09 | 13F | Chemistry Wealth Management LLC | 42.834 | -0,31 | 3.222 | -25,34 | ||||
| 2026-02-09 | 13F | Lisanti Capital Growth, LLC | 56.245 | 5.648 | ||||||
| 2026-02-17 | 13F | Wellington Management Group Llp | 1.140.751 | 128,04 | 114.543 | 156,33 | ||||
| 2026-02-17 | 13F | Wellington Management Group Llp | Put | 2.063 | 491 | |||||
| 2026-02-11 | 13F | Harvest Fund Management Co., Ltd | 4.187 | 477,52 | 0 | |||||
| 2026-01-29 | 13F | Teachers Retirement System Of The State Of Kentucky | 128.771 | -9,18 | 13 | 0,00 | ||||
| 2026-04-22 | 13F | Janney Montgomery Scott LLC | 8.129 | 234,39 | 1 | |||||
| 2026-02-13 | 13F | BNP Paribas Asset Management Holding S.A. | 1.380 | 44,96 | 0 | |||||
| 2026-02-17 | 13F | VARCOV Co. | 2.033 | 204 | ||||||
| 2026-04-09 | 13F | Wedmont Private Capital | 3.984 | 5,56 | 296 | -28,92 | ||||
| 2026-02-11 | 13F | IMA Wealth, Inc. | 22 | 2 | ||||||
| 2025-11-14 | 13F | Cubist Systematic Strategies, LLC | Call | 94.200 | 0,00 | 8.415 | 74,67 | |||
| 2025-11-05 | 13F | SOUTH STATE Corp | 0 | -100,00 | 0 | |||||
| 2025-11-14 | 13F | Cubist Systematic Strategies, LLC | Put | 81.800 | -11,76 | 7.307 | 54,16 | |||
| 2026-01-29 | 13F | Comerica Bank | 680 | 7,26 | 68 | 21,43 | ||||
| 2026-02-05 | 13F | Amalgamated Bank | 6.199 | 18,32 | 1 | |||||
| 2026-02-17 | 13F | Bank Of America Corp /de/ | 581.874 | 28,89 | 58.426 | 44,87 | ||||
| 2026-02-05 | 13F | Allworth Financial LP | 1.850 | 110,95 | 186 | 137,18 | ||||
| 2026-02-17 | 13F | Integrated Advisors Network LLC | 3.238 | 1,06 | 325 | 13,64 | ||||
| 2026-02-11 | 13F | Empowered Funds, LLC | 4.071 | 16,65 | 409 | 31,19 | ||||
| 2026-02-11 | 13F | Cerity Partners LLC | 40.690 | 43,08 | 4.086 | 60,83 | ||||
| 2026-02-17 | 13F | Northern Trust Corp | 492.857 | -0,48 | 49.488 | 11,86 | ||||
| 2026-02-04 | 13F | Swiss Life Asset Management Ltd | 7.373 | 67,23 | 740 | 88,30 | ||||
| 2026-02-13 | 13F | Wells Fargo & Company/mn | Call | 0 | -100,00 | 0 | -100,00 | |||
| 2026-02-09 | 13F | Accent Capital Management, LLC | 60 | 6 | ||||||
| 2026-02-10 | 13F | Connor, Clark & Lunn Investment Management Ltd. | 383.943 | 83,79 | 38.552 | 106,59 | ||||
| 2026-02-10 | 13F | Semanteon Capital Management, LP | 0 | -100,00 | 0 | |||||
| 2026-02-17 | 13F | Susquehanna International Group, Llp | 164.435 | -0,30 | 16.511 | 12,06 | ||||
| 2026-02-10 | 13F | Axq Capital, Lp | 13.918 | 1.398 | ||||||
| 2026-02-17 | 13F | Susquehanna International Group, Llp | Put | 1.005.500 | -20,15 | 100.962 | -10,25 | |||
| 2026-02-12 | 13F | Triumph Capital Management | 4.063 | 408 | ||||||
| 2026-04-23 | 13F | SJS Investment Consulting Inc. | 44 | -83,33 | 3 | -88,46 | ||||
| 2026-02-17 | 13F | Dark Forest Capital Management Lp | 28.641 | -58,86 | 2.876 | -53,77 | ||||
| 2026-02-13 | 13F | Squarepoint Ops LLC | Call | 211.200 | -61,53 | 21.207 | -56,76 | |||
| 2026-02-13 | 13F | Squarepoint Ops LLC | Put | 77.400 | -84,92 | 7.772 | -83,05 | |||
| 2026-02-09 | 13F | Keating Financial Advisory Services, Inc. | 33 | 3 | ||||||
| 2026-02-17 | 13F | Davidson Kempner Capital Management Lp | 150.000 | -40,00 | 15.062 | -32,56 | ||||
| 2026-02-13 | 13F | Smartleaf Asset Management LLC | 123 | 18,27 | 12 | 33,33 | ||||
| 2026-02-13 | 13F | Ieq Capital, Llc | 96.251 | 111,92 | 9.665 | 138,21 | ||||
| 2025-11-14 | 13F | Wolverine Trading, Llc | 55.698 | -10,78 | 4.968 | 55,36 | ||||
| 2026-02-13 | 13F | Bank Of Nova Scotia | 0 | -100,00 | 0 | -100,00 | ||||
| 2025-11-14 | 13F | Wolverine Trading, Llc | Call | 498.100 | 17,20 | 44.426 | 104,08 | |||
| 2025-11-14 | 13F | Wolverine Trading, Llc | Put | 347.000 | 3,18 | 30.949 | 79,67 | |||
| 2026-02-11 | 13F | Illinois Municipal Retirement Fund | 38.232 | 66,02 | 3.839 | 86,58 | ||||
| 2026-01-23 | 13F | Rsm Us Wealth Management Llc | 2.161 | 218 | ||||||
| 2026-02-17 | 13F | D. E. Shaw & Co., Inc. | Call | 149.700 | -1,71 | 15.031 | 10,49 | |||
| 2026-01-13 | 13F | Stonehearth Capital Management, LLC | 0 | -100,00 | 0 | |||||
| 2026-02-11 | 13F | Simplex Trading, Llc | Call | 99.000 | -53,61 | 9.941 | 52.215,79 | |||
| 2026-02-11 | 13F | Simplex Trading, Llc | Put | 359.800 | -29,30 | 36.128 | 80.182,22 | |||
| 2026-02-17 | 13F | D. E. Shaw & Co., Inc. | 2.058.769 | 59,74 | 206.721 | 79,56 | ||||
| 2026-04-23 | 13F | Forum Financial Management, LP | 0 | -100,00 | 0 | |||||
| 2026-02-11 | 13F | Simplex Trading, Llc | 81.918 | 63,74 | 8.225 | 205.525,00 | ||||
| 2026-02-17 | 13F | D. E. Shaw & Co., Inc. | Put | 570.300 | -9,88 | 57.264 | 1,30 | |||
| 2026-02-17 | 13F | Southpoint Capital Advisors LP | 1.500.000 | -40,00 | 150.615 | -32,56 | ||||
| 2026-02-04 | 13F | Clark Wealth Partners | 0 | -100,00 | 0 | |||||
| 2025-11-14 | 13F | Maple Rock Capital Partners Inc. | 0 | -100,00 | 0 | -100,00 | ||||
| 2025-11-14 | 13F | Harbourvest Partners Llc | 0 | -100,00 | 0 | |||||
| 2026-04-08 | 13F | Wealth Enhancement Advisory Services, Llc | 21.629 | -15,12 | 1.570 | -44,15 | ||||
| 2026-02-09 | 13F | Quest Partners LLC | 11.053 | -0,08 | 1.110 | 12,25 | ||||
| 2026-02-17 | 13F | Freestone Grove Partners LP | 15.669 | 1.573 | ||||||
| 2026-02-17 | 13F | DV Trading LLC | 11 | 1 | ||||||
| 2026-04-27 | 13F | Y-Intercept (Hong Kong) Ltd | 9.299 | -88,75 | 699 | -91,58 | ||||
| 2026-02-10 | 13F | Quantbot Technologies LP | 0 | -100,00 | 0 | |||||
| 2025-12-01 | 13F | Groupama Asset Managment | 602 | -47,65 |