Grundlæggende statistik
| Institutionelle aktier (lange) | 155.741.138 - 32,32% (ex 13D/G) - change of 43,66MM shares 38,95% MRQ |
| Institutionel værdi (lang) | $ 1.358.165 USD ($1000) |
Institutionelt ejerskab og aktionærer
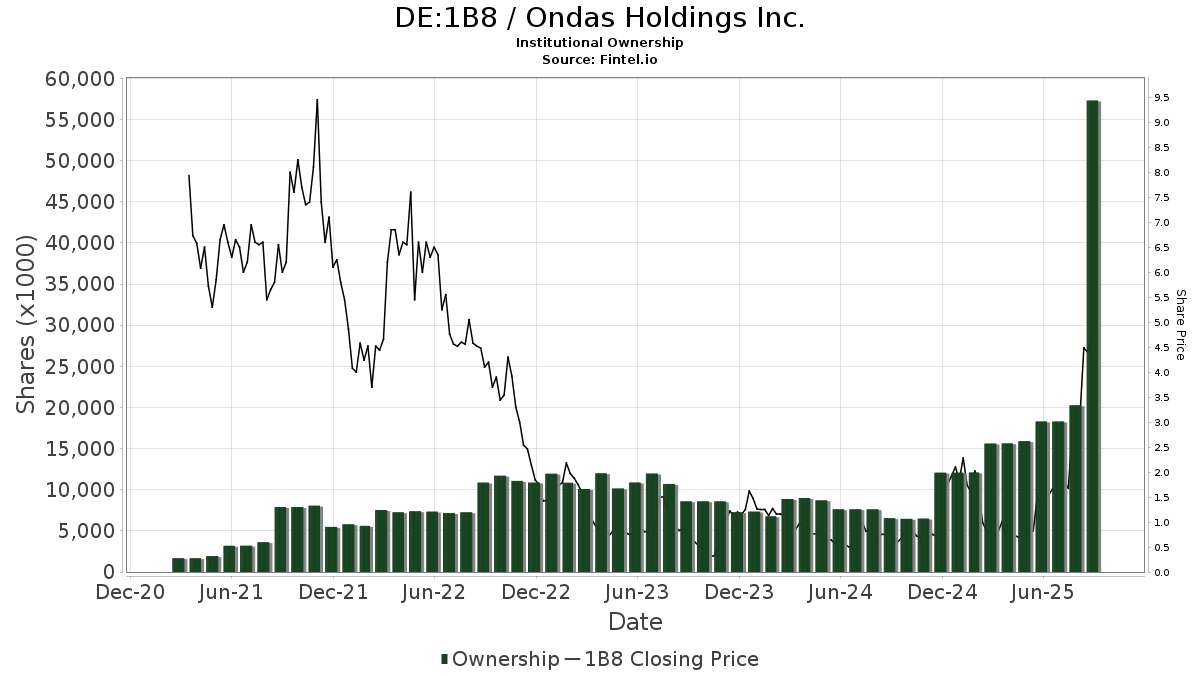
Ondas Inc. (DE:1B8) har 269 institutionelle ejere og aktionærer, der har indsendt 13D/G- eller 13F-formularer til Securities Exchange Commission (SEC). Disse institutioner har i alt 155,741,138 aktier. Største aktionærer omfatter Vanguard Group Inc, Hood River Capital Management LLC, Jane Street Group, Llc, Susquehanna International Group, Llp, Citadel Advisors Llc, BlackRock, Inc., Van Eck Associates Corp, Citadel Advisors Llc, Hrt Financial Lp, and State Street Corp .
Ondas Inc. (DB:1B8) institutionel ejerskabsstruktur viser aktuelle positioner i virksomheden efter institutioner og fonde, samt seneste ændringer i positionsstørrelse. Større aktionærer kan omfatte individuelle investorer, investeringsforeninger, hedgefonde eller institutioner. Skema 13D angiver, at investoren besidder (eller besidder) mere end 5 % af virksomheden og har til hensigt (eller har til hensigt at) aktivt at forfølge en ændring i forretningsstrategi. Skema 13G indikerer en passiv investering på over 5%.
The share price as of April 10, 2026 is 7,75 / share. Previously, on April 14, 2025, the share price was 0,73 / share. This represents an increase of 964,56% over that period.
Fondens stemningsscore
Fund Sentiment Score (fka Ownership Accumulation Score) finder de aktier, der bliver mest købt af fonde. Det er resultatet af en sofistikeret, multi-faktor kvantitativ model, der identificerer virksomheder med de højeste niveauer af institutionel akkumulering. Scoringsmodellen bruger en kombination af den samlede stigning i oplyste ejere, ændringerne i porteføljeallokeringer i disse ejere og andre målinger. Tallet går fra 0 til 100, hvor højere tal indikerer et højere niveau af akkumulering for sine jævnaldrende, og 50 er gennemsnittet.
Opdateringsfrekvens: Dagligt
Se Ownership Explorer, som giver en liste over højest rangerende virksomheder.
AI+ Ask Fintel’s AI assistant about Ondas Inc..
Select a question to share a public post with an AI-crafted answer.
Thinking of good questions…
13F og NPORT arkivering
Detaljer om 13F-arkivering er gratis. Detaljer om NP-ansøgninger kræver et premium-medlemskab. Grønne rækker angiver nye positioner. Røde rækker angiver lukkede positioner. Klik på linket ikon for at se den fulde transaktionshistorik.
Opgrader
for at låse premium-data op og eksportere til Excel ![]() .
.
| Fil dato | Kilde | Investor | Type | Gennemsnitlig pris (Øst) |
Aktier | Δ Aktier (%) |
Rapporteret Værdi ($1000) |
Δ Værdi (%) |
Port Alloc (%) |
|
|---|---|---|---|---|---|---|---|---|---|---|
| 2026-02-02 | 13F | Oppenheimer & Co Inc | 130.652 | 1.275 | ||||||
| 2026-02-17 | 13F | Soviero Asset Management, LP | 0 | -100,00 | 0 | -100,00 | ||||
| 2026-02-03 | 13F | International Assets Investment Management, Llc | 541 | 5 | ||||||
| 2025-11-12 | 13F | Monashee Investment Management LLC | 0 | -100,00 | 0 | -100,00 | ||||
| 2026-04-08 | 13F | Wealth Enhancement Advisory Services, Llc | 267.082 | 36,09 | 2.564 | 1,75 | ||||
| 2026-02-17 | 13F | Two Sigma Investments, Lp | 4.958.128 | 8,53 | 48.391 | 37,22 | ||||
| 2026-01-21 | 13F | Newbridge Financial Services Group, Inc. | 1.000 | 10 | ||||||
| 2026-01-29 | 13F | IMC-Chicago, LLC | 348.815 | 257,66 | 3.404 | 352,66 | ||||
| 2026-02-13 | 13F | Kestra Advisory Services, LLC | 12.991 | -12,44 | 127 | 10,53 | ||||
| 2026-02-10 | 13F | Thames Capital Management Llc | 1.596.709 | -18,67 | 15.584 | 2,82 | ||||
| 2026-02-17 | 13F | Advisor Group Holdings, Inc. | 125.854 | -20,48 | 1.228 | 1,66 | ||||
| 2026-02-11 | 13F | X-Square Capital, LLC | 300.000 | 100,00 | 3 | 100,00 | ||||
| 2026-02-13 | 13F | Landscape Capital Management, L.l.c. | 11.569 | 113 | ||||||
| 2026-02-09 | 13F | SLT Holdings LLC | 80.500 | 373,53 | 786 | 499,24 | ||||
| 2026-02-17 | 13F | SIH Partners, LLLP | 0 | -100,00 | 0 | -100,00 | ||||
| 2026-02-12 | 13F | Wedbush Securities Inc | 34.050 | 0 | ||||||
| 2026-02-12 | 13F | Summit Financial, LLC | 10.461 | 102 | ||||||
| 2026-02-17 | 13F | Guggenheim Capital Llc | 24.179 | 236 | ||||||
| 2026-01-29 | 13F | Marathon Capital Management | 17.625 | -35,91 | 172 | -18,87 | ||||
| 2026-02-17 | 13F | Sig Brokerage, Lp | 0 | -100,00 | 0 | -100,00 | ||||
| 2026-02-17 | 13F | Susquehanna International Group, Llp | 1.546.596 | -4,85 | 15.095 | 20,29 | ||||
| 2026-02-17 | 13F | Sig Brokerage, Lp | Call | 0 | -100,00 | 0 | -100,00 | |||
| 2026-02-17 | 13F | Susquehanna International Group, Llp | Put | 4.408.800 | -11,53 | 43.030 | 11,85 | |||
| 2026-02-18 | 13F | GWM Advisors LLC | 44.308 | 1.284,62 | 432 | 1.700,00 | ||||
| 2026-02-13 | 13F | OMERS ADMINISTRATION Corp | 24.900 | 243 | ||||||
| 2026-02-17 | 13F | Susquehanna International Group, Llp | Call | 9.137.900 | 38,64 | 89.186 | 75,28 | |||
| 2026-01-28 | 13F | Universal- Beteiligungs- und Servicegesellschaft mbH | 42.938 | 176,32 | 410 | 243,70 | ||||
| 2026-02-10 | 13F | Bank of New York Mellon Corp | 86.990 | 72,35 | 849 | 118,25 | ||||
| 2025-11-14 | 13F | DRW Securities, LLC | Call | 0 | -100,00 | 0 | -100,00 | |||
| 2026-02-04 | 13F | Tsfg, Llc | 1.300 | 0 | ||||||
| 2026-02-09 | 13F | Geode Capital Management, Llc | 4.255.992 | 22,26 | 41.558 | 54,57 | ||||
| 2026-02-17 | 13F | Royal Bank Of Canada | 147.874 | 180,11 | 1.443 | 253,68 | ||||
| 2025-10-20 | 13F | XML Financial, LLC | 0 | -100,00 | 0 | -100,00 | ||||
| 2026-02-06 | 13F | Larson Financial Group LLC | 1.838 | -36,80 | 18 | -22,73 | ||||
| 2026-02-17 | 13F | Raymond James Financial Inc | 547.614 | 100,40 | 5.345 | 153,39 | ||||
| 2026-01-22 | 13F | Bear Mountain Capital, Inc. | 400 | 5 | ||||||
| 2026-01-23 | 13F | Avion Wealth | 4.000 | 100,00 | 0 | |||||
| 2026-04-10 | 13F | Piscataqua Savings Bank | 2.000 | 18 | ||||||
| 2025-11-14 | 13F | Cubist Systematic Strategies, LLC | 1.086.841 | 8.390 | ||||||
| 2025-10-20 | 13F | Heritage Oak Wealth Advisors Llc | 0 | -100,00 | 0 | -100,00 | ||||
| 2026-02-06 | 13F | IFP Advisors, Inc | 3.142 | -24,14 | 31 | -3,23 | ||||
| 2026-02-12 | 13F | Concorde Asset Management, LLC | 10.666 | 104 | ||||||
| 2026-04-03 | 13F | Investors Research Corp | 784 | 7 | ||||||
| 2026-02-13 | 13F | Squarepoint Ops LLC | 0 | -100,00 | 0 | -100,00 | ||||
| 2026-01-30 | 13F | Wealthfront Advisers Llc | 15.000 | 146 | ||||||
| 2026-02-19 | 13F | Invesco Ltd. | 1.873.485 | -44,30 | 18.285 | -29,58 | ||||
| 2026-02-17 | 13F | MIRAE ASSET GLOBAL ETFS HOLDINGS Ltd. | 267.941 | 2.409 | ||||||
| 2026-02-13 | 13F | Mml Investors Services, Llc | 10.517 | -12,48 | 103 | 10,87 | ||||
| 2026-02-13 | 13F | MAI Capital Management | 2.100 | 20 | ||||||
| 2026-02-12 | 13F | IFC & Insurance Marketing, Inc. | 260 | 0 | ||||||
| 2026-02-09 | 13F | Legal & General Group Plc | 1.537.400 | 14.215 | ||||||
| 2026-02-13 | 13F | Victory Capital Management Inc | 41.592 | 28,04 | 406 | 62,00 | ||||
| 2026-02-17 | 13F | Advisory Services Network, LLC | 0 | -100,00 | 0 | |||||
| 2026-02-05 | 13F | Staley Capital Advisers Inc | 19.000 | 58,33 | 185 | 101,09 | ||||
| 2026-02-10 | 13F | Foundations Investment Advisors, LLC | 80.500 | 373,53 | 786 | 499,24 | ||||
| 2026-02-12 | 13F | EAM Investors, LLC | 54.248 | -71,77 | 529 | -64,33 | ||||
| 2026-02-27 | 13F | Strategic Investment Solutions, Inc. /IL | 0 | -100,00 | 0 | |||||
| 2026-02-13 | 13F | Ubs Asset Management Americas Inc | 544.435 | 5.314 | ||||||
| 2026-02-17 | 13F | Graham Capital Management, L.P. | Call | 100.000 | 976 | |||||
| 2026-04-10 | 13F | Quaker Wealth Management, LLC | 500 | 5 | ||||||
| 2026-02-17 | 13F | Graham Capital Management, L.P. | 61.416 | 599 | ||||||
| 2026-02-13 | 13F | JustInvest LLC | 10.276 | 100 | ||||||
| 2026-02-12 | 13F | SWAN Capital LLC | 100 | 0,00 | 1 | |||||
| 2026-02-05 | 13F | Triton Wealth Management, PLLC | 10.465 | 115 | ||||||
| 2026-02-03 | 13F | Koshinski Asset Management, Inc. | 17.500 | -29,72 | 171 | -11,46 | ||||
| 2026-02-17 | 13F | Cresset Asset Management, LLC | 11.957 | 3.005,71 | 117 | 5.700,00 | ||||
| 2026-02-13 | 13F | FORA Capital, LLC | 301.369 | 178,68 | 3.873 | 364,27 | ||||
| 2026-01-30 | 13F | Us Bancorp \de\ | 5.000 | 0,00 | 49 | 26,32 | ||||
| 2026-01-20 | 13F | Stratos Wealth Partners, LTD. | 0 | -100,00 | 0 | -100,00 | ||||
| 2026-02-11 | 13F | J.w. Cole Advisors, Inc. | 30.739 | 7 | ||||||
| 2026-02-13 | 13F | MYDA Advisors LLC | 160.000 | 1.562 | ||||||
| 2026-02-13 | 13F | Centiva Capital, LP | 55.503 | 542 | ||||||
| 2026-02-17 | 13F | Price T Rowe Associates Inc /md/ | 896.900 | -36,86 | 9 | -20,00 | ||||
| 2026-02-24 | 13F | DGS Capital Management, LLC | 12.181 | 119 | ||||||
| 2026-01-27 | 13F | Busey Wealth Management | 11.350 | 0,00 | 111 | 26,44 | ||||
| 2026-01-26 | 13F | Paradigm Financial Partners, Llc | 0 | -100,00 | 0 | -100,00 | ||||
| 2026-02-12 | 13F | EHP Funds Inc. | 0 | -100,00 | 0 | -100,00 | ||||
| 2026-02-17 | 13F | PharVision Advisers, LLC | 18.641 | 182 | ||||||
| 2026-02-17 | 13F | Private Advisor Group, LLC | 488.222 | 108,75 | 4.765 | 163,99 | ||||
| 2026-01-29 | 13F | Anchyra Partners Llc | 25.493 | 249 | ||||||
| 2026-02-10 | 13F | State of Wyoming | 5.178 | 51 | ||||||
| 2025-10-21 | 13F | Ntv Asset Management Llc | 0 | -100,00 | 0 | -100,00 | ||||
| 2025-11-14 | 13F | Harber Asset Management Llc | 0 | -100,00 | 0 | -100,00 | ||||
| 2026-01-29 | 13F | Vanguard Group Inc | 18.767.157 | 39,89 | 183.167 | 76,86 | ||||
| 2026-02-04 | 13F | Perkins Capital Management Inc | 202.533 | -1,07 | 1.977 | 25,06 | ||||
| 2026-02-09 | 13F | HBK Sorce Advisory LLC | 16.768 | 67,16 | 162 | 70,53 | ||||
| 2026-02-13 | 13F | State Street Corp | 5.162.151 | 130,24 | 50.383 | 191,09 | ||||
| 2026-02-05 | 13F | DnB Asset Management AS | 674.498 | 104,42 | 6.583 | 158,46 | ||||
| 2026-01-28 | 13F | Teacher Retirement System Of Texas | 11.553 | 113 | ||||||
| 2026-02-13 | 13F | Quarry LP | 1.257 | 12 | ||||||
| 2026-02-03 | 13F | SBI Securities Co., Ltd. | 118.636 | -6,12 | 1.158 | 18,67 | ||||
| 2026-02-13 | 13F | Barclays Plc | 18.829 | 4.351,30 | 184 | 6.000,00 | ||||
| 2026-02-18 | 13F | Beacon Pointe Advisors, LLC | 15.830 | 155 | ||||||
| 2026-02-10 | 13F/A | Northwestern Mutual Wealth Management Co | 251 | 2 | ||||||
| 2026-01-20 | 13F | Stratos Wealth Advisors, LLC | 11.000 | 107 | ||||||
| 2026-02-10 | 13F | CIBC World Markets Inc. | 99.807 | 974 | ||||||
| 2025-11-14 | 13F | Summit Trail Advisors, Llc | 0 | -100,00 | 0 | -100,00 | ||||
| 2026-02-23 | 13F | Virtu Financial LLC | 231.781 | 2 | ||||||
| 2026-02-10 | 13F | Thompson Siegel & Walmsley Llc | 38.077 | -90,73 | 0 | -100,00 | ||||
| 2026-02-17 | 13F | Jones Financial Companies Lllp | 59.975 | 12,09 | 585 | 43,03 | ||||
| 2026-02-17 | 13F | Clear Street Markets Llc | 602 | 6 | ||||||
| 2026-02-03 | 13F | Mitsubishi UFJ Kokusai Asset Management Co., Ltd. | 78.392 | 864 | ||||||
| 2026-04-10 | 13F | Armstrong Advisory Group, Inc | 700 | 0,00 | 6 | 0,00 | ||||
| 2026-02-17 | 13F | Boothbay Fund Management, Llc | 161.539 | 1.577 | ||||||
| 2026-01-12 | 13F | Traynor Capital Management, Inc. | 12.569 | 123 | ||||||
| 2026-01-06 | 13F | Penbrook Management LLC | 10.005 | -27,79 | 98 | -8,49 | ||||
| 2026-02-13 | 13F | Verition Fund Management LLC | Put | 0 | -100,00 | 0 | -100,00 | |||
| 2026-02-13 | 13F | Y-Intercept (Hong Kong) Ltd | 434.528 | 4.241 | ||||||
| 2025-11-12 | 13F | CIBC Bancorp USA Inc. | 17.027 | 131 | ||||||
| 2026-01-14 | 13F | Exchange Traded Concepts, Llc | 1.999.716 | 19.517 | ||||||
| 2026-02-06 | 13F | Handelsbanken Fonder AB | 99.200 | 1 | ||||||
| 2026-02-17 | 13F | Fmr Llc | 187 | -81,30 | 2 | -85,71 | ||||
| 2026-02-17 | 13F | Hood River Capital Management LLC | 17.357.213 | 7,80 | 169.406 | 36,29 | ||||
| 2026-02-17 | 13F | Caption Management, LLC | 0 | -100,00 | 0 | -100,00 | ||||
| 2026-02-13 | 13F | Headlands Technologies LLC | 507.231 | 4.951 | ||||||
| 2026-02-17 | 13F | J. Goldman & Co LP | Call | 150.000 | 1.464 | |||||
| 2026-02-17 | 13F | XTX Topco Ltd | 0 | -100,00 | 0 | |||||
| 2026-01-27 | 13F | GHP Investment Advisors, Inc. | 100 | 1 | ||||||
| 2026-01-30 | 13F | R Squared Ltd | 23.799 | 232 | ||||||
| 2026-02-19 | 13F | Connective Capital Management, LLC | 68.487 | 668 | ||||||
| 2026-02-13 | 13F | Cito Capital Group, LLC | 413.000 | -6,73 | 4 | 33,33 | ||||
| 2025-11-06 | 13F | MSH Capital Advisors LLC | 0 | -100,00 | 0 | -100,00 | ||||
| 2026-01-27 | 13F | TD Waterhouse Canada Inc. | 1.000 | 100,00 | 10 | 200,00 | ||||
| 2026-02-17 | 13F | Brevan Howard Capital Management LP | 33.324 | -81,96 | 325 | -77,19 | ||||
| 2026-02-17 | 13F | Scientech Research LLC | 197.387 | 1.926 | ||||||
| 2026-02-06 | 13F | Global Retirement Partners, LLC | 13.000 | 30,00 | 127 | 63,64 | ||||
| 2026-01-29 | 13F | UBS Group AG | 1.888.800 | 126,11 | 18.435 | 185,89 | ||||
| 2026-01-16 | 13F | FNY Investment Advisers, LLC | 20.000 | 0 | ||||||
| 2026-01-16 | 13F | FNY Investment Advisers, LLC | Call | 105 | 0 | |||||
| 2026-01-30 | 13F | Activest Wealth Management | 13.000 | 127 | ||||||
| 2026-02-13 | 13F | Walleye Trading LLC | Call | 470.300 | 146,49 | 4.590 | 211,82 | |||
| 2026-02-13 | 13F | Walleye Trading LLC | 313.897 | 3.064 | ||||||
| 2025-11-14 | 13F | Manatuck Hill Partners, LLC | 0 | -100,00 | 0 | -100,00 | ||||
| 2026-02-11 | 13F | Janney Montgomery Scott LLC | 45.093 | 0 | ||||||
| 2026-02-02 | 13F | Truist Financial Corp | 59.200 | 10,76 | 578 | 40,05 | ||||
| 2026-02-17 | 13F | Cresset Asset Management, LLC | Put | 0 | -100,00 | 0 | -100,00 | |||
| 2026-02-13 | 13F | Healthcare Of Ontario Pension Plan Trust Fund | 0 | -100,00 | 0 | -100,00 | ||||
| 2026-02-17 | 13F | Caption Management, LLC | Call | 350.000 | 169,23 | 3.416 | 240,58 | |||
| 2026-02-23 | 13F | Beaird Harris Wealth Management, LLC | 27.250 | 3,81 | 266 | 31,19 | ||||
| 2026-02-13 | 13F | Walleye Trading LLC | Put | 474.600 | 300,84 | 4.632 | 406,78 | |||
| 2026-02-17 | 13F | Cresset Asset Management, LLC | Call | 0 | -100,00 | 0 | -100,00 | |||
| 2026-02-17 | 13F | Concentric Capital Strategies, LP | 198.525 | 1.938 | ||||||
| 2026-01-26 | 13F | Shelton Wealth Management, Llc | Call | 13.000 | 127 | |||||
| 2026-01-26 | 13F | Shelton Wealth Management, Llc | 45 | 0 | ||||||
| 2026-02-17 | 13F | Magnetar Financial LLC | 114.823 | 1.121 | ||||||
| 2026-01-09 | 13F | SG Americas Securities, LLC | 18.395 | 82,04 | 0 | |||||
| 2026-03-16 | 13F/A | Rockefeller Capital Management L.P. | 48.803 | 2.340,15 | 476 | 3.073,33 | ||||
| 2026-01-30 | 13F | American Capital Advisory, LLC | 4.700 | 4.600,00 | 46 | |||||
| 2026-02-10 | 13F | Peapack Gladstone Financial Corp | 10.000 | 0,00 | 0 | |||||
| 2026-02-17 | 13F | D. E. Shaw & Co., Inc. | Call | 0 | -100,00 | 0 | -100,00 | |||
| 2026-01-29 | 13F | Concurrent Investment Advisors, LLC | Call | 0 | -100,00 | 0 | -100,00 | |||
| 2026-02-13 | 13F | Hudson Bay Capital Management LP | 95.210 | 299,54 | 929 | 407,65 | ||||
| 2026-01-28 | 13F | Arizona State Retirement System | 96.378 | 941 | ||||||
| 2026-02-10 | 13F | Belvedere Trading LLC | Call | 0 | -100,00 | 0 | -100,00 | |||
| 2026-02-05 | 13F | Cambridge Investment Research Advisors, Inc. | 15.275 | 0 | ||||||
| 2026-03-04 | 13F | SHP Wealth Management | 493 | 5 | ||||||
| 2025-11-14 | 13F | Bleichroeder LP | 0 | -100,00 | 0 | -100,00 | ||||
| 2026-02-17 | 13F | Family Management Corp | 10.000 | 98 | ||||||
| 2025-11-14 | 13F | Wolverine Trading, Llc | 0 | -100,00 | 0 | -100,00 | ||||
| 2026-02-17 | 13F | Perennial Investment Advisors, LLC | 16.490 | 22,15 | 161 | 53,85 | ||||
| 2026-02-17 | 13F | Northern Trust Corp | 930.698 | 52,80 | 9.084 | 93,17 | ||||
| 2026-02-12 | 13F | Skopos Labs, Inc. | 18.034 | 153 | ||||||
| 2026-02-17 | 13F | Captrust Financial Advisors | 45.785 | 0,74 | 447 | 27,43 | ||||
| 2026-02-12 | 13F | Hrt Financial Lp | 6.210.148 | 112,56 | 61 | 172,73 | ||||
| 2026-02-13 | 13F | Gts Securities Llc | 208.891 | 2.039 | ||||||
| 2026-04-09 | 13F | Thrive Wealth Management, LLC | 13.024 | 118 | ||||||
| 2026-02-11 | 13F | Jpmorgan Chase & Co | 183.904 | -91,09 | 1.795 | -88,74 | ||||
| 2026-02-17 | 13F | Dark Forest Capital Management Lp | 45.775 | -37,31 | 447 | -20,78 | ||||
| 2026-02-17 | 13F | Two Sigma Advisers, Lp | 13.563 | -97,91 | 132 | -97,36 | ||||
| 2026-02-17 | 13F | Jump Financial, LLC | 1.270.947 | 296,01 | 12.404 | 400,77 | ||||
| 2026-02-13 | 13F | Vontobel Holding Ltd. | Call | 59.900 | 585 | |||||
| 2026-01-29 | 13F | Concurrent Investment Advisors, LLC | 17.926 | 139,01 | 175 | 205,26 | ||||
| 2026-02-17 | 13F | Qube Research & Technologies Ltd | 170.633 | 1.665 | ||||||
| 2026-02-04 | 13F | Atlantic Union Bankshares Corp | 1.000 | 10 | ||||||
| 2026-04-10 | 13F | Octavia Wealth Advisors, LLC | 15.033 | 0,00 | 136 | -7,53 | ||||
| 2026-02-13 | 13F | Van Eck Associates Corp | 7.295.273 | 71 | ||||||
| 2026-01-28 | 13F | Ai Financial Services Llc | 10.000 | 98 | ||||||
| 2026-02-17 | 13F | Ghisallo Capital Management LLC | 0 | -100,00 | 0 | -100,00 | ||||
| 2026-02-17 | 13F | Altshuler Shaham Ltd | 23.900 | -2,05 | 233 | 23,94 | ||||
| 2026-02-13 | 13F | Towarzystwo Funduszy Inwestycyjnych Pzu Sa | 4.800 | 47 | ||||||
| 2026-02-17 | 13F | Algert Global Llc | 536.151 | 5 | ||||||
| 2026-02-17 | 13F | Engineers Gate Manager LP | 0 | -100,00 | 0 | -100,00 | ||||
| 2026-02-17 | 13F | Blair William & Co/il | 13.202 | 129 | ||||||
| 2026-02-09 | 13F | Global Assets Advisory, LLC | 12.234 | 119 | ||||||
| 2026-02-13 | 13F | Wells Fargo & Company/mn | 36.052 | 10,25 | 352 | 39,29 | ||||
| 2026-02-17 | 13F | Janus Henderson Group Plc | 157.400 | 1.542 | ||||||
| 2026-02-17 | 13F | Prelude Capital Management, Llc | 83.551 | 815 | ||||||
| 2026-02-05 | 13F | Baader Bank INC | 0 | -100,00 | 0 | -100,00 | ||||
| 2025-11-12 | 13F | HAP Trading, LLC | Call | 254.500 | 1.211 | |||||
| 2025-11-12 | 13F | HAP Trading, LLC | Put | 204.600 | 16 | |||||
| 2026-02-17 | 13F | Cetera Investment Advisers | 185.542 | 1.811 | ||||||
| 2026-02-17 | 13F | Cantor Fitzgerald, L. P. | 365.750 | 3.570 | ||||||
| 2026-02-13 | 13F | Walleye Capital LLC | Put | 602.700 | 58,98 | 5.882 | 101,03 | |||
| 2026-02-13 | 13F | Walleye Capital LLC | 536.673 | 415,05 | 5.238 | 551,37 | ||||
| 2026-02-13 | 13F | Sassicaia Capital Advisers Llc | 44.100 | 430 | ||||||
| 2026-01-23 | 13F | Assetmark, Inc | 108 | 1 | ||||||
| 2026-02-13 | 13F | Walleye Capital LLC | Call | 250.200 | 35,10 | 2.442 | 70,82 | |||
| 2026-02-17 | 13F | State Of Wisconsin Investment Board | 219.582 | 2.143 | ||||||
| 2026-02-04 | 13F | Ground Swell Capital, LLC | 40.623 | 396 | ||||||
| 2026-03-12 | 13F/A | Peak6 Llc | Put | 230.000 | 0,00 | 2.245 | 26,42 | |||
| 2026-03-12 | 13F/A | Peak6 Llc | Call | 1.279.300 | 254,97 | 12.486 | 348,78 | |||
| 2026-02-06 | 13F | CloudAlpha Capital Management Limited/Hong Kong | 690.000 | 6.734 | ||||||
| 2026-03-12 | 13F/A | Peak6 Llc | 108.916 | -52,18 | 1.063 | -39,53 | ||||
| 2026-01-26 | 13F | Whittier Trust Co | 673 | 0,00 | 9 | 33,33 | ||||
| 2026-01-12 | 13F | Roble, Belko & Company, Inc | 14 | 0,00 | 0 | |||||
| 2026-01-26 | 13F | KBC Group NV | 10.874 | 0 | ||||||
| 2026-02-17 | 13F | Crawford Fund Management, LLC | Put | 131.000 | 1.279 | |||||
| 2026-01-21 | 13F | Flagship Harbor Advisors, Llc | 2.458 | 24 | ||||||
| 2026-01-23 | 13F | Optima Capital Llc | 7 | 0 | ||||||
| 2026-02-03 | 13F | Sequoia Financial Advisors, LLC | 15.000 | -85,00 | 146 | -81,09 | ||||
| 2026-02-17 | 13F | Nomura Holdings Inc | 0 | -100,00 | 0 | -100,00 | ||||
| 2026-02-04 | 13F | Fourth Dimension Wealth, LLC | 100 | 1 | ||||||
| 2026-02-17 | 13F | Jain Global LLC | 135.049 | 1.318 | ||||||
| 2026-02-13 | 13F | Vontobel Holding Ltd. | 38.015 | 371 | ||||||
| 2026-02-12 | 13F | Moneta Group Investment Advisors Llc | 10.035 | 98 | ||||||
| 2026-04-10 | 13F | Melfa Wealth Management, Llc | 0 | -100,00 | 0 | -100,00 | ||||
| 2026-02-17 | 13F | Millennium Management Llc | 4.210.570 | 161,23 | 41.095 | 230,27 | ||||
| 2025-11-13 | 13F | AWM Investment Company, Inc. | 0 | -100,00 | 0 | -100,00 | ||||
| 2025-11-14 | 13F | Point72 Europe (London) LLP | 23.465 | 181 | ||||||
| 2026-02-13 | 13F | Arkadios Wealth Advisors | 37.091 | -44,01 | 362 | -29,16 | ||||
| 2026-02-17 | 13F | Point72 Asset Management, L.P. | Call | 287.700 | -36,07 | 2.808 | -19,20 | |||
| 2026-02-17 | 13F | Gotham Asset Management, LLC | 51.599 | 85,37 | 504 | 135,05 | ||||
| 2026-02-12 | 13F | Commonwealth Equity Services, Llc | 33.390 | 104,47 | 326 | |||||
| 2026-04-02 | 13F | Aspect Partners, LLC | 0 | -100,00 | 0 | -100,00 | ||||
| 2026-02-17 | 13F | SummitTX Capital, L.P. | 96.197 | 939 | ||||||
| 2026-02-11 | 13F | Nemes Rush Group LLC | 1.500 | 0,00 | 15 | 27,27 | ||||
| 2026-02-17 | 13F | Quadrature Capital Ltd | 434.014 | -59,24 | 4.236 | -48,40 | ||||
| 2026-02-09 | 13F | Harbour Investments, Inc. | 200 | 2 | ||||||
| 2025-10-21 | 13F | Tradewinds Capital Management, LLC | 0 | -100,00 | 0 | |||||
| 2026-02-13 | 13F | Mariner, LLC | 12.879 | 126 | ||||||
| 2026-02-13 | 13F | Stifel Financial Corp | 178.612 | 13,26 | 1.743 | 43,22 | ||||
| 2026-02-06 | 13F | Diamond Hill Capital Management Inc | 131.061 | -48,10 | 1.279 | -34,38 | ||||
| 2026-02-12 | 13F | Steward Partners Investment Advisory, Llc | 4.398 | 1.005,03 | 43 | 1.300,00 | ||||
| 2026-02-04 | 13F | Swiss Life Asset Management Ltd | 16.186 | 158 | ||||||
| 2026-02-17 | 13F | California State Teachers Retirement System | 311.552 | 3.041 | ||||||
| 2026-01-28 | 13F | Klp Kapitalforvaltning As | 74.400 | 726 | ||||||
| 2026-03-20 | 13F | Purpose Unlimited Inc. | 15.232 | 149 | ||||||
| 2026-01-29 | 13F | Pictet Asset Management Holding SA | 48.108 | 470 | ||||||
| 2026-02-17 | 13F | Mercer Global Advisors Inc /adv | 1.512.580 | 14.763 | ||||||
| 2026-02-02 | 13F | Mutual Advisors, LLC | 0 | -100,00 | 0 | -100,00 | ||||
| 2026-02-18 | 13F | Vident Advisory, LLC | 299.313 | 2.921 | ||||||
| 2025-11-06 | 13F | Bryce Point Capital, LLC | 15.959 | 123 | ||||||
| 2026-04-08 | 13F | Parisi Gray Wealth Management | 69.198 | 7,45 | 626 | -0,48 | ||||
| 2026-02-11 | 13F | Winton Capital Group Ltd | 87.278 | 852 | ||||||
| 2025-11-12 | 13F | RiverGlades Family Offices LLC | 15.400 | 54,00 | 119 | 521,05 | ||||
| 2026-04-07 | 13F | CoreCap Advisors, LLC | 1.500 | -58,87 | 14 | -62,86 | ||||
| 2026-01-29 | 13F | Focused Wealth Management, Inc | 18.700 | 183 | ||||||
| 2026-02-17 | 13F | D. E. Shaw & Co., Inc. | 1.395.134 | 11.658,40 | 13.617 | 14.862,64 | ||||
| 2026-01-26 | 13F | Wealth Effects Llc | 0 | -100,00 | 0 | -100,00 | ||||
| 2026-02-17 | 13F | D. E. Shaw & Co., Inc. | Put | 185.000 | -22,11 | 1.806 | -1,53 | |||
| 2025-11-13 | 13F | Johnson Financial Group, Inc. | 0 | -100,00 | 0 | -100,00 | ||||
| 2026-02-05 | 13F | Bessemer Group Inc | 25.637 | 0 | ||||||
| 2026-02-13 | 13F | Sei Investments Co | 1.626.832 | 13,12 | 15.878 | 43,01 | ||||
| 2026-02-17 | 13F | Nomura Holdings Inc | Put | 12.500 | -95,00 | 122 | -93,68 | |||
| 2025-10-27 | 13F | Exencial Wealth Advisors, Llc | 0 | -100,00 | 0 | -100,00 | ||||
| 2026-01-26 | 13F | Cwm, Llc | 991 | 147,75 | 0 | |||||
| 2026-02-09 | 13F | Jefferies Financial Group Inc. | 16.625 | 162 | ||||||
| 2026-02-13 | 13F | Charles Schwab Investment Management Inc | 2.169.445 | 17,79 | 21.174 | 48,92 | ||||
| 2026-02-17 | 13F | Tudor Investment Corp Et Al | 20.478 | 200 | ||||||
| 2026-04-02 | 13F | Ares Financial Consulting, LLC | 1.671 | 15 | ||||||
| 2026-02-11 | 13F | Havemeyer Place LP | 34.746 | 339 | ||||||
| 2026-02-05 | 13F | Allworth Financial LP | 27.855 | 1.691,32 | 272 | 2.158,33 | ||||
| 2026-02-11 | 13F | Group One Trading, L.p. | 2.243.318 | 17,81 | 21.895 | 48,94 | ||||
| 2026-02-13 | 13F | National Bank Of Canada /fi/ | 0 | -100,00 | 0 | -100,00 | ||||
| 2026-02-11 | 13F | Deutsche Bank Ag\ | 19.334 | 189 | ||||||
| 2026-04-09 | 13F | Brown Wealth Management, Llc | 35.000 | 316 | ||||||
| 2026-01-22 | 13F | Mh & Associates Securities Management Corp /adv | 85.584 | 835 | ||||||
| 2025-11-14 | 13F | Wolverine Trading, Llc | Put | 438.900 | 1.791,81 | 3.454 | 8.123,81 | |||
| 2026-02-12 | 13F | Wealthspire Advisors, LLC | 0 | -100,00 | 0 | -100,00 | ||||
| 2026-02-12 | 13F | Jane Street Group, Llc | Call | 1.438.200 | -54,79 | 14.037 | -42,85 | |||
| 2026-02-17 | 13F | Creative Planning | 21.514 | 61,46 | 210 | 104,90 | ||||
| 2026-01-21 | 13F | Capital Advisors, Ltd. LLC | 1.649 | -64,34 | 0 | |||||
| 2026-02-13 | 13F | Wexford Capital Lp | 0 | -100,00 | 0 | -100,00 | ||||
| 2026-02-12 | 13F | Jane Street Group, Llc | 10.037.182 | 7,31 | 97.963 | 35,67 | ||||
| 2026-02-12 | 13F | Jane Street Group, Llc | Put | 1.730.900 | 45,32 | 16.894 | 83,72 | |||
| 2026-01-28 | 13F | CAPROCK Group, Inc. | 120.000 | 500,00 | 1.171 | 900,85 | ||||
| 2026-02-10 | 13F | Goldman Sachs Group Inc | 1.412.449 | 177,93 | 13.786 | 251,39 | ||||
| 2026-02-12 | 13F | Federation des caisses Desjardins du Quebec | 4.403 | 228,58 | 43 | 330,00 | ||||
| 2026-02-13 | 13F | Baird Financial Group, Inc. | 0 | -100,00 | 0 | -100,00 | ||||
| 2026-01-26 | 13F | Nations Financial Group Inc, /ia/ /adv | 325.129 | 13,87 | 3.173 | 43,97 | ||||
| 2026-02-11 | 13F | LPL Financial LLC | 237.068 | 52,46 | 2.314 | 92,75 | ||||
| 2025-11-14 | 13F | Wolverine Trading, Llc | Call | 1.255.400 | 389,82 | 9.880 | 2.006,40 | |||
| 2026-02-12 | 13F | CIBC Private Wealth Group, LLC | 30.763 | 103,36 | 300 | 158,62 | ||||
| 2026-02-13 | 13F | Morgan Stanley | 2.677.174 | -47,60 | 26.129 | -33,75 | ||||
| 2026-02-13 | 13F | Manufacturers Life Insurance Company, The | 0 | -100,00 | 0 | |||||
| 2026-02-10 | 13F | Daiwa Securities Group Inc. | 9.348 | 0 | ||||||
| 2026-02-13 | 13F | FirstWave Capital Management LLC | 214.099 | 2.090 | ||||||
| 2026-02-17 | 13F | ExodusPoint Capital Management, LP | 0 | -100,00 | 0 | -100,00 | ||||
| 2026-02-17 | 13F | Two Sigma Securities, Llc | 11.304 | 110 | ||||||
| 2026-02-03 | 13F | Legacy Wealth Managment, LLC/ID | 10 | 0 | ||||||
| 2026-02-13 | 13F | Citigroup Inc | 68.430 | 15.559,04 | 668 | 22.133,33 | ||||
| 2025-11-14 | 13F | Shellback Capital, LP | 0 | -100,00 | 0 | -100,00 | ||||
| 2026-02-11 | 13F | Simplex Trading, Llc | 467.611 | 165,03 | 4.564 | 456.200,00 | ||||
| 2026-02-17 | 13F | Davidson Kempner Capital Management Lp | 0 | -100,00 | 0 | -100,00 | ||||
| 2026-01-27 | 13F | Friedenthal Financial | 365 | 4 | ||||||
| 2026-02-10 | 13F | Daiwa Securities Group Inc. | Put | 1.100 | 0 | |||||
| 2026-02-10 | 13F | Moors & Cabot, Inc. | 86.800 | 4,89 | 847 | 32,76 | ||||
| 2026-02-12 | 13F | BlackRock, Inc. | 7.308.936 | 45,16 | 71.335 | 83,52 | ||||
| 2026-02-12 | 13F | Colonial Trust Co / SC | 1.250 | 25,00 | 11 | 57,14 | ||||
| 2026-02-17 | 13F | National Asset Management, Inc. | 9.500 | -18,80 | 93 | 2,22 | ||||
| 2026-02-09 | 13F | Jefferies Financial Group Inc. | Put | 22.200 | 217 | |||||
| 2026-02-13 | 13F | Marshall Wace, Llp | 3.429.603 | 33.473 | ||||||
| 2026-02-17 | 13F | National Asset Management, Inc. | Call | 8.000 | 78 | |||||
| 2026-02-09 | 13F | Jefferies Financial Group Inc. | Call | 50.400 | 492 | |||||
| 2026-02-17 | 13F | Capital Fund Management S.a. | 623.532 | 6.086 | ||||||
| 2026-04-07 | 13F | Signaturefd, Llc | 1.235 | 23,50 | 11 | 22,22 | ||||
| 2026-02-17 | 13F | Citadel Advisors Llc | Put | 2.075.000 | -31,81 | 20.252 | -13,78 | |||
| 2026-01-16 | 13F | Genesee Capital Advisors, LLC | 0 | -100,00 | 0 | -100,00 | ||||
| 2026-02-17 | 13F | Citadel Advisors Llc | Call | 6.343.600 | 29,35 | 61.914 | 63,53 | |||
| 2026-02-12 | 13F | Renaissance Technologies Llc | 4.718.300 | -43,41 | 46.051 | -28,46 | ||||
| 2026-02-10 | 13F | Sittner & Nelson, Llc | 263 | 3 | ||||||
| 2026-02-06 | 13F | EverSource Wealth Advisors, LLC | 57 | 1 | ||||||
| 2026-02-13 | 13F | Verition Fund Management LLC | 281.579 | 102,00 | 2.748 | 155,39 | ||||
| 2026-02-13 | 13F | Fortitude Advisory Group L.L.C. | Call | 20.000 | 112 | |||||
| 2026-02-17 | 13F | Citadel Advisors Llc | 8.658.920 | 40,83 | 84.511 | 78,04 | ||||
| 2026-02-11 | 13F | Los Angeles Capital Management Llc | 1.146 | 7 | ||||||
| 2026-04-07 | 13F | Farther Finance Advisors, LLC | 180.913 | -4,60 | 1.594 | -13,89 | ||||
| 2026-02-13 | 13F | Change Path, LLC | 15.975 | 156 | ||||||
| 2026-02-10 | 13F | Quantbot Technologies LP | 1.360.958 | 13.283 | ||||||
| 2026-02-17 | 13F | Tower Research Capital LLC (TRC) | 135.823 | 1.326 | ||||||
| 2026-02-17 | 13F | Russell Investments Group, Ltd. | 5.841 | 57 | ||||||
| 2025-11-18 | 13F/A | Heights Capital Management, Inc | 0 | -100,00 | 0 | -100,00 | ||||
| 2026-01-27 | 13F | Zurcher Kantonalbank (Zurich Cantonalbank) | 107.800 | 1.052 | ||||||
| 2026-01-23 | 13F | Valley National Advisers Inc | 150 | 0 | ||||||
| 2026-01-28 | 13F | Ttp Investments, Inc. | 25.000 | 0,00 | 244 | 6,09 | ||||
| 2026-02-17 | 13F | Schonfeld Strategic Advisors LLC | 548.919 | 5.357 | ||||||
| 2026-02-10 | 13F | Eurizon Capital SGR S.p.A. | 8.511 | 83 | ||||||
| 2026-04-08 | 13F | Wealthspan Partners, Llc | 39.130 | 1,64 | 354 | -5,87 | ||||
| 2026-02-12 | 13F | Bank Of Montreal /can/ | Put | 600 | 6 | |||||
| 2026-02-12 | 13F | Bank Of Montreal /can/ | 30.535 | -13,39 | 298 | 9,56 | ||||
| 2026-02-11 | 13F | T3 Companies, LLC | 76.200 | 744 | ||||||
| 2026-01-21 | 13F | Stone House Investment Management, LLC | 0 | -100,00 | 0 | -100,00 | ||||
| 2026-02-06 | 13F | Bare Financial Services, Inc | 110 | 1 | ||||||
| 2026-02-12 | 13F | Marex Group plc | 304.617 | 2.973 | ||||||
| 2025-10-31 | 13F | NWF Advisory Services Inc. | 0 | -100,00 | 0 | -100,00 | ||||
| 2026-01-14 | 13F | ORG Partners LLC | 180 | 2 | ||||||
| 2026-03-03 | 13F/A | Caitong International Asset Management Co., Ltd | 3.466.373 | 9.274,91 | 33.832 | 11.770,53 | ||||
| 2025-11-13 | 13F | Dynamic Technology Lab Private Ltd | 0 | -100,00 | 0 | -100,00 | ||||
| 2026-01-22 | 13F | Shikiar Asset Management Inc | 10.250 | -6,82 | 0 | |||||
| 2026-02-10 | 13F | Belvedere Trading LLC | Put | 0 | -100,00 | 0 | ||||
| 2026-02-13 | 13F | Bridgewater Associates, LP | 0 | -100,00 | 0 | -100,00 | ||||
| 2026-02-09 | 13F | GatePass Capital, LLC | 200.000 | 100,00 | 1.952 | 152,85 | ||||
| 2026-02-17 | 13F | Bank Of America Corp /de/ | 90.989 | -87,66 | 888 | -84,40 | ||||
| 2026-01-20 | 13F | Investment Research & Advisory Group, Inc. | 110 | 1 | ||||||
| 2026-02-04 | 13F | Meridian Wealth Management, LLC | 10.658 | 104 | ||||||
| 2026-01-29 | 13F | Huntleigh Advisors, Inc. | 302.464 | -36,24 | 2.952 | -19,39 | ||||
| 2026-02-12 | 13F | Swiss National Bank | 688.500 | 6.720 | ||||||
| 2026-01-26 | 13F | BCS Private Wealth Management, Inc. | 0 | -100,00 | 0 | -100,00 | ||||
| 2026-02-06 | 13F | Covestor Ltd | 56.226 | -36,52 | 1 | |||||
| 2026-02-10 | 13F | Bnp Paribas Arbitrage, Sa | 37.389 | -96,77 | 365 | -95,93 | ||||
| 2026-04-07 | 13F | Estate Planners Group, LLC | 330 | 3 |