Grundlæggende statistik
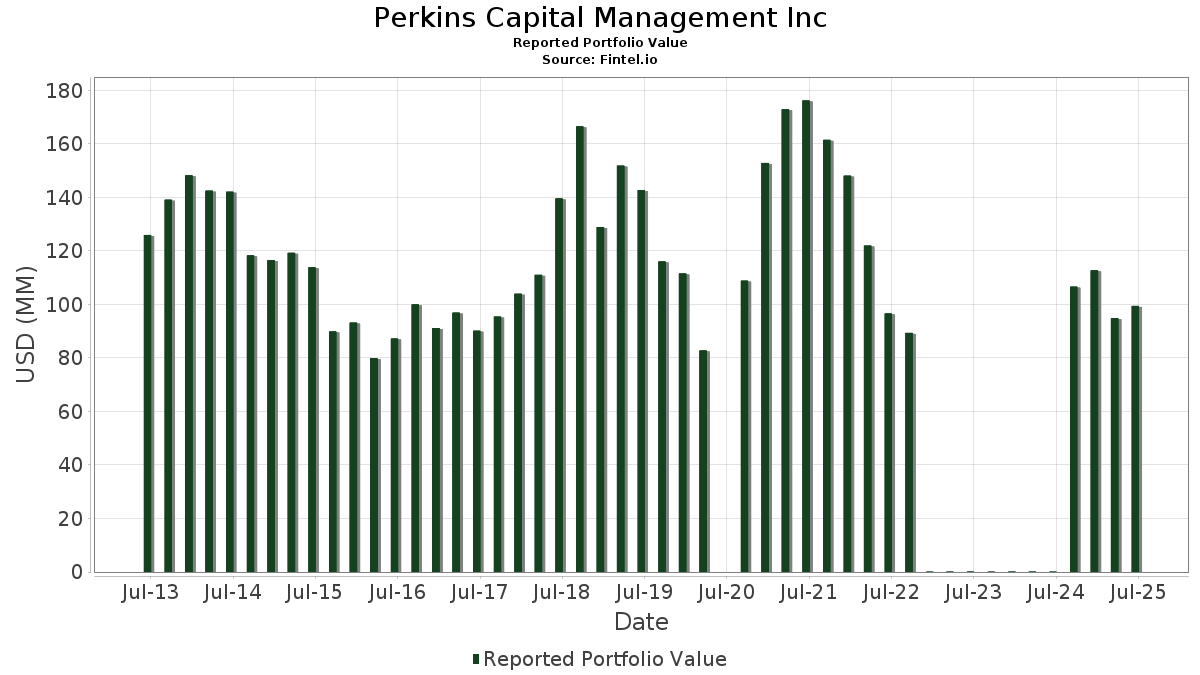
| Porteføljeværdi | $ 125.939.727 |
| Nuværende stillinger | 91 |
Seneste beholdninger, ydeevne, AUM (fra 13F, 13D)
Perkins Capital Management Inc har afsløret 91 samlede besiddelser i deres seneste SEC-arkivering. Den seneste porteføljeværdi er beregnet til at være $ 125.939.727 USD. Faktiske aktiver under forvaltning (AUM) er denne værdi plus kontanter (som ikke er oplyst). Perkins Capital Management Incs største beholdninger er Natera, Inc. (US:NTRA) , Eli Lilly and Company (US:LLY) , Axogen, Inc. (US:AXGN) , IDEXX Laboratories, Inc. (US:IDXX) , and Microsoft Corporation (US:MSFT) . Perkins Capital Management Incs nye stillinger omfatter Owlet, Inc. (US:OWLT) , Neogen Corporation (US:NEOG) , Profound Medical Corp. (US:PROF) , CPS Technologies Corporation (US:CPSH) , and Beeline Holdings, Inc. (US:BLNE) .
Top øger dette kvartal
Vi bruger ændringen i porteføljeallokeringen, fordi dette er den mest meningsfulde metrik. Ændringer kan skyldes handler eller ændringer i aktiekurser.
| Sikkerhed | Aktier (MM) |
Værdi (MM$) |
Portefølje % | ΔPortefølje % |
|---|---|---|---|---|
| AXGN / Axogen, Inc. | 0,23 | 7,47 | 5,9341 | 2,2227 |
| NTRA / Natera, Inc. | 0,04 | 10,21 | 8,1038 | 1,7411 |
| LLY / Eli Lilly and Company | 0,01 | 9,63 | 7,6501 | 1,5375 |
| OWLT / Owlet, Inc. | 0,10 | 1,65 | 1,3126 | 1,3126 |
| BFLY / Butterfly Network, Inc. | 0,92 | 3,51 | 2,7873 | 1,2152 |
| NEOG / Neogen Corporation | 0,18 | 1,25 | 0,9949 | 0,9949 |
| VELO / Velo3D, Inc. | 0,09 | 1,20 | 0,9492 | 0,7598 |
| PROF / Profound Medical Corp. | 0,11 | 0,90 | 0,7141 | 0,7141 |
| VERI / Veritone, Inc. | 0,18 | 0,82 | 0,6484 | 0,6484 |
| ATEC / Alphatec Holdings, Inc. | 0,17 | 3,61 | 2,8693 | 0,6483 |
Top falder i dette kvartal
Vi bruger ændringen i porteføljeallokeringen, fordi dette er den mest meningsfulde metrik. Ændringer kan skyldes handler eller ændringer i aktiekurser.
| Sikkerhed | Aktier (MM) |
Værdi (MM$) |
Portefølje % | ΔPortefølje % |
|---|---|---|---|---|
| MDXH / MDxHealth SA | 1,38 | 4,92 | 3,9089 | -1,8393 |
| BKSY / BlackSky Technology Inc. | 0,03 | 0,54 | 0,4280 | -1,6808 |
| BLZE / Backblaze, Inc. | 0,28 | 1,30 | 1,0315 | -1,2587 |
| MGNI / Magnite, Inc. | 0,12 | 1,98 | 1,5693 | -0,9505 |
| INUV / Inuvo, Inc. | 0,59 | 1,45 | 1,1526 | -0,9231 |
| MSFT / Microsoft Corporation | 0,01 | 5,91 | 4,6907 | -0,8990 |
| SKYT / SkyWater Technology, Inc. | 0,13 | 2,43 | 1,9272 | -0,8694 |
| APPS / Digital Turbine, Inc. | 0,37 | 1,83 | 1,4535 | -0,7243 |
| OPRX / OptimizeRx Corporation | 0,02 | 0,21 | 0,1695 | -0,5098 |
| LMAT / LeMaitre Vascular, Inc. | 0,03 | 2,34 | 1,8610 | -0,4883 |
13F og Fondsarkivering
Denne formular blev indsendt den 2026-02-04 for rapporteringsperioden 2025-12-31. Klik på linkikonet for at se den fulde transaktionshistorik.
Opgrader for at låse op for premium-data og eksportere til Excel ![]() .
.
| Sikkerhed | Type | Gennemsnitlig aktiekurs | Aktier (MM) |
Δ Aktier (%) |
Værdi ($MM) |
ΔVærdi (%) |
Portefølje (%) |
ΔPortefølje (%) |
|
|---|---|---|---|---|---|---|---|---|---|
| NTRA / Natera, Inc. | 0,04 | -0,67 | 10,21 | 41,36 | 8,1038 | 1,7411 | |||
| LLY / Eli Lilly and Company | 0,01 | -1,38 | 9,63 | 38,92 | 7,6501 | 1,5375 | |||
| AXGN / Axogen, Inc. | 0,23 | -3,27 | 7,47 | 77,46 | 5,9341 | 2,2227 | |||
| IDXX / IDEXX Laboratories, Inc. | 0,01 | 0,00 | 6,56 | 5,89 | 5,2107 | -0,2511 | |||
| MSFT / Microsoft Corporation | 0,01 | -0,24 | 5,91 | -6,86 | 4,6907 | -0,8990 | |||
| MDXH / MDxHealth SA | 1,38 | -1,69 | 4,92 | -24,53 | 3,9089 | -1,8393 | |||
| AMD / Advanced Micro Devices, Inc. | 0,02 | -4,08 | 3,78 | 26,97 | 3,0021 | 0,3778 | |||
| ATEC / Alphatec Holdings, Inc. | 0,17 | -0,91 | 3,61 | 43,37 | 2,8693 | 0,6483 | |||
| BFLY / Butterfly Network, Inc. | 0,92 | -0,05 | 3,51 | 96,86 | 2,7873 | 1,2152 | |||
| VCYT / Veracyte, Inc. | 0,08 | -5,33 | 3,18 | 16,09 | 2,5216 | 0,1107 | |||
| ABT / Abbott Laboratories | 0,02 | -0,70 | 2,68 | -7,10 | 2,1299 | -0,4151 | |||
| SKYT / SkyWater Technology, Inc. | 0,13 | -21,41 | 2,43 | -23,51 | 1,9272 | -0,8694 | |||
| LMAT / LeMaitre Vascular, Inc. | 0,03 | -5,12 | 2,34 | -12,08 | 1,8610 | -0,4883 | |||
| OOMA / Ooma, Inc. | 0,18 | -2,78 | 2,14 | -4,90 | 1,6975 | -0,2835 | |||
| ONDS / Ondas Inc. | 0,20 | -1,07 | 1,98 | 25,06 | 1,5696 | 0,1767 | |||
| MGNI / Magnite, Inc. | 0,12 | -7,24 | 1,98 | -30,88 | 1,5693 | -0,9505 | |||
| CYRX / Cryoport, Inc. | 0,20 | -1,58 | 1,96 | -0,36 | 1,5550 | -0,1768 | |||
| PSNL / Personalis, Inc. | 0,24 | -5,35 | 1,90 | 15,55 | 1,5106 | 0,0597 | |||
| APPS / Digital Turbine, Inc. | 0,37 | -5,18 | 1,83 | -25,94 | 1,4535 | -0,7243 | |||
| NEO / NeoGenomics, Inc. | 0,14 | 3,65 | 1,67 | 57,95 | 1,3246 | 0,3935 | |||
| QUIK / QuickLogic Corporation | 0,28 | 34,52 | 1,66 | 33,33 | 1,3157 | 0,2211 | |||
| OWLT / Owlet, Inc. | 0,10 | 1,65 | 1,3126 | 1,3126 | |||||
| TELA / TELA Bio, Inc. | 1,40 | 67,57 | 1,65 | 32,69 | 1,3093 | 0,2142 | |||
| CIEN / Ciena Corporation | 0,01 | -32,98 | 1,47 | 7,60 | 1,1699 | -0,0369 | |||
| INGN / Inogen, Inc. | 0,22 | 7,32 | 1,46 | -11,71 | 1,1614 | -0,2989 | |||
| INUV / Inuvo, Inc. | 0,59 | -12,77 | 1,45 | -38,39 | 1,1526 | -0,9231 | |||
| ABBV / AbbVie Inc. | 0,01 | 0,00 | 1,33 | -1,33 | 1,0599 | -0,1322 | |||
| PERI / Perion Network Ltd. | 0,14 | 12,55 | 1,33 | 12,29 | 1,0526 | 0,0123 | |||
| BLZE / Backblaze, Inc. | 0,28 | -0,45 | 1,30 | -50,00 | 1,0315 | -1,2587 | |||
| AAPL / Apple Inc. | 0,00 | 0,00 | 1,26 | 6,76 | 1,0038 | -0,0397 | |||
| CXDO / Crexendo, Inc. | 0,19 | 15,40 | 1,26 | 14,86 | 1,0010 | 0,0337 | |||
| NEOG / Neogen Corporation | 0,18 | 1,25 | 0,9949 | 0,9949 | |||||
| LUCD / Lucid Diagnostics Inc. | 1,13 | -0,09 | 1,23 | 7,82 | 0,9745 | -0,0286 | |||
| VELO / Velo3D, Inc. | 0,09 | 24,29 | 1,20 | 458,41 | 0,9492 | 0,7598 | |||
| ZETA / Zeta Global Holdings Corp. | 0,06 | -1,74 | 1,15 | 0,61 | 0,9130 | -0,0940 | |||
| NMTC / NeuroOne Medical Technologies Corporation | 1,47 | 0,34 | 1,12 | -14,42 | 0,8866 | -0,2631 | |||
| CSTL / Castle Biosciences, Inc. | 0,03 | -0,36 | 1,09 | 70,31 | 0,8662 | 0,3014 | |||
| ATRC / AtriCure, Inc. | 0,03 | -1,08 | 1,09 | 10,94 | 0,8623 | 0,0002 | |||
| GILD / Gilead Sciences, Inc. | 0,01 | 0,00 | 1,01 | 10,58 | 0,8056 | -0,0030 | |||
| USIO / Usio, Inc. | 0,71 | -17,74 | 0,96 | -21,18 | 0,7623 | -0,3117 | |||
| PFE / Pfizer Inc. | 0,04 | -4,36 | 0,93 | -6,55 | 0,7376 | -0,1383 | |||
| MRK / Merck & Co., Inc. | 0,01 | 0,00 | 0,92 | 25,48 | 0,7313 | 0,0841 | |||
| PROF / Profound Medical Corp. | 0,11 | 0,90 | 0,7141 | 0,7141 | |||||
| CDXS / Codexis, Inc. | 0,53 | 72,08 | 0,86 | 15,07 | 0,6853 | 0,0236 | |||
| VERI / Veritone, Inc. | 0,18 | 0,82 | 0,6484 | 0,6484 | |||||
| DAWN / Day One Biopharmaceuticals, Inc. | 0,08 | 2,13 | 0,78 | 35,06 | 0,6216 | 0,1106 | |||
| VTRS / Viatris Inc. | 0,06 | 0,35 | 0,72 | 26,09 | 0,5723 | 0,0689 | |||
| USB / U.S. Bancorp | 0,01 | -2,71 | 0,67 | 7,38 | 0,5317 | -0,0177 | |||
| ANIP / ANI Pharmaceuticals, Inc. | 0,01 | 0,00 | 0,67 | -13,84 | 0,5291 | -0,1524 | |||
| CELC / Celcuity Inc. | 0,01 | -18,99 | 0,64 | 63,59 | 0,5069 | 0,1629 | |||
| CPSH / CPS Technologies Corporation | 0,20 | 0,62 | 0,4958 | 0,4958 | |||||
| T / AT&T Inc. | 0,02 | -20,64 | 0,56 | -30,25 | 0,4436 | -0,2618 | |||
| ELUT / Elutia Inc. | 0,78 | -31,01 | 0,54 | -46,38 | 0,4293 | -0,4584 | |||
| BKSY / BlackSky Technology Inc. | 0,03 | -75,79 | 0,54 | -77,47 | 0,4280 | -1,6808 | |||
| NXPI / NXP Semiconductors N.V. | 0,00 | 0,00 | 0,50 | -4,59 | 0,3964 | -0,0652 | |||
| COP / ConocoPhillips | 0,01 | 0,00 | 0,49 | -1,01 | 0,3902 | -0,0474 | |||
| GIS / General Mills, Inc. | 0,01 | 18,80 | 0,48 | 9,50 | 0,3849 | -0,0050 | |||
| TGTCL / Target Corporation | 0,00 | 0,00 | 0,48 | 8,88 | 0,3803 | -0,0070 | |||
| LFVN / LifeVantage Corporation | 0,08 | -0,07 | 0,46 | -36,78 | 0,3691 | -0,2784 | |||
| INTC / Intel Corporation | 0,01 | -4,21 | 0,46 | 5,49 | 0,3662 | -0,0196 | |||
| BMY / Bristol-Myers Squibb Company | 0,01 | 0,00 | 0,45 | 19,47 | 0,3611 | 0,0260 | |||
| VZ / Verizon Communications Inc. | 0,01 | -7,20 | 0,45 | -13,90 | 0,3544 | -0,1030 | |||
| PLUS / ePlus inc. | 0,01 | 0,00 | 0,44 | 23,38 | 0,3482 | 0,0353 | |||
| BLNE / Beeline Holdings, Inc. | 0,24 | 0,42 | 0,3346 | 0,3346 | |||||
| DCI / Donaldson Company, Inc. | 0,00 | 0,00 | 0,39 | 8,33 | 0,3098 | -0,0076 | |||
| VCEL / Vericel Corporation | 0,01 | -12,65 | 0,39 | 0,00 | 0,3059 | -0,0338 | |||
| JNJ / Johnson & Johnson | 0,00 | 0,00 | 0,33 | 11,82 | 0,2629 | 0,0015 | |||
| DYAI / Dyadic International, Inc. | 0,34 | -1,05 | 0,32 | -21,22 | 0,2571 | -0,1049 | |||
| BP / BP p.l.c. - Depositary Receipt (Common Stock) | 0,01 | 0,00 | 0,32 | 0,63 | 0,2537 | -0,0257 | |||
| DGII / Digi International Inc. | 0,01 | -29,03 | 0,32 | -15,69 | 0,2521 | -0,0800 | |||
| BDSX / Biodesix, Inc. | 0,04 | -14,91 | 0,30 | -23,43 | 0,2418 | -0,1084 | |||
| BLFS / BioLife Solutions, Inc. | 0,01 | 0,00 | 0,30 | -5,03 | 0,2400 | -0,0410 | |||
| APYX / Apyx Medical Corporation | 0,09 | 4,94 | 0,30 | 71,68 | 0,2362 | 0,0835 | |||
| FAST / Fastenal Company | 0,01 | -3,33 | 0,29 | -20,98 | 0,2310 | -0,0931 | |||
| ELWT / Elauwit Connection, Inc. | 0,06 | 0,28 | 0,2234 | 0,2234 | |||||
| ASUR / Asure Software, Inc. | 0,02 | -6,00 | 0,22 | 7,80 | 0,1758 | -0,0049 | |||
| COST / Costco Wholesale Corporation | 0,00 | 0,00 | 0,22 | -6,93 | 0,1712 | -0,0328 | |||
| OPRX / OptimizeRx Corporation | 0,02 | -53,70 | 0,21 | -72,34 | 0,1695 | -0,5098 | |||
| TCMD / Tactile Systems Technology, Inc. | 0,01 | -49,77 | 0,20 | 5,15 | 0,1627 | -0,0089 | |||
| XOM / Exxon Mobil Corporation | 0,00 | 0,20 | 0,1619 | 0,1619 | |||||
| HAIN / The Hain Celestial Group, Inc. | 0,17 | -60,86 | 0,19 | -73,62 | 0,1484 | -0,4730 | |||
| CVRX / CVRx, Inc. | 0,02 | -18,23 | 0,11 | -28,30 | 0,0910 | -0,0494 | |||
| XGN / Exagen Inc. | 0,02 | -7,47 | 0,11 | -49,09 | 0,0897 | -0,1048 | |||
| LUNG / Pulmonx Corporation | 0,05 | 133,33 | 0,11 | 217,65 | 0,0860 | 0,0560 | |||
| AIRG / Airgain, Inc. | 0,02 | -39,73 | 0,09 | -43,67 | 0,0709 | -0,0687 | |||
| PBYI / Puma Biotechnology, Inc. | 0,01 | 2,46 | 0,07 | 15,63 | 0,0591 | 0,0020 | |||
| ARAY / Accuray Incorporated | 0,09 | 22,18 | 0,07 | -39,83 | 0,0566 | -0,0476 | |||
| RMTI / Rockwell Medical, Inc. | 0,07 | -5,63 | 0,06 | -34,88 | 0,0449 | -0,0311 | |||
| SOPH / SOPHiA GENETICS SA | 0,01 | 0,05 | 0,0389 | 0,0389 | |||||
| IRIX / IRIDEX Corporation | 0,04 | 0,00 | 0,05 | 0,00 | 0,0374 | -0,0041 | |||
| FPAY / FlexShopper, Inc. | 0,08 | -14,96 | 0,00 | -100,00 | 0,0000 | -0,0511 | |||
| DGX / Quest Diagnostics Incorporated | 0,00 | -100,00 | 0,00 | 0,0000 |