Grundlæggende statistik
| Institutionelle ejere | 229 total, 229 long only, 0 short only, 0 long/short - change of -1,29% MRQ |
| Gennemsnitlig porteføljeallokering | 0.4346 % - change of 13,21% MRQ |
| Institutionelle aktier (lange) | 34.209.692 (ex 13D/G) - change of 1,04MM shares 3,13% MRQ |
| Institutionel værdi (lang) | $ 1.099.937 USD ($1000) |
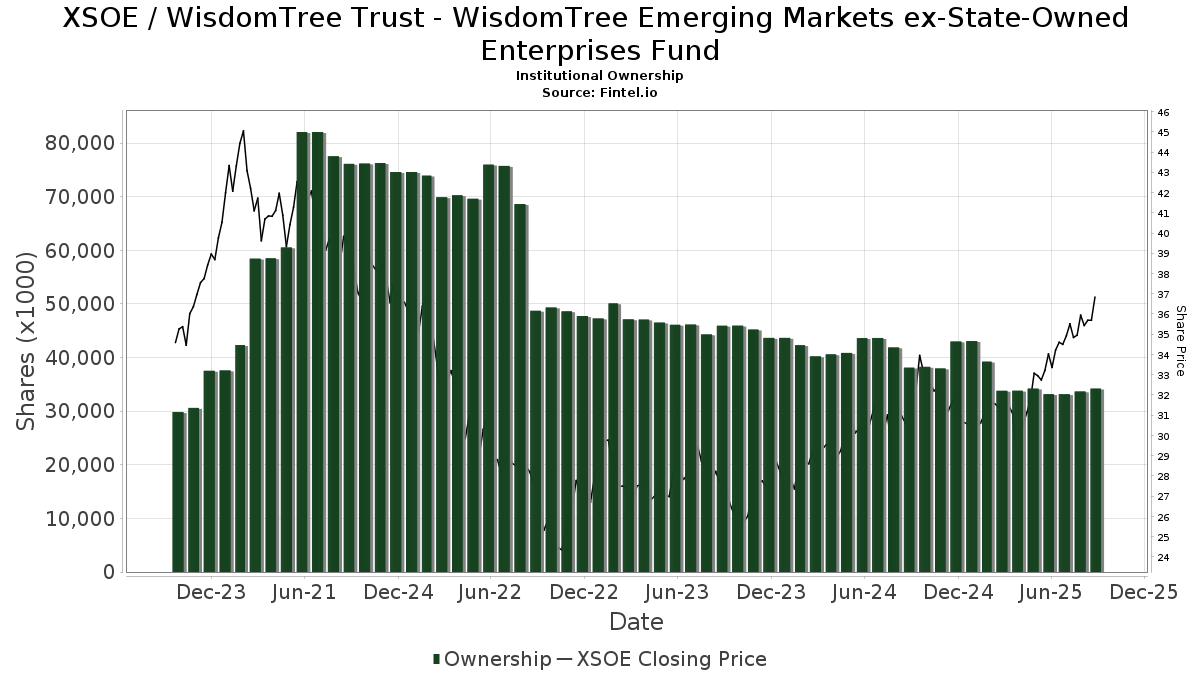
Institutionelt ejerskab og aktionærer
WisdomTree Trust - WisdomTree Emerging Markets ex-State-Owned Enterprises Fund (US:XSOE) har 229 institutionelle ejere og aktionærer, der har indsendt 13D/G- eller 13F-formularer til Securities Exchange Commission (SEC). Disse institutioner har i alt 34,209,692 aktier. Største aktionærer omfatter Resources Investment Advisors, LLC., Morgan Stanley, Bank Of America Corp /de/, Valmark Advisers, Inc., LPL Financial LLC, State Of Wisconsin Investment Board, Clal Insurance Enterprises Holdings Ltd, Wells Fargo & Company/mn, Meitav Dash Investments Ltd, and UBS Group AG .
WisdomTree Trust - WisdomTree Emerging Markets ex-State-Owned Enterprises Fund (ARCA:XSOE) institutionel ejerskabsstruktur viser aktuelle positioner i virksomheden efter institutioner og fonde, samt seneste ændringer i positionsstørrelse. Større aktionærer kan omfatte individuelle investorer, investeringsforeninger, hedgefonde eller institutioner. Skema 13D angiver, at investoren besidder (eller besidder) mere end 5 % af virksomheden og har til hensigt (eller har til hensigt at) aktivt at forfølge en ændring i forretningsstrategi. Skema 13G indikerer en passiv investering på over 5%.
The share price as of September 10, 2025 is 36,83 / share. Previously, on September 11, 2024, the share price was 30,61 / share. This represents an increase of 20,32% over that period.
Fondens stemningsscore
Fund Sentiment Score (fka Ownership Accumulation Score) finder de aktier, der bliver mest købt af fonde. Det er resultatet af en sofistikeret, multi-faktor kvantitativ model, der identificerer virksomheder med de højeste niveauer af institutionel akkumulering. Scoringsmodellen bruger en kombination af den samlede stigning i oplyste ejere, ændringerne i porteføljeallokeringer i disse ejere og andre målinger. Tallet går fra 0 til 100, hvor højere tal indikerer et højere niveau af akkumulering for sine jævnaldrende, og 50 er gennemsnittet.
Opdateringsfrekvens: Dagligt
Se Ownership Explorer, som giver en liste over højest rangerende virksomheder.
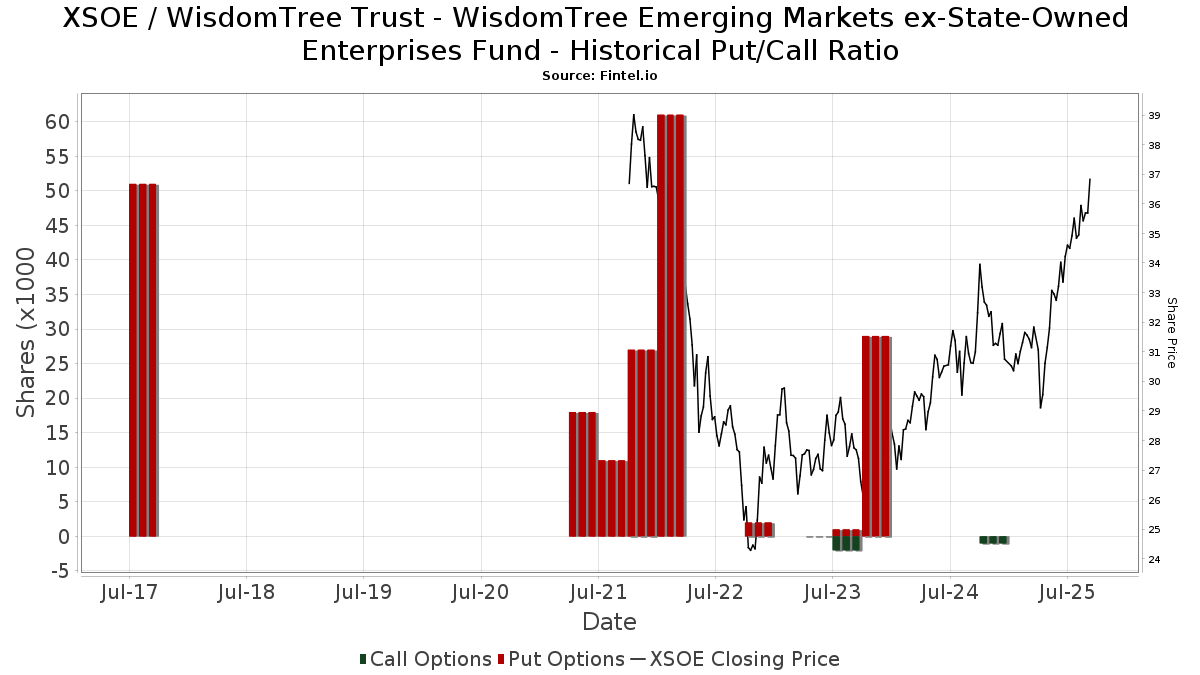
Institutionel Put/Call-forhold
Ud over at indberette standardaktie- og gældsudstedelser skal institutter med mere end 100 mill. aktiver under forvaltning også oplyse deres put- og call-optionsbeholdninger. Da salgsoptioner generelt indikerer negativ stemning, og købsoptioner indikerer positiv stemning, kan vi få en fornemmelse af den overordnede institutionelle stemning ved at plotte forholdet mellem put og kald. Diagrammet til højre viser det historiske put/call-forhold for dette instrument.
Brug af Put/Call Ratio som en indikator for investorernes stemning overvinder en af de vigtigste mangler ved at bruge totalt institutionelt ejerskab, som er, at en betydelig mængde af aktiver under forvaltning investeres passivt for at spore indekser. Passivt forvaltede fonde køber typisk ikke optioner, så indikatoren for put/call-forholdet følger mere nøje følelsen af aktivt forvaltede fonde.
13F og NPORT arkivering
Detaljer om 13F-arkivering er gratis. Detaljer om NP-ansøgninger kræver et premium-medlemskab. Grønne rækker angiver nye positioner. Røde rækker angiver lukkede positioner. Klik på linket ikon for at se den fulde transaktionshistorik.
Opgrader
for at låse premium-data op og eksportere til Excel ![]() .
.
| Fil dato | Kilde | Investor | Type | Gennemsnitlig pris (Øst) |
Aktier | Δ Aktier (%) |
Rapporteret Værdi ($1000) |
Δ Værdi (%) |
Port Alloc (%) |
|
|---|---|---|---|---|---|---|---|---|---|---|
| 2025-07-10 | 13F | SK Wealth Management, LLC | 91.809 | 0,06 | 3.167 | 15,80 | ||||
| 2025-07-17 | 13F | XML Financial, LLC | 47.729 | -0,89 | 1.646 | 10,70 | ||||
| 2025-08-19 | 13F | National Asset Management, Inc. | 99.757 | 45,71 | 3.440 | 64,62 | ||||
| 2025-08-13 | 13F | Jones Financial Companies Lllp | 0 | -100,00 | 0 | |||||
| 2025-07-15 | 13F | Armis Advisers, LLC | 39.435 | -21,52 | 1.360 | -12,38 | ||||
| 2025-05-15 | 13F | Tower Research Capital LLC (TRC) | 0 | -100,00 | 0 | |||||
| 2025-08-05 | 13F | Sigma Planning Corp | 7.183 | -4,97 | 248 | 6,01 | ||||
| 2025-07-23 | 13F | REAP Financial Group, LLC | 11.221 | -5,97 | 387 | 4,89 | ||||
| 2025-07-24 | 13F | Robertson Stephens Wealth Management, LLC | 33.366 | -9,17 | 1.150 | 1,50 | ||||
| 2025-07-11 | 13F | Skyline Advisors, Inc. | 33.333 | 6,07 | 1.149 | 18,45 | ||||
| 2025-04-23 | 13F | B.O.S.S. Retirement Advisors, LLC | 0 | -100,00 | 0 | -100,00 | ||||
| 2025-08-14 | 13F | Smartleaf Asset Management LLC | 77.764 | 2,22 | 2.674 | 13,50 | ||||
| 2025-07-09 | 13F | Pallas Capital Advisors LLC | 486.194 | 52,44 | 16.764 | 70,27 | ||||
| 2025-08-04 | 13F | Premier Path Wealth Partners, LLC | 86.827 | -0,33 | 2.994 | 11,31 | ||||
| 2025-08-15 | 13F | Equitable Holdings, Inc. | 49.464 | 0,62 | 1.706 | 12,39 | ||||
| 2025-08-14 | 13F | Sentinel Wealth Management, Inc. | 100.449 | 3 | ||||||
| 2025-07-30 | 13F | Evermay Wealth Management Llc | 420.326 | 17,64 | 14.493 | 31,40 | ||||
| 2025-08-14 | 13F | Old Mission Capital Llc | 87.733 | -47,40 | 3.025 | -41,24 | ||||
| 2025-07-22 | 13F | Merit Financial Group, LLC | 8.534 | -17,88 | 294 | -8,12 | ||||
| 2025-07-21 | 13F | Patriot Financial Group Insurance Agency, LLC | 14.632 | -8,38 | 505 | 2,23 | ||||
| 2025-07-31 | 13F | Mason & Associates Inc | 7.942 | 0,00 | 274 | 11,43 | ||||
| 2025-07-23 | 13F | Opulen Financial Group LLC | 16.019 | -1,76 | 552 | 9,74 | ||||
| 2025-08-14 | 13F | Transamerica Financial Advisors, Inc. | 392.484 | -1,04 | 13.533 | 112.666,67 | ||||
| 2025-08-13 | 13F | Transce3nd, LLC | 2.551 | 0,43 | 88 | 11,54 | ||||
| 2025-07-23 | 13F | Detalus Advisors, LLC | 6.740 | 232 | ||||||
| 2025-08-08 | 13F | Croban | 30.077 | 5,02 | 1.037 | 17,33 | ||||
| 2025-07-21 | 13F | Ameritas Advisory Services, LLC | 1.083 | 37 | ||||||
| 2025-07-07 | 13F | Investors Research Corp | 260 | 0,00 | 9 | 0,00 | ||||
| 2025-08-14 | 13F | Colony Group, LLC | 187.937 | -5,15 | 6.480 | 5,95 | ||||
| 2025-08-14 | 13F | Atomi Financial Group, Inc. | 9.282 | -31,57 | 320 | -23,44 | ||||
| 2025-08-14 | 13F | Stifel Financial Corp | 270.843 | -8,53 | 9.339 | 2,17 | ||||
| 2025-07-24 | 13F | Jfs Wealth Advisors, Llc | 125 | -29,78 | 4 | -20,00 | ||||
| 2025-08-13 | 13F | Avestar Capital, LLC | 15.677 | -26,08 | 541 | -17,43 | ||||
| 2025-08-05 | 13F | Strategic Financial Concepts, LLC | 26.103 | -0,60 | 900 | 11,11 | ||||
| 2025-08-26 | NP | Northern Lights Variable Trust - TOPS Managed Risk Growth ETF Portfolio Class 1 shares | 82.736 | -9,96 | 2.853 | 0,56 | ||||
| 2025-07-08 | 13F | Arlington Trust Co LLC | 2.500 | 0,00 | 86 | 11,69 | ||||
| 2025-08-04 | 13F | REDW Wealth LLC | 19.162 | 0,00 | 661 | 11,68 | ||||
| 2025-08-14 | 13F | Clarity Asset Management, Inc. | 0 | -100,00 | 0 | |||||
| 2025-08-15 | 13F | Cornerstone Financial Group, LLC /NE/ | 13.376 | 0,28 | 461 | 5,49 | ||||
| 2025-08-19 | 13F | Newbridge Financial Services Group, Inc. | 0 | -100,00 | 0 | |||||
| 2025-08-14 | 13F | Glen Eagle Advisors, LLC | 46.265 | 14,94 | 1.595 | 28,42 | ||||
| 2025-07-25 | 13F | We Are One Seven, LLC | 200.056 | 1,37 | 6.898 | 13,21 | ||||
| 2025-08-13 | 13F | ESL Trust Services, LLC | 980.944 | 0,36 | 33.823 | 12,09 | ||||
| 2025-08-11 | 13F | Principal Securities, Inc. | 396 | 204,62 | 14 | 333,33 | ||||
| 2025-07-15 | 13F | World Equity Group, Inc. | 6.840 | 236 | ||||||
| 2025-07-23 | 13F | Defined Financial Planning LLC | 143.252 | 6,15 | 4.975 | 19,13 | ||||
| 2025-08-01 | 13F | American Financial & Tax Strategies Inc | 274.710 | -2,90 | 9.472 | 8,46 | ||||
| 2025-07-21 | 13F | Exchange Capital Management, Inc. | 45.901 | 4,30 | 1.583 | 16,49 | ||||
| 2025-08-15 | 13F | CI Private Wealth, LLC | 14.854 | 59,94 | 512 | 79,02 | ||||
| 2025-07-24 | 13F | Mengis Capital Management, Inc. | 16.397 | 1,80 | 565 | 13,68 | ||||
| 2025-04-15 | 13F | Noble Wealth Management PBC | 218 | 0,00 | 7 | 0,00 | ||||
| 2025-07-09 | 13F | Procyon Private Wealth Partners, LLC | 6.419 | -2,99 | 221 | 8,33 | ||||
| 2025-08-13 | 13F | Keystone Financial Group | 12.757 | -13,59 | 440 | -3,94 | ||||
| 2025-08-26 | NP | Northern Lights Variable Trust - TOPS Growth ETF Portfolio Class 2 shares | 149.225 | 2,22 | 5.145 | 14,18 | ||||
| 2025-07-24 | 13F | Us Bancorp \de\ | 3.346 | 1,27 | 115 | 13,86 | ||||
| 2025-07-25 | 13F | Northwest Capital Management Inc | 65 | 0,00 | 2 | 0,00 | ||||
| 2025-08-11 | 13F | Private Advisor Group, LLC | 102.180 | -2,90 | 3.523 | 8,47 | ||||
| 2025-08-14 | 13F | Gen-Wealth Partners Inc | 4.290 | 0,00 | 148 | 11,36 | ||||
| 2025-07-28 | 13F | Kiker Wealth Management, LLC | 0 | -100,00 | 0 | |||||
| 2025-07-09 | 13F | Fermata Advisors, LLC | 17.015 | -10,41 | 587 | 0,00 | ||||
| 2025-08-12 | 13F | Jpmorgan Chase & Co | 138.890 | 1,30 | 4.789 | 13,14 | ||||
| 2025-08-08 | 13F | Arcadia Investment Management Corp/mi | 267 | 0,00 | 9 | 12,50 | ||||
| 2025-07-15 | 13F | Financial Management Professionals, Inc. | 0 | 0 | ||||||
| 2025-07-23 | 13F | Meitav Dash Investments Ltd | 1.181.001 | 0,00 | 40.721 | 11,69 | ||||
| 2025-08-26 | NP | Northern Lights Variable Trust - TOPS Managed Risk Balanced ETF Portfolio Class 2 shares | 14.975 | -11,01 | 516 | -0,58 | ||||
| 2025-07-17 | 13F | Fifth Third Securities, Inc. | 0 | -100,00 | 0 | |||||
| 2025-08-14 | 13F | Integrated Wealth Concepts LLC | 30.673 | -2,31 | 1.058 | 9,08 | ||||
| 2025-07-16 | 13F | MBE Wealth Management, LLC | 13.624 | -8,51 | 470 | 2,18 | ||||
| 2025-07-16 | 13F | Fischer Financial Services, Inc. | 21.200 | 24,84 | 731 | 39,31 | ||||
| 2025-08-13 | 13F | Cresset Asset Management, LLC | 6.866 | 0,00 | 237 | 11,85 | ||||
| 2025-08-14 | 13F | CoreCap Advisors, LLC | 11.373 | -0,38 | 392 | 11,36 | ||||
| 2025-07-24 | 13F | Wealth Management Resources, Inc. | 312.094 | 3,68 | 10.761 | 15,81 | ||||
| 2025-08-11 | 13F | Invenio Wealth Partners Llc | 211.715 | -7,05 | 7.300 | 3,81 | ||||
| 2025-08-14 | 13F | Fmr Llc | 4.257 | -9,73 | 147 | 0,69 | ||||
| 2025-07-30 | 13F | D.a. Davidson & Co. | 120.509 | 2,31 | 4.155 | 14,31 | ||||
| 2025-07-02 | 13F | Howard Financial Services, Ltd. | 304.366 | -4,43 | 10.495 | 6,74 | ||||
| 2025-04-22 | 13F | Woodmont Investment Counsel Llc | 0 | -100,00 | 0 | |||||
| 2025-07-31 | 13F | Cambridge Investment Research Advisors, Inc. | 40.609 | -10,79 | 1 | 0,00 | ||||
| 2025-07-30 | NP | ENDW - Cambria Endowment Style ETF | 1.429 | 46 | ||||||
| 2025-04-11 | 13F | Melone Private Wealth, LLC | 0 | -100,00 | 0 | |||||
| 2025-07-16 | 13F | Evergreen Private Wealth LLC | 179.509 | 2,90 | 6.189 | 14,93 | ||||
| 2025-08-14 | 13F | Herold Advisors, Inc. | 10.593 | -32,93 | 365 | -25,05 | ||||
| 2025-08-14 | 13F | Bank Of America Corp /de/ | 2.097.871 | 1,29 | 72.335 | 13,14 | ||||
| 2025-08-13 | 13F | Per Stirling Capital Management, LLC. | 37.528 | -0,80 | 1.294 | 10,80 | ||||
| 2025-05-15 | 13F | Rise Advisors, LLC | 0 | -100,00 | 0 | |||||
| 2025-07-15 | 13F | FLP Wealth Management, LLC | 0 | -100,00 | 0 | |||||
| 2025-08-12 | 13F | Harbor Advisory Corp /ma/ | 10.745 | 0,00 | 370 | 11,78 | ||||
| 2025-08-06 | 13F | Modera Wealth Management, LLC | 9.390 | 0,00 | 324 | 11,76 | ||||
| 2025-08-04 | 13F | Creekmur Asset Management LLC | 428 | 15 | ||||||
| 2025-07-31 | 13F | Wealthfront Advisers Llc | 8.851 | 11,53 | 305 | 25,00 | ||||
| 2025-08-07 | 13F | WESCAP Management Group, Inc. | 186.738 | 3,33 | 6.439 | 15,42 | ||||
| 2025-08-14 | 13F | Bnp Paribas Arbitrage, Sa | 17 | 466,67 | 1 | |||||
| 2025-08-07 | 13F | Resources Investment Advisors, LLC. | 3.354.992 | 39,53 | 115.680 | 55,85 | ||||
| 2025-08-07 | 13F | Howard Bailey Securities, Llc | 180.798 | -1,62 | 6.234 | 9,87 | ||||
| 2025-07-24 | 13F | Forefront Analytics, LLC | 30.077 | 1.037 | ||||||
| 2025-08-14 | 13F | Full Sail Capital, LLC | 6.540 | 0,00 | 225 | 11,94 | ||||
| 2025-08-14 | 13F | Qube Research & Technologies Ltd | 10.680 | 62,98 | 368 | 82,18 | ||||
| 2025-09-04 | 13F/A | Advisor Group Holdings, Inc. | 823.435 | 140,19 | 28.402 | 168,14 | ||||
| 2025-08-14 | 13F | Comerica Bank | 14.831 | 0,05 | 511 | 11,82 | ||||
| 2025-04-17 | 13F | Stewardship Advisors, LLC | 0 | -100,00 | 0 | |||||
| 2025-07-02 | 13F | Michael S. Ryan, Inc. | 466.508 | 50,79 | 16.085 | 68,43 | ||||
| 2025-08-08 | 13F | Pnc Financial Services Group, Inc. | 1.341 | 0,00 | 46 | 12,20 | ||||
| 2025-05-01 | 13F | Quest 10 Wealth Builders, Inc. | 474 | -3,66 | 15 | 0,00 | ||||
| 2025-08-11 | 13F | Beaumont Capital Management, LLC | 119.729 | 17,06 | 4.128 | 30,76 | ||||
| 2025-08-12 | 13F | Clal Insurance Enterprises Holdings Ltd | 1.360.000 | 0,00 | 47 | 12,20 | ||||
| 2025-08-12 | 13F | Charles Schwab Investment Management Inc | 798.883 | -2,06 | 27.545 | 9,39 | ||||
| 2025-07-22 | 13F | Yoder Wealth Management, Inc. | 57.736 | -2,46 | 1.986 | 8,77 | ||||
| 2025-05-16 | 13F | Coppell Advisory Solutions LLC | 0 | -100,00 | 0 | |||||
| 2025-08-26 | NP | Northern Lights Variable Trust - TOPS Aggressive Growth ETF Portfolio Class 2 shares | 133.599 | 0,80 | 4.606 | 12,59 | ||||
| 2025-07-30 | 13F/A | KPP Advisory Services LLC | 5.844 | 201 | ||||||
| 2025-08-05 | 13F | Huntington National Bank | 37 | -36,21 | ||||||
| 2025-08-04 | 13F | Spire Wealth Management | 0 | -100,00 | 0 | |||||
| 2025-07-29 | 13F | Stratos Wealth Partners, LTD. | 167.071 | 7,57 | 5.761 | 20,15 | ||||
| 2025-07-28 | 13F | RFG Advisory, LLC | 13.742 | 1,49 | 474 | 13,43 | ||||
| 2025-07-14 | 13F | UMA Financial Services, Inc. | 7.215 | 1,19 | 249 | 12,73 | ||||
| 2025-08-14 | 13F/A | Rockefeller Capital Management L.P. | 28.996 | -19,48 | 1.000 | -10,08 | ||||
| 2025-07-07 | 13F | OMNI 360 Wealth, Inc. | 12.813 | 0,50 | 442 | 12,21 | ||||
| 2025-08-07 | 13F | Addison Advisors LLC | 150 | 0,00 | 5 | 25,00 | ||||
| 2025-08-12 | 13F | LPL Financial LLC | 1.526.904 | 3,53 | 52.648 | 15,64 | ||||
| 2025-08-26 | 13F/A | Thrivent Financial For Lutherans | 0 | -100,00 | 0 | |||||
| 2025-08-11 | 13F | SFI Advisors, LLC | 25.183 | 0,74 | 868 | 12,58 | ||||
| 2025-05-13 | 13F | Prudential Financial Inc | 0 | -100,00 | 0 | |||||
| 2025-07-28 | 13F | Harbour Investments, Inc. | 13.977 | -4,08 | 482 | 7,13 | ||||
| 2025-08-12 | 13F | Financial Advocates Investment Management | 0 | -100,00 | 0 | -100,00 | ||||
| 2025-08-05 | 13F | Castlekeep Investment Advisors Llc | 64.947 | 479,47 | 2.239 | 548,99 | ||||
| 2025-08-12 | 13F | Proequities, Inc. | 0 | 0 | ||||||
| 2025-08-12 | 13F | Journey Strategic Wealth Llc | 59.990 | 39,76 | 2.068 | 56,08 | ||||
| 2025-07-17 | 13F | Elwood & Goetz Wealth Advisory Group, LLC | 570.881 | 0,42 | 19.684 | 12,15 | ||||
| 2025-08-07 | 13F | Blackhawk Capital Partners LLC. | 16.349 | 2,50 | 564 | 14,43 | ||||
| 2025-08-11 | 13F | Western Wealth Management, LLC | 8.075 | -1,45 | 278 | 10,32 | ||||
| 2025-08-15 | 13F | Morgan Stanley | 2.791.292 | -7,32 | 96.244 | 3,52 | ||||
| 2025-08-05 | 13F | Key FInancial Inc | 5.189 | 5,06 | 179 | 17,11 | ||||
| 2025-08-05 | 13F | Beckerman Institutional, LLC | 29.478 | -0,22 | 1 | |||||
| 2025-08-11 | 13F | Summit Wealth Partners, LLC | 38.699 | -62,71 | 1.334 | -58,35 | ||||
| 2025-08-12 | 13F | SRS Capital Advisors, Inc. | 194.450 | 36,32 | 6.705 | 52,26 | ||||
| 2025-08-13 | 13F | EverSource Wealth Advisors, LLC | 37.311 | -9,07 | 1.286 | 1,58 | ||||
| 2025-07-25 | 13F | Concord Wealth Partners | 253 | 0,00 | 9 | 14,29 | ||||
| 2025-08-08 | 13F | Security Financial Services, INC. | 15.354 | -1,10 | 529 | 10,44 | ||||
| 2025-08-12 | 13F | Steward Partners Investment Advisory, Llc | 10.465 | 0,00 | 361 | 11,46 | ||||
| 2025-08-14 | 13F | State Of Wisconsin Investment Board | 1.408.892 | 0,00 | 48.579 | 11,69 | ||||
| 2025-08-14 | 13F | Mml Investors Services, Llc | 20.057 | -4,34 | 1 | |||||
| 2025-07-25 | 13F | Envestnet Portfolio Solutions, Inc. | 0 | -100,00 | 0 | |||||
| 2025-08-07 | 13F | Allworth Financial LP | 3.046 | 6.521,74 | 105 | 10.400,00 | ||||
| 2025-07-25 | 13F | Lodestar Private Asset Management Llc | 297.337 | 4,70 | 10.252 | 16,95 | ||||
| 2025-08-04 | 13F | Atria Investments Llc | 182.980 | 8,26 | 6.309 | 20,93 | ||||
| 2025-07-23 | 13F | Prime Capital Investment Advisors, LLC | 8.757 | -50,49 | 302 | -44,87 | ||||
| 2025-07-17 | 13F | Refined Wealth Management | 6.031 | 208 | ||||||
| 2025-08-06 | 13F | Golden State Wealth Management, LLC | 142 | 5 | ||||||
| 2025-08-05 | 13F | Gould Asset Management Llc /ca/ | 221.876 | -5,47 | 7.650 | 5,59 | ||||
| 2025-07-16 | 13F | Beaumont Financial Advisors, LLC | 33.556 | -3,62 | 1.157 | 7,73 | ||||
| 2025-08-14 | 13F | Royal Bank Of Canada | 28.561 | -66,73 | 984 | -62,88 | ||||
| 2025-08-12 | 13F | CIBC Private Wealth Group, LLC | 67 | -97,05 | 2 | -96,72 | ||||
| 2025-07-11 | 13F | Caldwell Securities, Inc | 99 | 0,00 | 3 | 0,00 | ||||
| 2025-08-26 | NP | Northern Lights Variable Trust - TOPS Managed Risk Flex ETF Portfolio | 33.009 | -11,61 | 1.138 | -1,22 | ||||
| 2025-08-26 | NP | Northern Lights Variable Trust - TOPS Managed Risk Moderate Growth ETF Portfolio Class 1 shares | 26.121 | -11,26 | 901 | -0,88 | ||||
| 2025-07-10 | 13F | Wealth Enhancement Advisory Services, Llc | 6.428 | -24,42 | 224 | -14,50 | ||||
| 2025-08-11 | 13F | Covestor Ltd | 281 | 11,95 | 0 | |||||
| 2025-07-10 | 13F | NorthCrest Asset Manangement, LLC | 84.220 | 0,90 | 2.939 | 14,09 | ||||
| 2025-08-12 | 13F | O'shaughnessy Asset Management, Llc | 949 | -34,60 | 33 | -27,27 | ||||
| 2025-08-14 | 13F | Raymond James Financial Inc | 117.363 | -0,65 | 4.047 | 10,97 | ||||
| 2025-08-18 | 13F | N.E.W. Advisory Services LLC | 23.335 | -0,66 | 805 | 10,90 | ||||
| 2025-08-11 | 13F | Synergy Investment Management, LLC | 0 | -100,00 | 0 | |||||
| 2025-07-11 | 13F | Farther Finance Advisors, LLC | 3.876 | -5,26 | 134 | 5,56 | ||||
| 2025-08-04 | 13F | Creative Financial Designs Inc /adv | 169 | 0,00 | 6 | 0,00 | ||||
| 2025-08-08 | 13F | Financial Gravity Companies, Inc. | 4 | 0,00 | 0 | |||||
| 2025-08-01 | 13F | FSA Advisors, Inc. | 5.892 | -59,45 | 203 | -54,69 | ||||
| 2025-08-18 | 13F | Geneos Wealth Management Inc. | 17.895 | 12,70 | 617 | 25,92 | ||||
| 2025-04-18 | 13F | Pacific Capital Wealth Advisors, Inc | 0 | -100,00 | 0 | -100,00 | ||||
| 2025-08-14 | 13F | Mariner, LLC | 5.865 | 202 | ||||||
| 2025-08-12 | 13F | Clearwater Capital Advisors, LLC | 12.758 | -96,26 | 440 | -95,83 | ||||
| 2025-08-14 | 13F | GWM Advisors LLC | 20 | 0,00 | 1 | |||||
| 2025-07-16 | 13F | Highline Wealth Partners Llc | 589 | -49,27 | 20 | -42,86 | ||||
| 2025-08-04 | 13F | Assetmark, Inc | 1.850 | 45,90 | 64 | 61,54 | ||||
| 2025-07-08 | 13F | Nbc Securities, Inc. | 28.172 | 1,77 | 1 | |||||
| 2025-05-09 | 13F | Chicago Partners Investment Group LLC | 0 | -100,00 | 0 | |||||
| 2025-07-15 | 13F | Oxinas Partners Wealth Management LLC | 35.372 | -0,55 | 1.220 | 11,12 | ||||
| 2025-07-30 | 13F | Insight Advisors, LLC/ PA | 100.150 | 3,63 | 3.453 | 15,76 | ||||
| 2025-08-12 | 13F | TCTC Holdings, LLC | 591 | 20 | ||||||
| 2025-07-17 | 13F | Janney Montgomery Scott LLC | 6.386 | 0 | ||||||
| 2025-08-08 | 13F | Larson Financial Group LLC | 1.219 | 0,41 | 42 | 13,51 | ||||
| 2025-04-17 | 13F | Montecito Bank & Trust | 44.086 | -0,72 | 1.361 | 0,52 | ||||
| 2025-08-06 | 13F | Commonwealth Equity Services, Llc | 178.346 | 0,57 | 6 | 20,00 | ||||
| 2025-07-28 | 13F | WealthPlan Investment Management, LLC | 74.634 | 604,89 | 2.573 | 689,26 | ||||
| 2025-07-15 | 13F | Legacy Financial Group LLC | 17.375 | -7,31 | 599 | 3,63 | ||||
| 2025-08-26 | NP | Northern Lights Variable Trust - TOPS Balanced ETF Portfolio Class 1 shares | 38.857 | -4,90 | 1.340 | 6,19 | ||||
| 2025-04-28 | 13F | Pinnacle Financial Partners Inc | 133.991 | 1,11 | 4.136 | 2,40 | ||||
| 2025-07-25 | 13F | NorthRock Partners, LLC | 0 | -100,00 | 0 | |||||
| 2025-08-11 | 13F | WPG Advisers, LLC | 122 | 0,00 | 4 | 33,33 | ||||
| 2025-08-14 | 13F | Betterment LLC | 187.980 | -2,54 | 6 | 20,00 | ||||
| 2025-08-01 | 13F | Koss-Olinger Consulting, LLC | 47.864 | -3,08 | 1.650 | 8,27 | ||||
| 2025-07-25 | 13F | Atria Wealth Solutions, Inc. | 6.345 | -68,55 | 219 | -64,95 | ||||
| 2025-08-15 | 13F | Kestra Advisory Services, LLC | 39.713 | 9,30 | 1.369 | 22,12 | ||||
| 2025-08-05 | 13F | Integrity Financial Corp /WA | 6.346 | -0,77 | 219 | 10,66 | ||||
| 2025-08-14 | 13F | Susquehanna International Group, Llp | 27.697 | -72,89 | 955 | -69,74 | ||||
| 2025-08-14 | 13F | UBS Group AG | 1.137.325 | -21,46 | 39.215 | -12,27 | ||||
| 2025-05-15 | 13F | Citadel Advisors Llc | Call | 0 | -100,00 | 0 | ||||
| 2025-08-04 | 13F | Mayflower Financial Advisors, LLC | 18.497 | -11,35 | 638 | -1,09 | ||||
| 2025-08-26 | NP | Northern Lights Variable Trust - TOPS Moderate Growth ETF Portfolio Class 1 shares | 59.359 | -2,55 | 2.047 | 8,83 | ||||
| 2025-08-06 | 13F | AE Wealth Management LLC | 7.505 | 15,93 | 259 | 29,65 | ||||
| 2025-08-08 | 13F | Hartland & Co., LLC | 127 | 0,00 | 4 | 33,33 | ||||
| 2025-08-12 | 13F | Personal Cfo Solutions, Llc | 8.138 | -4,45 | 281 | 6,87 | ||||
| 2025-05-14 | 13F | Renaissance Technologies Llc | 0 | -100,00 | 0 | |||||
| 2025-05-15 | 13F | Citadel Advisors Llc | 0 | -100,00 | 0 | |||||
| 2025-08-15 | 13F | Captrust Financial Advisors | 47.933 | -10,74 | 1.653 | -0,30 | ||||
| 2025-07-23 | 13F | Heck Capital Advisors, LLC | 0 | -100,00 | 0 | |||||
| 2025-07-18 | 13F | Warren Street Wealth Advisors, LLC | 582.183 | 6,96 | 20.074 | 19,47 | ||||
| 2025-08-13 | 13F | Twin Peaks Wealth Advisors, LLC | 11.529 | -5,63 | 410 | 12,05 | ||||
| 2025-08-14 | 13F | IHT Wealth Management, LLC | 24.347 | -3,69 | 839 | 7,29 | ||||
| 2025-07-25 | 13F | Concurrent Investment Advisors, LLC | 61.603 | 14,21 | 2.124 | 27,57 | ||||
| 2025-07-17 | 13F | Beacon Capital Management, LLC | 14 | 0,00 | 0 | |||||
| 2025-08-11 | 13F | Aptus Capital Advisors, LLC | 1.405 | 0,00 | 48 | 11,63 | ||||
| 2025-08-14 | 13F | Jane Street Group, Llc | 21.749 | 750 | ||||||
| 2025-07-18 | 13F | Client 1st Advisory Group, Llc | 37.068 | -1,60 | 1.278 | 9,98 | ||||
| 2025-08-08 | 13F | Avantax Advisory Services, Inc. | 73.084 | 0,57 | 2.520 | 12,30 | ||||
| 2025-08-13 | 13F | Grove Street Fiduciary, LLC | 27.215 | 0,00 | 938 | 11,67 | ||||
| 2025-08-13 | 13F | Townsquare Capital Llc | 0 | -100,00 | 0 | |||||
| 2025-07-16 | 13F | Perigon Wealth Management, LLC | 26.969 | 7,07 | 930 | 19,56 | ||||
| 2025-07-31 | 13F | Kathleen S. Wright Associates Inc. | 700 | 0,00 | 24 | 14,29 | ||||
| 2025-08-12 | 13F | Global Retirement Partners, LLC | 24 | 1 | ||||||
| 2025-04-21 | 13F | ORG Partners LLC | 0 | -100,00 | 0 | |||||
| 2025-07-24 | 13F | IFP Advisors, Inc | 123.880 | -9,21 | 4.271 | 1,40 | ||||
| 2025-05-14 | 13F | Flow Traders U.s. Llc | 0 | -100,00 | 0 | |||||
| 2025-07-23 | 13F | Valmark Advisers, Inc. | 1.636.879 | -2,08 | 56.440 | 9,37 | ||||
| 2025-08-14 | 13F | Ameriprise Financial Inc | 229.700 | 4,77 | 7.918 | 16,99 | ||||
| 2025-07-14 | 13F | Golden State Equity Partners | 9.773 | -0,23 | 337 | 11,26 | ||||
| 2025-08-08 | 13F | Condor Capital Management | 35.668 | 1,62 | 1.230 | 13,48 | ||||
| 2025-05-13 | 13F | Franklin Resources Inc | 0 | -100,00 | 0 | -100,00 | ||||
| 2025-08-11 | 13F | Addison Capital Co | 56.683 | 11,97 | 1.954 | 25,10 | ||||
| 2025-08-11 | 13F | HighTower Advisors, LLC | 21.141 | -9,02 | 729 | 1,53 | ||||
| 2025-08-08 | 13F | Emerald Investment Partners, Llc | 15.264 | -8,52 | 526 | 2,14 | ||||
| 2025-07-10 | 13F | Tompkins Financial Corp | 684 | -88,38 | 24 | -87,29 | ||||
| 2025-08-05 | 13F | Bank Of Montreal /can/ | 0 | -100,00 | 0 | |||||
| 2025-08-01 | 13F | Envestnet Asset Management Inc | 127.291 | -11,02 | 4.389 | -0,61 | ||||
| 2025-08-08 | 13F | Capital Investment Advisory Services, LLC | 4.430 | 43,69 | 153 | 60,00 | ||||
| 2025-07-24 | 13F | Leo Wealth, LLC | 60.997 | 631,82 | 2.103 | 717,90 | ||||
| 2025-04-30 | 13F | Sofos Investments, Inc. | 4 | -99,60 | 0 | -100,00 | ||||
| 2025-07-09 | 13F | First Financial Corp /in/ | 26.270 | 8,45 | 906 | 21,15 | ||||
| 2025-07-25 | 13F | Ellis Investment Partners, LLC | 20.924 | -2,82 | 721 | 8,58 | ||||
| 2025-08-14 | 13F | Hrt Financial Lp | 0 | -100,00 | 0 | |||||
| 2025-08-12 | 13F | MAI Capital Management | 30.933 | -2,67 | 1.067 | 8,66 | ||||
| 2025-07-30 | 13F | Drive Wealth Management, Llc | 47.901 | 2,48 | 1.652 | 14,41 | ||||
| 2025-08-04 | 13F | Savvy Advisors, Inc. | 7.112 | -3,11 | 245 | 8,41 | ||||
| 2025-08-11 | 13F | United Advisor Group, LLC | 7.346 | -11,22 | 253 | -0,78 | ||||
| 2025-08-13 | 13F | Northwestern Mutual Wealth Management Co | 8.920 | 27,89 | 308 | 42,79 | ||||
| 2025-08-14 | 13F | Main Street Financial Solutions, LLC | 19.835 | 684 | ||||||
| 2025-08-08 | 13F | Cetera Investment Advisers | 286.169 | 12,85 | 9.867 | 26,05 | ||||
| 2025-08-26 | NP | Northern Lights Variable Trust - TOPS Conservative ETF Portfolio Class 1 shares | 12.319 | -5,98 | 425 | 4,95 | ||||
| 2025-08-08 | 13F | SBI Securities Co., Ltd. | 4.679 | 0,78 | 161 | 12,59 | ||||
| 2025-07-08 | 13F | Webster Bank, N. A. | 13.740 | 0,00 | 474 | 11,56 | ||||
| 2025-05-12 | 13F | Independent Advisor Alliance | 0 | -100,00 | 0 | |||||
| 2025-07-28 | 13F | BRYN MAWR TRUST Co | 488 | 0,83 | 17 | 14,29 | ||||
| 2025-08-13 | 13F | Luminist Capital LLC | 3 | 0,00 | 0 | |||||
| 2025-08-05 | 13F | Plante Moran Financial Advisors, LLC | 0 | -100,00 | 0 | |||||
| 2025-08-14 | 13F | Wells Fargo & Company/mn | 1.229.915 | 72,58 | 42.407 | 92,77 | ||||
| 2025-07-29 | 13F | Private Trust Co Na | 4.551 | 1,56 | 157 | 13,04 | ||||
| 2025-08-06 | 13F | ETF Store, Inc. | 20.711 | 1,94 | 714 | 13,88 | ||||
| 2025-07-25 | 13F | Cwm, Llc | 292.746 | -3,47 | 10 | 11,11 | ||||
| 2025-07-14 | 13F | U.S. Capital Wealth Advisors, LLC | 13.630 | 0,00 | 470 | 11,67 | ||||
| 2025-07-28 | 13F | Revolve Wealth Partners, LLC | 8.331 | -11,74 | 287 | -1,37 | ||||
| 2025-07-29 | 13F | Goldstein Advisors, LLC | 223.511 | -0,70 | 7.707 | 10,91 | ||||
| 2025-07-30 | 13F | Sloy Dahl & Holst, LLC | 237.664 | 5,98 | 8.195 | 18,38 | ||||
| 2025-07-31 | 13F | Kranot Hishtalmut Le Morim Ve Gananot Havera Menahelet LTD | 713.416 | 0,00 | 24.613 | 11,82 | ||||
| 2025-07-28 | 13F | Axxcess Wealth Management, Llc | 15.678 | -2,29 | 541 | 9,09 | ||||
| 2025-08-05 | 13F | Bank of New York Mellon Corp | 151.317 | 14,33 | 5.217 | 27,71 | ||||
| 2025-05-13 | 13F | Quadrature Capital Ltd | 0 | -100,00 | 0 | |||||
| 2025-08-11 | 13F | Mivtachim The Workers Social Insurance Fund Ltd. (Under Special Management) | 47.241 | 0,00 | 2 | 0,00 | ||||
| 2025-08-13 | 13F | Sumitomo Mitsui Financial Group, Inc. | 2.351 | 0,00 | 81 | 12,50 |
Other Listings
| MX:XSOE |