Grundlæggende statistik
| Institutionelle ejere | 130 total, 130 long only, 0 short only, 0 long/short - change of -9,09% MRQ |
| Gennemsnitlig porteføljeallokering | 1.5984 % - change of -17,59% MRQ |
| Institutionelle aktier (lange) | 31.408.073 (ex 13D/G) - change of -5,94MM shares -15,90% MRQ |
| Institutionel værdi (lang) | $ 1.301.048 USD ($1000) |
Institutionelt ejerskab og aktionærer
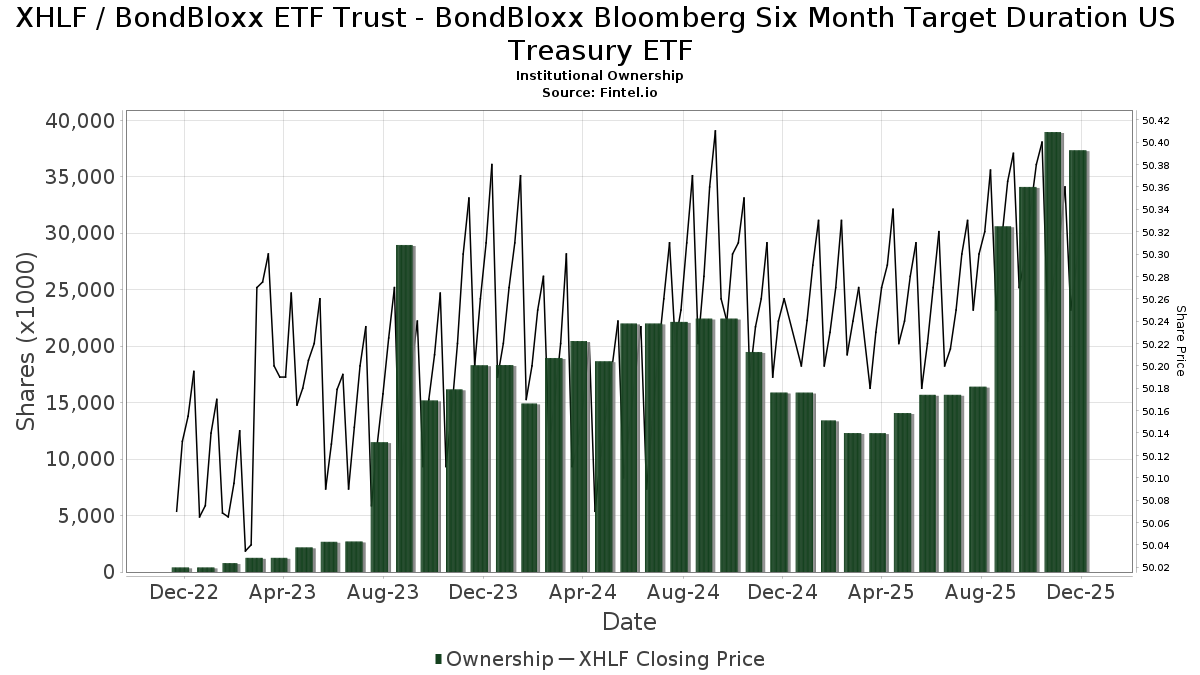
BondBloxx ETF Trust - BondBloxx Bloomberg Six Month Target Duration US Treasury ETF (US:XHLF) har 130 institutionelle ejere og aktionærer, der har indsendt 13D/G- eller 13F-formularer til Securities Exchange Commission (SEC). Disse institutioner har i alt 31,408,073 aktier. Største aktionærer omfatter Potomac Fund Management Inc /adv, Q3 Asset Management, Carrera Capital Advisors, Pineridge Advisors LLC, Total Investment Management Inc, Tanager Wealth Management LLP, a16z Perennial Management, L.P., Bank Of America Corp /de/, 3EDGE Asset Management, LP, and JDM Financial Group LLC .
BondBloxx ETF Trust - BondBloxx Bloomberg Six Month Target Duration US Treasury ETF (ARCA:XHLF) institutionel ejerskabsstruktur viser aktuelle positioner i virksomheden efter institutioner og fonde, samt seneste ændringer i positionsstørrelse. Større aktionærer kan omfatte individuelle investorer, investeringsforeninger, hedgefonde eller institutioner. Skema 13D angiver, at investoren besidder (eller besidder) mere end 5 % af virksomheden og har til hensigt (eller har til hensigt at) aktivt at forfølge en ændring i forretningsstrategi. Skema 13G indikerer en passiv investering på over 5%.
The share price as of April 2, 2026 is 50,21 / share. Previously, on April 4, 2025, the share price was 50,22 / share. This represents a decline of 0,02% over that period.
Fondens stemningsscore
Fund Sentiment Score (fka Ownership Accumulation Score) finder de aktier, der bliver mest købt af fonde. Det er resultatet af en sofistikeret, multi-faktor kvantitativ model, der identificerer virksomheder med de højeste niveauer af institutionel akkumulering. Scoringsmodellen bruger en kombination af den samlede stigning i oplyste ejere, ændringerne i porteføljeallokeringer i disse ejere og andre målinger. Tallet går fra 0 til 100, hvor højere tal indikerer et højere niveau af akkumulering for sine jævnaldrende, og 50 er gennemsnittet.
Opdateringsfrekvens: Dagligt
Se Ownership Explorer, som giver en liste over højest rangerende virksomheder.
AI+ Ask Fintel’s AI assistant about BondBloxx ETF Trust - BondBloxx Bloomberg Six Month Target Duration US Treasury ETF.
Select a question to share a public post with an AI-crafted answer.
Thinking of good questions…
Institutionel Put/Call-forhold
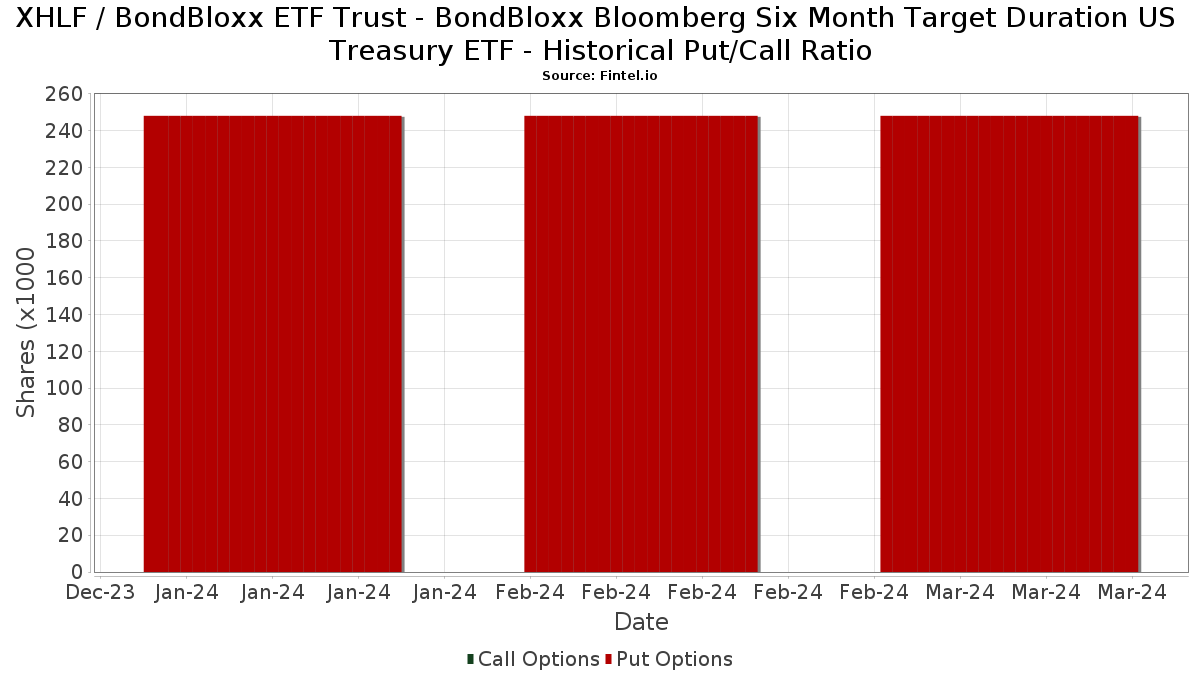
Ud over at indberette standardaktie- og gældsudstedelser skal institutter med mere end 100 mill. aktiver under forvaltning også oplyse deres put- og call-optionsbeholdninger. Da salgsoptioner generelt indikerer negativ stemning, og købsoptioner indikerer positiv stemning, kan vi få en fornemmelse af den overordnede institutionelle stemning ved at plotte forholdet mellem put og kald. Diagrammet til højre viser det historiske put/call-forhold for dette instrument.
Brug af Put/Call Ratio som en indikator for investorernes stemning overvinder en af de vigtigste mangler ved at bruge totalt institutionelt ejerskab, som er, at en betydelig mængde af aktiver under forvaltning investeres passivt for at spore indekser. Passivt forvaltede fonde køber typisk ikke optioner, så indikatoren for put/call-forholdet følger mere nøje følelsen af aktivt forvaltede fonde.
13F og NPORT arkivering
Detaljer om 13F-arkivering er gratis. Detaljer om NP-ansøgninger kræver et premium-medlemskab. Grønne rækker angiver nye positioner. Røde rækker angiver lukkede positioner. Klik på linket ikon for at se den fulde transaktionshistorik.
Opgrader
for at låse premium-data op og eksportere til Excel ![]() .
.
| Fil dato | Kilde | Investor | Type | Gennemsnitlig pris (Øst) |
Aktier | Δ Aktier (%) |
Rapporteret Værdi ($1000) |
Δ Værdi (%) |
Port Alloc (%) |
|
|---|---|---|---|---|---|---|---|---|---|---|
| 2026-02-10 | 13F/A | Northwestern Mutual Wealth Management Co | 921 | 1.779,59 | 46 | 2.200,00 | ||||
| 2026-01-26 | 13F | Financial Guidance Group, Inc. | 9.600 | 0,00 | 482 | -0,41 | ||||
| 2026-01-28 | 13F | Geneos Wealth Management Inc. | 2.447 | -8,08 | 123 | -8,96 | ||||
| 2026-02-05 | 13F | Atria Investments Llc | 18.717 | -66,28 | 941 | -66,40 | ||||
| 2026-01-08 | 13F | Wealth Enhancement Advisory Services, Llc | 36.817 | 65,97 | 1.851 | 66,01 | ||||
| 2026-01-30 | 13F | Laurel Wealth Advisors LLC | 146.400 | 6,30 | 7.357 | 5,93 | ||||
| 2026-02-10 | 13F | BlackDiamond Wealth Management Inc. | 12.170 | 32,14 | 612 | 31,68 | ||||
| 2026-01-13 | 13F | John W. Brooker & Co., CPAs | 5.480 | 275 | ||||||
| 2026-02-02 | 13F | Total Clarity Wealth Management, Inc. | 0 | -100,00 | 0 | -100,00 | ||||
| 2026-02-10 | 13F | Foundations Investment Advisors, LLC | 13.955 | 59,89 | 701 | 59,32 | ||||
| 2026-02-17 | 13F | Running Point Capital Advisors, LLC | 24.772 | -4,19 | 1.245 | -4,53 | ||||
| 2026-01-13 | 13F | Mather Group, Llc. | 0 | -100,00 | 0 | |||||
| 2026-02-05 | 13F | Cambridge Investment Research Advisors, Inc. | 84.900 | -13,23 | 4 | 0,00 | ||||
| 2026-01-27 | 13F | ZEGA Investments, LLC | 16.497 | 829 | ||||||
| 2026-02-10 | 13F | CFS Investment Advisory Services, LLC | 9.789 | 0,27 | 492 | 0,00 | ||||
| 2026-01-26 | 13F | Single Point Partners, LLC | 16.350 | 822 | ||||||
| 2026-02-18 | 13F | Strong Retirement Solutions LLC | 95.630 | 4.805 | ||||||
| 2026-02-10 | 13F | Goldman Sachs Group Inc | 51.528 | -13,83 | 2.589 | -14,10 | ||||
| 2026-02-17 | 13F | Bank Of America Corp /de/ | 864.407 | 19,43 | 43.436 | 19,03 | ||||
| 2026-01-16 | 13F | Ronald Blue Trust, Inc. | 0 | -100,00 | 0 | |||||
| 2026-02-17 | 13F | Advisory Services Network, LLC | 0 | -100,00 | 0 | |||||
| 2026-01-09 | 13F | Dynamic Advisor Solutions LLC | 12.250 | 0,00 | 616 | -0,32 | ||||
| 2026-02-17 | 13F | Harvest Investment Services, LLC | 13.330 | 5,08 | 670 | 4,69 | ||||
| 2026-02-17 | 13F | Fmr Llc | 2 | 0,00 | 0 | |||||
| 2026-02-09 | 13F | Hartland & Co., LLC | 0 | -100,00 | 0 | |||||
| 2026-02-05 | 13F | Blume Capital Management, Inc. | 52.608 | -78,14 | 2.644 | -78,21 | ||||
| 2026-02-17 | 13F | Bank OZK | 5.328 | -13,24 | 268 | -13,59 | ||||
| 2026-01-23 | 13F | ABLE Financial Group, LLC | 6.435 | -9,37 | 323 | -9,52 | ||||
| 2026-01-28 | 13F | Hobbs Group Advisors, LLC | 67.506 | -28,69 | 3.392 | -28,92 | ||||
| 2026-02-12 | 13F | Brinker Capital Investments, LLC | 39.111 | -3,89 | 1.965 | -4,19 | ||||
| 2026-01-29 | 13F | UBS Group AG | 1.399 | 70 | ||||||
| 2026-02-02 | 13F | JDM Financial Group LLC | 552.344 | 4,75 | 27.755 | 4,40 | ||||
| 2025-11-12 | 13F | Palo Alto Wealth Advisors, Llc | 4.485 | 0,00 | 225 | 0,00 | ||||
| 2026-02-13 | 13F | Advyzon Investment Management, LLC | 0 | -100,00 | 0 | |||||
| 2026-01-26 | 13F | AE Wealth Management LLC | 7.992 | -9,60 | 402 | -9,89 | ||||
| 2026-02-02 | 13F | Truist Financial Corp | 4.141 | -68,38 | 208 | -68,48 | ||||
| 2026-02-04 | 13F | Strait & Sound Wealth Management LLC | 135.883 | -7,06 | 6.828 | -7,37 | ||||
| 2026-02-10 | 13F | Pasadena Private Wealth, LLC | 0 | -100,00 | 0 | |||||
| 2026-01-26 | 13F | Cwm, Llc | 31.592 | 7,51 | 2 | 0,00 | ||||
| 2026-02-06 | 13F | Axxcess Wealth Management, Llc | 0 | -100,00 | 0 | |||||
| 2026-02-11 | 13F | Empowered Funds, LLC | 78.250 | 16,20 | 3.932 | 16,23 | ||||
| 2026-02-13 | 13F | Potomac Fund Management Inc /adv | 8.093.603 | -8,97 | 406.704 | -9,27 | ||||
| 2026-01-27 | 13F | Holcombe Financial, Inc. | 11.081 | -20,61 | 557 | -20,91 | ||||
| 2026-01-27 | 13F | Able Wealth Management LLC | 41.414 | -4,20 | 2.081 | -4,50 | ||||
| 2026-02-02 | 13F | Advisors Preferred, LLC | 239.600 | 0,00 | 12.047 | 0,02 | ||||
| 2026-01-27 | 13F | Belpointe Asset Management LLC | 10.166 | 53,19 | 511 | 52,69 | ||||
| 2026-02-04 | 13F | Summit Wealth Group Llc / Co | 0 | -100,00 | 0 | |||||
| 2026-02-17 | 13F | Prosperity Consulting Group, LLC | 0 | -100,00 | 0 | |||||
| 2026-02-02 | 13F | Ellis Investment Partners, LLC | 10.213 | 7,35 | 513 | 7,10 | ||||
| 2025-10-29 | 13F | Inspire Advisors, LLC | 0 | -100,00 | 0 | |||||
| 2026-02-06 | 13F | SoundView Advisors Inc. | 519.214 | 26 | ||||||
| 2026-02-06 | 13F | Kingdom Financial Group LLC. | 94 | 5 | ||||||
| 2026-01-30 | 13F | Sigma Planning Corp | 155.773 | -0,74 | 7.828 | -1,07 | ||||
| 2026-02-13 | 13F | Wells Fargo & Company/mn | 114.679 | -41,45 | 5.763 | -41,64 | ||||
| 2026-02-06 | 13F | IFP Advisors, Inc | 300 | -57,14 | 15 | -57,14 | ||||
| 2026-02-09 | 13F | Cary Street Partners Financial Llc | 53.509 | -15,26 | 2.689 | -15,55 | ||||
| 2026-02-03 | 13F | International Assets Investment Management, Llc | 0 | -100,00 | 0 | -100,00 | ||||
| 2026-02-10 | 13F | Lido Advisors, LLC | 9.676 | -4,80 | 486 | -5,08 | ||||
| 2026-02-13 | 13F | Mml Investors Services, Llc | 156.704 | -22,69 | 7.874 | -22,95 | ||||
| 2026-02-12 | 13F | Beacon Capital Management, Inc. | 60.703 | -64,82 | 3.050 | -64,95 | ||||
| 2025-11-07 | 13F | Maridea Wealth Management LLC | 0 | -100,00 | 0 | |||||
| 2026-02-17 | 13F | Advisor Group Holdings, Inc. | 16.008 | 23,94 | 804 | 23,50 | ||||
| 2026-01-22 | 13F | Networth Advisors, LLC | 9 | 0 | ||||||
| 2026-01-26 | 13F | Tanager Wealth Management LLP | 1.754.195 | -14,81 | 88.182 | -15,06 | ||||
| 2026-02-11 | 13F | Nemes Rush Group LLC | 1.391 | 39,94 | 70 | 38,00 | ||||
| 2026-01-29 | 13F | St Germain D J Co Inc | 685 | 37,55 | 34 | 36,00 | ||||
| 2026-02-17 | 13F | Citadel Advisors Llc | 0 | -100,00 | 0 | |||||
| 2026-01-29 | 13F | Bravias Capital Group, LLC | 4.903 | 246 | ||||||
| 2025-11-14 | 13F | CI Private Wealth, LLC | 0 | -100,00 | 0 | |||||
| 2026-01-15 | 13F | SILVER OAK SECURITIES, Inc | 342.051 | 131,06 | 17.188 | 130,28 | ||||
| 2026-01-22 | 13F | Argus Investors' Counsel, Inc. | 10.696 | -0,79 | 537 | -1,10 | ||||
| 2026-01-21 | 13F | Raleigh Capital Management Inc. | 1.233 | 4,14 | 62 | 3,39 | ||||
| 2026-01-23 | 13F | Farther Finance Advisors, LLC | 2.561 | 0,00 | 129 | -0,78 | ||||
| 2026-02-20 | 13F | Cambient Family Office, Llc | 128.246 | 6.459 | ||||||
| 2026-02-27 | 13F/A | Howard Bailey Securities, Llc | 0 | -100,00 | 0 | -100,00 | ||||
| 2026-02-11 | 13F | Janney Montgomery Scott LLC | 57.524 | 47,93 | 3 | 100,00 | ||||
| 2026-02-17 | 13F | Guardian Wealth Advisors, Llc / Nc | 114.335 | -24,92 | 5.749 | -25,14 | ||||
| 2026-01-21 | 13F | Portside Wealth Group, LLC | 50.724 | -8,01 | 2.549 | -8,35 | ||||
| 2026-01-26 | 13F | Valmark Advisers, Inc. | 10.049 | -25,45 | 505 | -25,77 | ||||
| 2025-11-10 | 13F | Private Advisory Group LLC | 0 | -100,00 | 0 | |||||
| 2025-11-03 | 13F | Archer Investment Corp | 0 | -100,00 | 0 | -100,00 | ||||
| 2025-12-16 | 13F | Garde Capital, Inc. | 0 | -100,00 | 0 | |||||
| 2026-02-05 | 13F | Thrivent Financial For Lutherans | 12.050 | -93,13 | 1 | -100,00 | ||||
| 2026-02-03 | 13F | Diversify Wealth Management, Llc | 135.484 | 8,62 | 6.815 | 8,82 | ||||
| 2026-02-03 | 13F | Total Investment Management Inc | 1.806.717 | -1,14 | 90.788 | -1,47 | ||||
| 2026-02-03 | 13F | Encompass More Asset Management | 72.465 | 1,97 | 3.641 | 1,62 | ||||
| 2025-10-23 | 13F | Etesian Wealth Advisors, Inc. | 0 | -100,00 | 0 | |||||
| 2026-01-27 | 13F | Measured Risk Portfolios, Inc. | 103.216 | 6,92 | 5.187 | 6,55 | ||||
| 2026-01-09 | 13F | Capstone Wealth Management Group LLC | 4.041 | 1,02 | 203 | 1,00 | ||||
| 2026-02-17 | 13F | Raymond James Financial Inc | 6.506 | 2,01 | 327 | 1,56 | ||||
| 2026-02-11 | 13F | LPL Financial LLC | 20.555 | 38,67 | 1.033 | 38,15 | ||||
| 2026-02-10 | 13F | a16z Perennial Management, L.P. | 1.392.000 | 0,00 | 69.948 | -0,34 | ||||
| 2026-02-17 | 13F | Royal Bank Of Canada | 434.720 | 1.592,70 | 21.845 | 1.586,87 | ||||
| 2026-02-09 | 13F | North Forty Two & Co. | 87.395 | 66,09 | 4.392 | 65,51 | ||||
| 2026-02-06 | 13F | Municipal Employees' Retirement System of Michigan | 0 | -100,00 | 0 | |||||
| 2026-01-27 | 13F | Q3 Asset Management | 4.798.145 | 37,53 | 241 | 37,71 | ||||
| 2026-02-17 | 13F | Cetera Investment Advisers | 200.942 | 4,23 | 10.097 | 3,88 | ||||
| 2026-01-13 | 13F | Matrix Trust Co | 35.062 | -18,07 | 2 | -50,00 | ||||
| 2026-02-13 | 13F | Financial Network Wealth Advisors LLC | 8.743 | -8,57 | 439 | -8,92 | ||||
| 2026-02-13 | 13F | Mariner, LLC | 0 | -100,00 | 0 | |||||
| 2026-02-17 | 13F | Susquehanna International Group, Llp | 11.785 | 106,94 | 592 | 106,27 | ||||
| 2026-01-29 | 13F | Quest 10 Wealth Builders, Inc. | 203 | 0,00 | 10 | 0,00 | ||||
| 2026-02-13 | 13F | Sweeney & Michel, Llc | 35.591 | -0,19 | 1.790 | -0,28 | ||||
| 2026-01-12 | 13F | DAVENPORT & Co LLC | 0 | -100,00 | 0 | |||||
| 2026-02-17 | 13F | GeoWealth Management, LLC | 3.684 | -52,87 | 185 | -53,05 | ||||
| 2026-02-06 | 13F | Lloyd Advisory Services, LLC. | 1.104 | 55 | ||||||
| 2026-02-12 | 13F | Bank of Jackson Hole Trust | 0 | -100,00 | 0 | |||||
| 2026-02-17 | 13F | Wiley Bros.-aintree Capital, Llc | 0 | -100,00 | 0 | |||||
| 2026-02-11 | 13F | Stonebrook Private Inc. | 21.430 | 1.077 | ||||||
| 2026-01-20 | 13F | Sugar Maple Asset Management, LLC | 12.502 | 68,29 | 628 | 67,91 | ||||
| 2026-02-04 | 13F | Certior Financial Group, Llc | 7.623 | -11,07 | 383 | -11,34 | ||||
| 2026-01-12 | 13F | Salem Investment Counselors Inc | 15.261 | 769 | ||||||
| 2026-01-23 | 13F | Gibbs Wealth Management | 8.880 | -22,30 | 447 | -22,57 | ||||
| 2026-02-10 | 13F | Rothschild Investment Llc | 1.890 | 0,00 | 95 | -1,05 | ||||
| 2026-01-23 | 13F | Smith, Moore & Co. | 4.000 | 201 | ||||||
| 2026-02-12 | 13F | Adviser Investments LLC | 6.155 | -2,96 | 309 | -3,13 | ||||
| 2026-02-13 | 13F | National Bank Of Canada /fi/ | 0 | -100,00 | 0 | |||||
| 2026-02-11 | 13F | Syon Capital Llc | 56.693 | 2.849 | ||||||
| 2026-02-11 | 13F | Jpmorgan Chase & Co | 242 | 12 | ||||||
| 2025-10-20 | 13F | Northwest Capital Management Inc | 0 | -100,00 | 0 | |||||
| 2026-02-17 | 13F | National Asset Management, Inc. | 0 | -100,00 | 0 | |||||
| 2026-01-23 | 13F | HBW Advisory Services LLC | 0 | -100,00 | 0 | |||||
| 2026-02-12 | 13F | Bank Of Montreal /can/ | 486.556 | 1,82 | 24.449 | 1,48 | ||||
| 2026-02-17 | 13F | Note Advisors, LLC | 18.769 | 19,98 | 945 | 19,80 | ||||
| 2026-02-04 | 13F | Ameritas Advisory Services, LLC | 8.202 | 412 | ||||||
| 2026-02-18 | 13F | Vermillion & White Wealth Management Group, LLC | 6.099 | 372,79 | 308 | 372,31 | ||||
| 2026-02-06 | 13F | Wilian Securities, LLC | 5.315 | 267 | ||||||
| 2026-01-29 | 13F | Middleton & Co Inc/ma | 8.000 | 0,00 | 402 | -0,25 | ||||
| 2026-02-13 | 13F | Morgan Stanley | 265.482 | -25,02 | 13.340 | -25,27 | ||||
| 2026-02-13 | 13F | Stifel Financial Corp | 4.509 | -96,66 | 227 | -96,68 | ||||
| 2026-01-29 | 13F | Warren Street Wealth Advisors, LLC | 128.392 | 11,26 | 6.452 | 10,88 | ||||
| 2025-11-04 | 13F | Pineridge Advisors LLC | 2.132.997 | 11,51 | 107.546 | 11,69 | ||||
| 2026-02-05 | 13F | WealthPlan Investment Management, LLC | 11.990 | -5,76 | 602 | -6,08 | ||||
| 2026-02-17 | 13F | Wealth Watch Advisors, INC | 5.421 | 272 | ||||||
| 2025-11-14 | 13F | Ausdal Financial Partners, Inc. | 0 | -100,00 | 0 | |||||
| 2025-11-05 | 13F | Fullcircle Wealth Llc | 21.340 | -41,57 | 1.072 | -41,60 | ||||
| 2025-11-03 | 13F | Townsquare Capital Llc | 0 | -100,00 | 0 | |||||
| 2025-11-12 | 13F | London & Capital Asset Management Ltd | 0 | -100,00 | 0 | |||||
| 2026-01-29 | 13F | Traub Capital Management LLC | 5.390 | 6,73 | 271 | 6,30 | ||||
| 2026-02-06 | 13F | Global Retirement Partners, LLC | 10.618 | 93,48 | 534 | 93,12 | ||||
| 2026-02-13 | 13F | Kestra Advisory Services, LLC | 1.478 | 74 | ||||||
| 2026-01-27 | 13F | Evergreen Capital Management Llc | 316.767 | 66,02 | 15.968 | 65,98 | ||||
| 2026-02-12 | 13F | Commonwealth Equity Services, Llc | 0 | -100,00 | 0 | |||||
| 2026-02-03 | 13F | Acorn Financial Advisory Services Inc /adv | 23.927 | -12,49 | 1.202 | -12,77 | ||||
| 2025-11-13 | 13F | Legacy Capital Wealth Partners, LLC | 0 | -100,00 | 0 | |||||
| 2026-02-09 | 13F | Harbour Investments, Inc. | 148 | 0,68 | 7 | 0,00 | ||||
| 2026-01-16 | 13F | Oregon Pacific Wealth Management, LLC | 6.355 | -13,41 | 319 | -13,78 | ||||
| 2025-11-13 | 13F | Change Path, LLC | 0 | -100,00 | 0 | |||||
| 2026-02-13 | 13F | Aptus Capital Advisors, LLC | 124.672 | -23,34 | 6.265 | -23,60 | ||||
| 2026-01-20 | 13F | eCIO, Inc. | 82.929 | 127,80 | 4.167 | 127,08 | ||||
| 2026-01-08 | 13F | Oliver Luxxe Assets LLC | 82.242 | -5,72 | 4.133 | -6,05 | ||||
| 2025-11-03 | 13F | Bank of New York Mellon Corp | 0 | -100,00 | 0 | |||||
| 2026-02-11 | 13F | Omnitrust Wealth Management, Inc | 4.124 | 207 | ||||||
| 2026-01-12 | 13F | Bulwark Capital Corp | 97.339 | 6,10 | 4.891 | 5,75 | ||||
| 2026-02-06 | 13F | HighTower Advisors, LLC | 0 | -100,00 | 0 | |||||
| 2026-01-21 | 13F | Sowell Financial Services LLC | 7.701 | -5,16 | 387 | -5,62 | ||||
| 2026-02-06 | 13F | 3EDGE Asset Management, LP | 655.369 | -22,01 | 32.932 | -22,27 | ||||
| 2026-02-13 | 13F | STAR Financial Bank | 97.289 | 552,46 | 4.889 | 550,87 | ||||
| 2026-02-17 | 13F | Stadion Money Management, LLC | 0 | -100,00 | 0 | |||||
| 2025-11-14 | 13F | Quantinno Capital Management LP | 0 | -100,00 | 0 | |||||
| 2026-01-13 | 13F | Signal Advisors Wealth, LLC | 232.542 | 28,20 | 11.685 | 27,77 | ||||
| 2025-11-12 | 13F | Reyes Financial Architecture, Inc. | 0 | -100,00 | 0 | |||||
| 2026-01-28 | 13F | Legacy Capital Group California, Inc. | 21.609 | -5,93 | 1.086 | -6,30 | ||||
| 2026-02-10 | 13F | Envestnet Asset Management Inc | 171.164 | -34,93 | 8.601 | -35,15 | ||||
| 2026-02-20 | 13F | Kovitz Investment Group Partners, LLC | 0 | -100,00 | 0 | |||||
| 2026-02-13 | 13F | Colony Group, LLC | 156.637 | 626,01 | 7.874 | 624,29 | ||||
| 2026-02-02 | 13F | Grantvest Financial Group LLC | 4.170 | 210 | ||||||
| 2026-02-17 | 13F | Signature Equity Partners, LLC | 292 | 15 | ||||||
| 2025-10-14 | 13F | Reuter James Wealth Management, Llc | 0 | -100,00 | 0 | |||||
| 2026-02-12 | 13F | Jane Street Group, Llc | 5.244 | -75,67 | 264 | -75,78 | ||||
| 2026-01-20 | 13F | C2P Capital Advisory Group, LLC d.b.a. Prosperity Capital Advisors | 0 | -100,00 | 0 | |||||
| 2026-02-24 | 13F | Astoria Portfolio Advisors LLC. | 7.752 | 390 | ||||||
| 2026-02-02 | 13F | WT Wealth Management | 0 | -100,00 | 0 | |||||
| 2026-01-30 | 13F | Carrera Capital Advisors | 2.489.784 | 5,78 | 125.507 | 5,75 |