Grundlæggende statistik
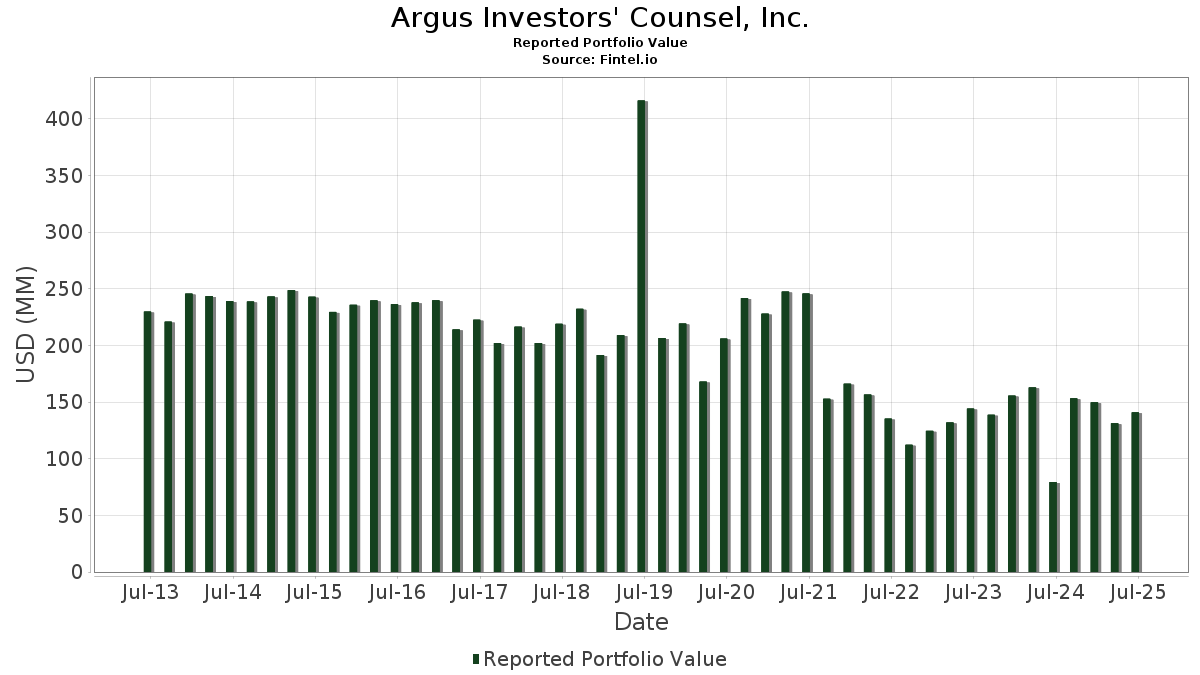
| Porteføljeværdi | $ 140.905.156 |
| Nuværende stillinger | 111 |
Seneste beholdninger, ydeevne, AUM (fra 13F, 13D)
Argus Investors' Counsel, Inc. har afsløret 111 samlede besiddelser i deres seneste SEC-arkivering. Den seneste porteføljeværdi er beregnet til at være $ 140.905.156 USD. Faktiske aktiver under forvaltning (AUM) er denne værdi plus kontanter (som ikke er oplyst). Argus Investors' Counsel, Inc.s største beholdninger er Costco Wholesale Corporation (US:COST) , NVIDIA Corporation (US:NVDA) , Meta Platforms, Inc. (US:META) , JPMorgan Chase & Co. (US:JPM) , and Apple Inc. (US:AAPL) . Argus Investors' Counsel, Inc.s nye stillinger omfatter General Electric Company (US:GE) , Uber Technologies, Inc. (US:UBER) , Constellation Energy Corporation (US:CEG) , Kimco Realty Corporation (US:KIM) , and .
Top øger dette kvartal
Vi bruger ændringen i porteføljeallokeringen, fordi dette er den mest meningsfulde metrik. Ændringer kan skyldes handler eller ændringer i aktiekurser.
| Sikkerhed | Aktier (MM) |
Værdi (MM$) |
Portefølje % | ΔPortefølje % |
|---|---|---|---|---|
| 0,03 | 4,90 | 3,4771 | 0,9183 | |
| 0,00 | 3,65 | 2,5903 | 0,8567 | |
| 0,02 | 3,60 | 2,5554 | 0,8290 | |
| 0,01 | 3,16 | 2,2458 | 0,6502 | |
| 0,01 | 4,78 | 3,3911 | 0,5814 | |
| 0,00 | 0,81 | 0,5750 | 0,5750 | |
| 0,01 | 0,81 | 0,5736 | 0,5736 | |
| 0,01 | 1,89 | 1,3388 | 0,4269 | |
| 0,00 | 1,81 | 1,2830 | 0,3956 | |
| 0,00 | 0,53 | 0,3733 | 0,3733 |
Top falder i dette kvartal
Vi bruger ændringen i porteføljeallokeringen, fordi dette er den mest meningsfulde metrik. Ændringer kan skyldes handler eller ændringer i aktiekurser.
| Sikkerhed | Aktier (MM) |
Værdi (MM$) |
Portefølje % | ΔPortefølje % |
|---|---|---|---|---|
| 0,02 | 4,08 | 2,8978 | -0,8582 | |
| 0,01 | 5,05 | 3,5809 | -0,6303 | |
| 0,00 | 3,73 | 2,6468 | -0,3887 | |
| 0,01 | 2,36 | 1,6771 | -0,3578 | |
| 0,00 | 1,24 | 0,8819 | -0,2576 | |
| 0,01 | 1,22 | 0,8665 | -0,2449 | |
| 0,00 | 2,58 | 1,8342 | -0,2390 | |
| 0,00 | 1,44 | 1,0223 | -0,2227 | |
| 0,00 | 0,94 | 0,6685 | -0,1993 | |
| 0,00 | 1,12 | 0,7927 | -0,1853 |
13F og Fondsarkivering
Denne formular blev indsendt den 2025-07-17 for rapporteringsperioden 2025-06-30. Klik på linkikonet for at se den fulde transaktionshistorik.
Opgrader for at låse op for premium-data og eksportere til Excel ![]() .
.
| Sikkerhed | Type | Gennemsnitlig aktiekurs | Aktier (MM) |
Δ Aktier (%) |
Δ Aktier (%) |
Værdi ($MM) |
Portefølje (%) |
ΔPortefølje (%) |
|
|---|---|---|---|---|---|---|---|---|---|
| COST / Costco Wholesale Corporation | 0,01 | -12,78 | 5,05 | -8,72 | 3,5809 | -0,6303 | |||
| NVDA / NVIDIA Corporation | 0,03 | 0,07 | 4,90 | 45,89 | 3,4771 | 0,9183 | |||
| META / Meta Platforms, Inc. | 0,01 | 1,17 | 4,78 | 29,59 | 3,3911 | 0,5814 | |||
| JPM / JPMorgan Chase & Co. | 0,02 | -13,03 | 4,44 | 2,80 | 3,1540 | -0,1399 | |||
| AAPL / Apple Inc. | 0,02 | -10,34 | 4,08 | -17,18 | 2,8978 | -0,8582 | |||
| TT / Trane Technologies plc | 0,01 | -9,91 | 3,73 | 16,95 | 2,6490 | 0,2176 | |||
| LLY / Eli Lilly and Company | 0,00 | -0,83 | 3,73 | -6,40 | 2,6468 | -0,3887 | |||
| AXON / Axon Enterprise, Inc. | 0,00 | 1,90 | 3,65 | 60,40 | 2,5903 | 0,8567 | |||
| ORCL / Oracle Corporation | 0,02 | 1,61 | 3,60 | 58,87 | 2,5554 | 0,8290 | |||
| AMZN / Amazon.com, Inc. | 0,02 | -5,03 | 3,48 | 9,50 | 2,4701 | 0,0486 | |||
| V / Visa Inc. | 0,01 | 0,02 | 3,44 | 1,33 | 2,4389 | -0,1450 | |||
| GOOGL / Alphabet Inc. | 0,02 | -6,22 | 3,24 | 6,90 | 2,2987 | -0,0102 | |||
| PWR / Quanta Services, Inc. | 0,01 | 1,58 | 3,16 | 51,10 | 2,2458 | 0,6502 | |||
| BLK / BlackRock, Inc. | 0,00 | 0,27 | 3,07 | 11,16 | 2,1774 | 0,0747 | |||
| ADI / Analog Devices, Inc. | 0,01 | 0,75 | 3,03 | 18,95 | 2,1519 | 0,2092 | |||
| BSX / Boston Scientific Corporation | 0,03 | 1,57 | 2,89 | 8,13 | 2,0477 | 0,0150 | |||
| SCHW / The Charles Schwab Corporation | 0,03 | -1,81 | 2,63 | 14,45 | 1,8661 | 0,1158 | |||
| SPGI / S&P Global Inc. | 0,00 | -8,50 | 2,58 | -5,03 | 1,8342 | -0,2390 | |||
| MSFT / Microsoft Corporation | 0,01 | -15,78 | 2,57 | 11,60 | 1,8233 | 0,0693 | |||
| URI / United Rentals, Inc. | 0,00 | 1,82 | 2,53 | 22,41 | 1,7953 | 0,2208 | |||
| WFC / Wells Fargo & Company | 0,03 | 1,79 | 2,52 | 13,58 | 1,7867 | 0,0983 | |||
| TRGP / Targa Resources Corp. | 0,01 | 1,88 | 2,36 | -11,53 | 1,6771 | -0,3578 | |||
| ISRG / Intuitive Surgical, Inc. | 0,00 | -1,28 | 2,22 | 8,33 | 1,5789 | 0,0141 | |||
| AVGO / Broadcom Inc. | 0,01 | -12,20 | 1,93 | 44,59 | 1,3672 | 0,3519 | |||
| RCL / Royal Caribbean Cruises Ltd. | 0,01 | 3,40 | 1,89 | 57,69 | 1,3388 | 0,4269 | |||
| NFLX / Netflix, Inc. | 0,00 | 8,09 | 1,81 | 55,24 | 1,2830 | 0,3956 | |||
| NOW / ServiceNow, Inc. | 0,00 | 1,16 | 1,79 | 30,61 | 1,2725 | 0,2268 | |||
| AXP / American Express Company | 0,01 | -2,37 | 1,75 | 15,79 | 1,2385 | 0,0898 | |||
| ADBE / Adobe Inc. | 0,00 | 1,08 | 1,70 | 1,98 | 1,2073 | -0,0638 | |||
| AMAT / Applied Materials, Inc. | 0,01 | 1,14 | 1,68 | 27,60 | 1,1944 | 0,1895 | |||
| WMT / Walmart Inc. | 0,02 | 39,62 | 1,51 | 55,51 | 1,0720 | 0,3320 | |||
| SYK / Stryker Corporation | 0,00 | -17,06 | 1,44 | -11,87 | 1,0223 | -0,2227 | |||
| PYPL / PayPal Holdings, Inc. | 0,02 | 3,73 | 1,31 | 18,16 | 0,9289 | 0,0849 | |||
| TMO / Thermo Fisher Scientific Inc. | 0,00 | 1,96 | 1,24 | -16,92 | 0,8819 | -0,2576 | |||
| XOM / Exxon Mobil Corporation | 0,01 | -7,67 | 1,22 | -16,32 | 0,8665 | -0,2449 | |||
| HD / The Home Depot, Inc. | 0,00 | -10,93 | 1,21 | -10,90 | 0,8589 | -0,1758 | |||
| IWF / iShares Trust - iShares Russell 1000 Growth ETF | 0,00 | -1,89 | 1,19 | 15,41 | 0,8455 | 0,0587 | |||
| TJX / The TJX Companies, Inc. | 0,01 | 71,18 | 1,19 | 73,65 | 0,8424 | 0,3214 | |||
| CRM / Salesforce, Inc. | 0,00 | -14,36 | 1,12 | -13,02 | 0,7927 | -0,1853 | |||
| MA / Mastercard Incorporated | 0,00 | -19,35 | 0,94 | -17,38 | 0,6685 | -0,1993 | |||
| TXN / Texas Instruments Incorporated | 0,00 | 27,64 | 0,84 | 47,38 | 0,5988 | 0,1629 | |||
| PG / The Procter & Gamble Company | 0,01 | -0,06 | 0,83 | -6,50 | 0,5919 | -0,0882 | |||
| GLW / Corning Incorporated | 0,02 | 0,45 | 0,82 | 15,44 | 0,5787 | 0,0404 | |||
| GE / General Electric Company | 0,00 | 0,81 | 0,5750 | 0,5750 | |||||
| UBER / Uber Technologies, Inc. | 0,01 | 0,81 | 0,5736 | 0,5736 | |||||
| ABT / Abbott Laboratories | 0,01 | -11,39 | 0,79 | -9,11 | 0,5595 | -0,1016 | |||
| AMGN / Amgen Inc. | 0,00 | -0,04 | 0,77 | -10,44 | 0,5485 | -0,1087 | |||
| NUE / Nucor Corporation | 0,01 | 5,22 | 0,77 | 13,27 | 0,5452 | 0,0285 | |||
| VZ / Verizon Communications Inc. | 0,02 | 0,00 | 0,76 | -4,62 | 0,5418 | -0,0679 | |||
| ZTS / Zoetis Inc. | 0,00 | -0,15 | 0,73 | -5,41 | 0,5215 | -0,0704 | |||
| DIS / The Walt Disney Company | 0,01 | 2,62 | 0,73 | 28,80 | 0,5179 | 0,0867 | |||
| JNJ / Johnson & Johnson | 0,00 | -5,43 | 0,73 | -12,95 | 0,5159 | -0,1199 | |||
| MS / Morgan Stanley | 0,01 | 0,00 | 0,72 | 20,67 | 0,5098 | 0,0565 | |||
| ADP / Automatic Data Processing, Inc. | 0,00 | -16,06 | 0,71 | -15,37 | 0,5010 | -0,1338 | |||
| CSCO / Cisco Systems, Inc. | 0,01 | 0,00 | 0,69 | 12,34 | 0,4916 | 0,0222 | |||
| CTAS / Cintas Corporation | 0,00 | -6,34 | 0,69 | 1,63 | 0,4864 | -0,0277 | |||
| AMT / American Tower Corporation | 0,00 | 0,00 | 0,68 | 1,49 | 0,4823 | -0,0274 | |||
| CAT / Caterpillar Inc. | 0,00 | 0,00 | 0,68 | 17,74 | 0,4808 | 0,0423 | |||
| USB / U.S. Bancorp | 0,01 | 0,00 | 0,68 | 7,14 | 0,4796 | -0,0008 | |||
| GD / General Dynamics Corporation | 0,00 | 0,00 | 0,66 | 7,01 | 0,4659 | -0,0015 | |||
| EMR / Emerson Electric Co. | 0,00 | 0,00 | 0,65 | 21,56 | 0,4646 | 0,0545 | |||
| KLAC / KLA Corporation | 0,00 | -6,49 | 0,64 | 23,14 | 0,4577 | 0,0589 | |||
| INTU / Intuit Inc. | 0,00 | -6,61 | 0,64 | 19,70 | 0,4576 | 0,0475 | |||
| MAR / Marriott International, Inc. | 0,00 | 0,00 | 0,64 | 14,82 | 0,4566 | 0,0293 | |||
| MCD / McDonald's Corporation | 0,00 | 0,00 | 0,63 | -6,50 | 0,4495 | -0,0664 | |||
| IEI / iShares Trust - iShares 3-7 Year Treasury Bond ETF | 0,01 | 0,00 | 0,63 | 0,80 | 0,4452 | -0,0289 | |||
| ITW / Illinois Tool Works Inc. | 0,00 | 0,00 | 0,61 | -0,17 | 0,4294 | -0,0330 | |||
| BK / The Bank of New York Mellon Corporation | 0,01 | -9,17 | 0,60 | -1,47 | 0,4293 | -0,0377 | |||
| BSV / Vanguard Bond Index Funds - Vanguard Short-Term Bond ETF | 0,01 | 0,00 | 0,60 | 0,50 | 0,4255 | -0,0288 | |||
| APD / Air Products and Chemicals, Inc. | 0,00 | 0,00 | 0,59 | -4,36 | 0,4204 | -0,0515 | |||
| IBM / International Business Machines Corporation | 0,00 | -0,30 | 0,59 | 18,07 | 0,4180 | 0,0383 | |||
| NDAQ / Nasdaq, Inc. | 0,01 | -6,73 | 0,59 | 9,91 | 0,4176 | 0,0098 | |||
| VCIT / Vanguard Scottsdale Funds - Vanguard Intermediate-Term Corporate Bond ETF | 0,01 | 0,00 | 0,57 | 1,43 | 0,4033 | -0,0236 | |||
| UNP / Union Pacific Corporation | 0,00 | -20,79 | 0,56 | -22,88 | 0,4001 | -0,1566 | |||
| XONE / BondBloxx ETF Trust - BondBloxx Bloomberg One Year Target Duration US Treasury ETF | 0,01 | 0,00 | 0,56 | -0,18 | 0,4000 | -0,0302 | |||
| FLOT / iShares Trust - iShares Floating Rate Bond ETF | 0,01 | 1,39 | 0,56 | 1,27 | 0,3956 | -0,0235 | |||
| IP / International Paper Company | 0,01 | 0,00 | 0,55 | -12,10 | 0,3918 | -0,0874 | |||
| EFA / iShares Trust - iShares MSCI EAFE ETF | 0,01 | 8,42 | 0,54 | 18,50 | 0,3825 | 0,0362 | |||
| DUK / Duke Energy Corporation | 0,00 | 0,00 | 0,53 | -3,29 | 0,3760 | -0,0412 | |||
| ECL / Ecolab Inc. | 0,00 | 0,53 | 0,3733 | 0,3733 | |||||
| XHLF / BondBloxx ETF Trust - BondBloxx Bloomberg Six Month Target Duration US Treasury ETF | 0,01 | -18,67 | 0,52 | -18,71 | 0,3673 | -0,1177 | |||
| PH / Parker-Hannifin Corporation | 0,00 | -6,39 | 0,51 | 7,58 | 0,3634 | 0,0007 | |||
| ANET / Arista Networks Inc | 0,00 | 1,23 | 0,51 | 33,77 | 0,3599 | 0,0709 | |||
| J / Jacobs Solutions Inc. | 0,00 | -5,51 | 0,51 | 2,84 | 0,3598 | -0,0161 | |||
| HCA / HCA Healthcare, Inc. | 0,00 | -6,58 | 0,51 | 3,48 | 0,3589 | -0,0131 | |||
| AIG / American International Group, Inc. | 0,01 | -7,84 | 0,49 | -9,33 | 0,3456 | -0,0633 | |||
| SPHQ / Invesco Exchange-Traded Fund Trust - Invesco S&P 500 Quality ETF | 0,01 | 0,00 | 0,48 | 7,35 | 0,3427 | 0,0002 | |||
| PGX / Invesco Exchange-Traded Fund Trust II - Invesco Preferred ETF | 0,04 | 0,00 | 0,48 | -0,83 | 0,3410 | -0,0280 | |||
| MCK / McKesson Corporation | 0,00 | 60,69 | 0,48 | 75,46 | 0,3401 | 0,1314 | |||
| BMI / Badger Meter, Inc. | 0,00 | -6,84 | 0,47 | 19,90 | 0,3339 | 0,0351 | |||
| TSM / Taiwan Semiconductor Manufacturing Company Limited - Depositary Receipt (Common Stock) | 0,00 | -9,35 | 0,47 | 23,54 | 0,3319 | 0,0438 | |||
| IWM / iShares Trust - iShares Russell 2000 ETF | 0,00 | -0,34 | 0,44 | 7,86 | 0,3121 | 0,0013 | |||
| NEE / NextEra Energy, Inc. | 0,01 | -21,74 | 0,44 | -23,33 | 0,3102 | -0,1243 | |||
| BDX / Becton, Dickinson and Company | 0,00 | 19,91 | 0,44 | -9,94 | 0,3093 | -0,0589 | |||
| RJF / Raymond James Financial, Inc. | 0,00 | -6,26 | 0,43 | 3,58 | 0,3080 | -0,0115 | |||
| PEP / PepsiCo, Inc. | 0,00 | -15,89 | 0,41 | -25,90 | 0,2927 | -0,1315 | |||
| SCHD / Schwab Strategic Trust - Schwab U.S. Dividend Equity ETF | 0,01 | 0,00 | 0,38 | -5,24 | 0,2703 | -0,0359 | |||
| AMP / Ameriprise Financial, Inc. | 0,00 | -0,49 | 0,33 | 9,80 | 0,2311 | 0,0050 | |||
| CMG / Chipotle Mexican Grill, Inc. | 0,01 | -26,55 | 0,32 | -17,81 | 0,2296 | -0,0704 | |||
| IVV / iShares Trust - iShares Core S&P 500 ETF | 0,00 | -15,68 | 0,31 | -6,91 | 0,2203 | -0,0335 | |||
| TMUS / T-Mobile US, Inc. | 0,00 | -0,51 | 0,28 | -11,15 | 0,1982 | -0,0412 | |||
| WM / Waste Management, Inc. | 0,00 | -43,79 | 0,27 | -44,49 | 0,1896 | -0,1769 | |||
| VIG / Vanguard Specialized Funds - Vanguard Dividend Appreciation ETF | 0,00 | 0,00 | 0,26 | 5,60 | 0,1878 | -0,0033 | |||
| SO / The Southern Company | 0,00 | -7,08 | 0,26 | -7,14 | 0,1846 | -0,0290 | |||
| NSC / Norfolk Southern Corporation | 0,00 | 0,00 | 0,26 | 8,05 | 0,1817 | 0,0012 | |||
| BX / Blackstone Inc. | 0,00 | -14,70 | 0,25 | -8,70 | 0,1793 | -0,0316 | |||
| CEG / Constellation Energy Corporation | 0,00 | 0,25 | 0,1752 | 0,1752 | |||||
| DKS / DICK'S Sporting Goods, Inc. | 0,00 | 0,54 | 0,22 | -1,35 | 0,1568 | -0,0138 | |||
| TBIL / The RBB Fund, Inc. - F/m US Treasury 3 Month Bill ETF | 0,00 | -37,15 | 0,21 | -37,17 | 0,1513 | -0,1072 | |||
| GEHC / GE HealthCare Technologies Inc. | 0,00 | -0,42 | 0,21 | -8,73 | 0,1487 | -0,0260 | |||
| KIM / Kimco Realty Corporation | 0,01 | 0,20 | 0,1431 | 0,1431 | |||||
| ODFL / Old Dominion Freight Line, Inc. | 0,00 | -100,00 | 0,00 | 0,0000 | |||||
| DELL / Dell Technologies Inc. | 0,00 | -100,00 | 0,00 | 0,0000 | |||||
| SHEL / Shell plc - Depositary Receipt (Common Stock) | 0,00 | -100,00 | 0,00 | 0,0000 | |||||
| PSX / Phillips 66 | 0,00 | -100,00 | 0,00 | 0,0000 | |||||
| UNH / UnitedHealth Group Incorporated | 0,00 | -100,00 | 0,00 | 0,0000 | |||||
| ROP / Roper Technologies, Inc. | 0,00 | -100,00 | 0,00 | 0,0000 | |||||
| LMT / Lockheed Martin Corporation | 0,00 | -100,00 | 0,00 | 0,0000 | |||||
| DHI / D.R. Horton, Inc. | 0,00 | -100,00 | 0,00 | 0,0000 |