Grundlæggende statistik
| Institutionelle ejere | 139 total, 139 long only, 0 short only, 0 long/short - change of 25,89% MRQ |
| Gennemsnitlig porteføljeallokering | 0.3456 % - change of -30,21% MRQ |
| Institutionelle aktier (lange) | 5.986.629 (ex 13D/G) - change of 0,59MM shares 10,89% MRQ |
| Institutionel værdi (lang) | $ 593.367 USD ($1000) |
Institutionelt ejerskab og aktionærer
Vanguard Municipal Bond Funds - Vanguard Intermediate-Term Tax-Exempt Bond ETF (US:VTEI) har 139 institutionelle ejere og aktionærer, der har indsendt 13D/G- eller 13F-formularer til Securities Exchange Commission (SEC). Disse institutioner har i alt 5,986,629 aktier. Største aktionærer omfatter Unison Advisors LLC, Tiaa Trust, National Association, Envestnet Asset Management Inc, Joel Isaacson & Co., LLC, HighTower Advisors, LLC, Commonwealth Equity Services, Llc, Cetera Investment Advisers, Seeds Investor Llc, Avantax Planning Partners, Inc., and Bank Of America Corp /de/ .
Vanguard Municipal Bond Funds - Vanguard Intermediate-Term Tax-Exempt Bond ETF (BATS:VTEI) institutionel ejerskabsstruktur viser aktuelle positioner i virksomheden efter institutioner og fonde, samt seneste ændringer i positionsstørrelse. Større aktionærer kan omfatte individuelle investorer, investeringsforeninger, hedgefonde eller institutioner. Skema 13D angiver, at investoren besidder (eller besidder) mere end 5 % af virksomheden og har til hensigt (eller har til hensigt at) aktivt at forfølge en ændring i forretningsstrategi. Skema 13G indikerer en passiv investering på over 5%.
The share price as of March 6, 2026 is 101,47 / share. Previously, on March 10, 2025, the share price was 99,95 / share. This represents an increase of 1,52% over that period.

Fondens stemningsscore
Fund Sentiment Score (fka Ownership Accumulation Score) finder de aktier, der bliver mest købt af fonde. Det er resultatet af en sofistikeret, multi-faktor kvantitativ model, der identificerer virksomheder med de højeste niveauer af institutionel akkumulering. Scoringsmodellen bruger en kombination af den samlede stigning i oplyste ejere, ændringerne i porteføljeallokeringer i disse ejere og andre målinger. Tallet går fra 0 til 100, hvor højere tal indikerer et højere niveau af akkumulering for sine jævnaldrende, og 50 er gennemsnittet.
Opdateringsfrekvens: Dagligt
Se Ownership Explorer, som giver en liste over højest rangerende virksomheder.
AI+ Ask Fintel’s AI assistant about Vanguard Municipal Bond Funds - Vanguard Intermediate-Term Tax-Exempt Bond ETF.
Select a question to share a public post with an AI-crafted answer.
Thinking of good questions…
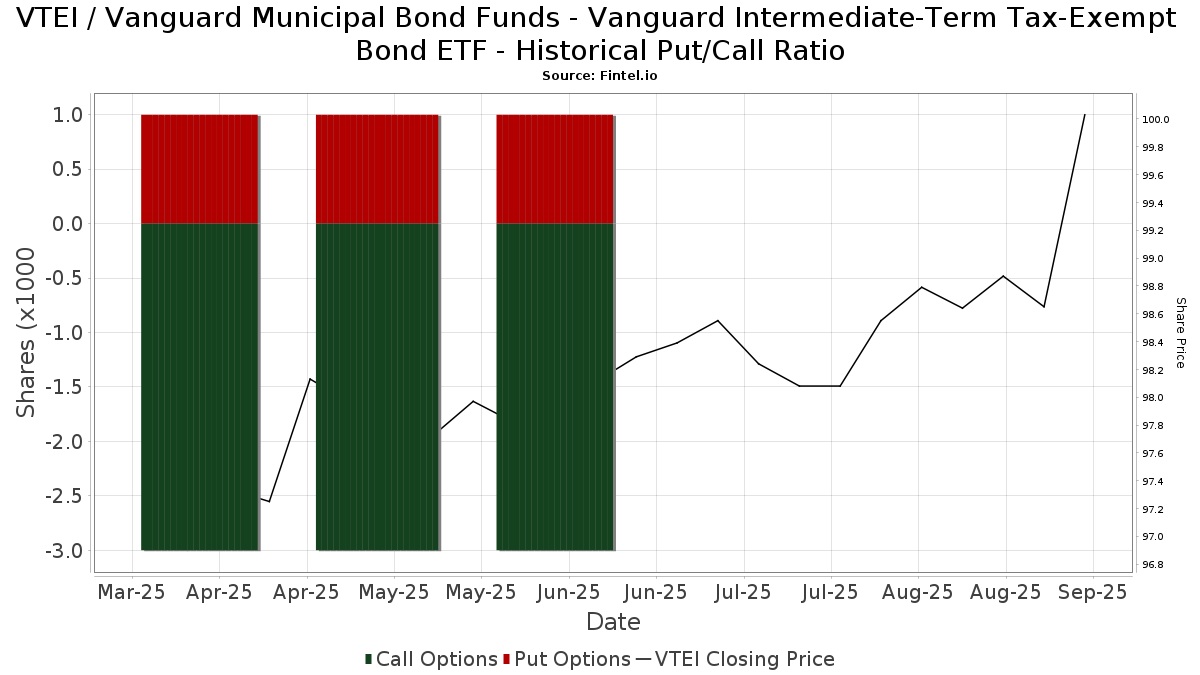
Institutionel Put/Call-forhold
Ud over at indberette standardaktie- og gældsudstedelser skal institutter med mere end 100 mill. aktiver under forvaltning også oplyse deres put- og call-optionsbeholdninger. Da salgsoptioner generelt indikerer negativ stemning, og købsoptioner indikerer positiv stemning, kan vi få en fornemmelse af den overordnede institutionelle stemning ved at plotte forholdet mellem put og kald. Diagrammet til højre viser det historiske put/call-forhold for dette instrument.
Brug af Put/Call Ratio som en indikator for investorernes stemning overvinder en af de vigtigste mangler ved at bruge totalt institutionelt ejerskab, som er, at en betydelig mængde af aktiver under forvaltning investeres passivt for at spore indekser. Passivt forvaltede fonde køber typisk ikke optioner, så indikatoren for put/call-forholdet følger mere nøje følelsen af aktivt forvaltede fonde.
13F og NPORT arkivering
Detaljer om 13F-arkivering er gratis. Detaljer om NP-ansøgninger kræver et premium-medlemskab. Grønne rækker angiver nye positioner. Røde rækker angiver lukkede positioner. Klik på linket ikon for at se den fulde transaktionshistorik.
Opgrader
for at låse premium-data op og eksportere til Excel ![]() .
.
| Fil dato | Kilde | Investor | Type | Gennemsnitlig pris (Øst) |
Aktier | Δ Aktier (%) |
Rapporteret Værdi ($1000) |
Δ Værdi (%) |
Port Alloc (%) |
|
|---|---|---|---|---|---|---|---|---|---|---|
| 2026-02-03 | 13F | Silver Oak Advisory Group, Inc. | 59.479 | 13,77 | 6 | 0,00 | ||||
| 2026-02-05 | 13F | Cambridge Investment Research Advisors, Inc. | 3.776 | 69,63 | 0 | |||||
| 2026-01-30 | 13F | North Star Investment Management Corp. | 581 | 1,04 | 59 | 1,75 | ||||
| 2026-02-12 | 13F | Bank Of Montreal /can/ | 1.500 | 151 | ||||||
| 2026-02-10 | 13F | Essex Financial Services, Inc. | 4.011 | 58,85 | 404 | 59,68 | ||||
| 2026-02-03 | 13F | Emerald Investment Partners, Llc | 663 | 67 | ||||||
| 2026-02-10 | 13F | SCS Capital Management LLC | 4.390 | 0,00 | 443 | 0,45 | ||||
| 2026-01-08 | 13F | Financial Management Network Inc | 12.533 | 7,18 | 1.264 | 7,94 | ||||
| 2026-02-17 | 13F | Jones Financial Companies Lllp | 38.908 | 132,23 | 3.923 | 133,79 | ||||
| 2026-01-08 | 13F | Genesis Private Wealth, Llc | 12.653 | 44,14 | 1.276 | 44,89 | ||||
| 2025-11-14 | 13F | Brown Advisory Inc | 0 | -100,00 | 0 | |||||
| 2026-01-21 | 13F | Unison Advisors LLC | 2.195.778 | 1,04 | 221.400 | 1,55 | ||||
| 2026-01-26 | 13F | Lakewood Asset Management LLC | 2.335 | -11,52 | 235 | -10,98 | ||||
| 2026-01-29 | 13F | Kestra Private Wealth Services, Llc | 3.867 | 12,25 | 390 | 12,75 | ||||
| 2026-02-13 | 13F | Maia Wealth LLC | 0 | -100,00 | 0 | |||||
| 2026-02-05 | 13F | Sequent Planning LLC | 3.781 | 381 | ||||||
| 2026-02-17 | 13F | Citadel Advisors Llc | 32.030 | 59,53 | 3.230 | 60,33 | ||||
| 2026-02-17 | 13F | Fmr Llc | 32 | -15,79 | 3 | 0,00 | ||||
| 2026-02-18 | 13F | Beacon Pointe Advisors, LLC | 3.751 | 44,44 | 378 | 45,38 | ||||
| 2026-02-02 | 13F | TCI Wealth Advisors, Inc. | 20.912 | 3,27 | 2.109 | 3,79 | ||||
| 2026-02-19 | 13F | CI Private Wealth, LLC | 2.961 | 0,75 | 299 | 1,36 | ||||
| 2026-01-29 | 13F | Comerica Bank | 2.245 | 0,00 | 226 | 0,44 | ||||
| 2026-02-06 | 13F | Pnc Financial Services Group, Inc. | 407 | 0,00 | 41 | 2,50 | ||||
| 2026-01-02 | 13F | First Financial Bank - Trust Division | 37.288 | 31,52 | 3.760 | 32,17 | ||||
| 2026-02-17 | 13F | Captrust Financial Advisors | 22.826 | 2.302 | ||||||
| 2026-02-11 | 13F | LPL Financial LLC | 43.910 | 12,34 | 4.427 | 12,90 | ||||
| 2026-02-03 | 13F | Hemenway Trust Co LLC | 2.483 | 0,00 | 250 | 0,40 | ||||
| 2026-02-04 | 13F | Wsfs Capital Management, Llc | 10.677 | 0,00 | 1.077 | 0,47 | ||||
| 2026-02-10 | 13F | Peapack Gladstone Financial Corp | 7.705 | 0,00 | 1 | |||||
| 2026-01-23 | 13F | Beacon Harbor Wealth Advisors, Inc. | 0 | -100,00 | 0 | |||||
| 2026-02-04 | 13F | Valeo Financial Advisors, LLC | 13.536 | 22,32 | 1.365 | 22,88 | ||||
| 2026-01-26 | 13F | Private Trust Co Na | 401 | 40 | ||||||
| 2026-02-02 | 13F | Benjamin Edwards Inc | 5.208 | 65,75 | 526 | 66,67 | ||||
| 2026-01-30 | 13F | BancorpSouth Bank | 6.922 | 100,12 | 698 | 100,86 | ||||
| 2026-02-02 | 13F | Integrity Wealth Solutions LLC | 22.560 | 17,23 | 2.275 | 17,82 | ||||
| 2026-02-17 | 13F | Donalies Financial Planning, LLC | 2.708 | 273 | ||||||
| 2026-01-28 | 13F | Chicago Partners Investment Group LLC | 2.781 | 282 | ||||||
| 2026-02-09 | 13F | Huntington National Bank | 57 | 409,09 | ||||||
| 2025-10-27 | 13F | New Republic Capital, LLC | 0 | -100,00 | 0 | |||||
| 2026-02-13 | 13F | Morgan Stanley | 19 | 2 | ||||||
| 2025-11-12 | 13F | Mill Creek Capital Advisors, LLC | 0 | -100,00 | 0 | |||||
| 2026-02-17 | 13F | Warren Averett Asset Management, LLC | 5.906 | 16,81 | 595 | 17,36 | ||||
| 2026-01-26 | 13F | Cwm, Llc | 227 | 0 | ||||||
| 2026-02-11 | 13F | Mitchell Mcleod Pugh & Williams Inc | 15.175 | 1.546 | ||||||
| 2026-02-13 | 13F | Mariner, LLC | 17.741 | 10,85 | 1.789 | 11,40 | ||||
| 2026-01-27 | 13F | 55 North Private Wealth, LLC | 3.238 | 327 | ||||||
| 2026-02-06 | 13F | One Degree Advisors Inc | 2.672 | 0 | ||||||
| 2026-01-21 | 13F | Westfuller Advisors, LLC | 2.226 | 1,04 | 224 | 1,36 | ||||
| 2026-01-16 | 13F | Stephen J. Garry & Associates, Llc | 10.446 | -25,79 | 1.053 | -25,42 | ||||
| 2025-11-14 | 13F | Susquehanna International Group, Llp | 0 | -100,00 | 0 | |||||
| 2026-02-12 | 13F | Commonwealth Equity Services, Llc | 205.871 | 13,40 | 20.758 | 115.216,67 | ||||
| 2026-01-08 | 13F | Wealth Enhancement Advisory Services, Llc | 5.800 | 52,63 | 587 | 54,21 | ||||
| 2026-02-17 | 13F | Raymond James Financial Inc | 9.139 | -90,11 | 922 | -90,07 | ||||
| 2026-02-17 | 13F | Hilltop Holdings Inc. | 13.175 | 0,21 | 1.328 | 0,68 | ||||
| 2026-02-02 | 13F | Vista Capital Partners, Inc. | 9.568 | 0,00 | 965 | 0,52 | ||||
| 2026-01-23 | 13F | Sage Mountain Advisors LLC | 2.984 | 0,00 | 301 | 0,33 | ||||
| 2026-01-26 | 13F | Whittier Trust Co Of Nevada Inc | 0 | -100,00 | 0 | |||||
| 2026-02-17 | 13F | Wiley Bros.-aintree Capital, Llc | 36.405 | 1.688,06 | 3.671 | 1.699,02 | ||||
| 2026-01-14 | 13F | Jfs Wealth Advisors, Llc | 8.755 | 57,04 | 883 | 57,78 | ||||
| 2026-01-15 | 13F | PFG Private Wealth Management, LLC | 0 | -100,00 | 0 | |||||
| 2026-02-11 | 13F | Cerity Partners LLC | 17.666 | 1.781 | ||||||
| 2026-02-13 | 13F | Asset Allocation Strategies LLC | 2.477 | 250 | ||||||
| 2026-01-12 | 13F | Heartwood Wealth Advisors LLC | 91.133 | -0,49 | 9.189 | 0,00 | ||||
| 2026-02-12 | 13F | Jane Street Group, Llc | 33.593 | -28,68 | 3.387 | -28,32 | ||||
| 2026-01-15 | 13F | Trust Co | 402 | 14,20 | 41 | 14,29 | ||||
| 2026-01-09 | 13F | First Heartland Consultants, Inc. | 16.498 | 3,65 | 1.663 | 4,20 | ||||
| 2026-01-29 | 13F | D.a. Davidson & Co. | 2.700 | 272 | ||||||
| 2026-01-22 | 13F | Red Tortoise LLC | 1.109 | 1,09 | 112 | 0,91 | ||||
| 2026-02-06 | 13F | IFP Advisors, Inc | 1.000 | 101 | ||||||
| 2026-02-13 | 13F | Colony Group, LLC | 2.842 | 287 | ||||||
| 2025-10-10 | 13F | Putnam Fl Investment Management Co | 0 | -100,00 | 0 | |||||
| 2026-01-21 | 13F | Seed Wealth Management, Inc. | 49.885 | -0,42 | 5.030 | 0,06 | ||||
| 2026-02-02 | 13F | Truist Financial Corp | 33.695 | 72,88 | 3.397 | 73,76 | ||||
| 2026-02-03 | 13F | Retirement Planning Group | 10.219 | 0,00 | 1.030 | 0,49 | ||||
| 2026-01-28 | 13F | Alesco Advisors Llc | 4.425 | 446 | ||||||
| 2026-02-17 | 13F | Aqr Capital Management Llc | 2.961 | -64,86 | 299 | -64,73 | ||||
| 2026-02-10 | 13F/A | Northwestern Mutual Wealth Management Co | 10.334 | 164,50 | 1.042 | 166,24 | ||||
| 2026-02-13 | 13F | Flow Traders U.s. Llc | 10.809 | 1 | ||||||
| 2026-02-06 | 13F | Eqis Capital Management, Inc. | 14.479 | 0,87 | 1.460 | 1,32 | ||||
| 2026-02-02 | 13F | Chapman Financial Group, Llc | 2.625 | 265 | ||||||
| 2026-02-13 | 13F | Change Path, LLC | 2.649 | 267 | ||||||
| 2026-02-04 | 13F | Independent Advisor Alliance | 3.241 | 327 | ||||||
| 2026-02-13 | 13F | Fort Point Capital Partners LLC | 9.332 | 948 | ||||||
| 2026-02-12 | 13F | Hrt Financial Lp | 3.384 | 0 | ||||||
| 2026-02-13 | 13F | Resources Investment Advisors, LLC. | 5.234 | 1,04 | 528 | 1,54 | ||||
| 2026-02-17 | 13F | Cetera Investment Advisers | 187.165 | 6,78 | 18.872 | 7,31 | ||||
| 2026-02-09 | 13F | Hartland & Co., LLC | 11.584 | 9,38 | 1.168 | 9,98 | ||||
| 2026-01-14 | 13F | A. D. Beadell Investment Counsel, Inc. | 13.475 | 0,00 | 1 | 0,00 | ||||
| 2026-01-15 | 13F | Elser Financial Planning, Inc | 7.008 | 8,05 | 707 | 8,78 | ||||
| 2026-02-17 | 13F | Signal Tree Financial Partners Llc | 9.189 | 11,27 | 927 | 11,97 | ||||
| 2026-01-21 | 13F | Financial Architects, LLC | 0 | -100,00 | 0 | |||||
| 2026-01-16 | 13F | SigFig Wealth Management, LLC | 14.007 | 2,93 | 1.412 | 3,52 | ||||
| 2026-02-06 | 13F | HighTower Advisors, LLC | 224.657 | 5,84 | 22.652 | 6,37 | ||||
| 2026-02-09 | 13F | Harbour Investments, Inc. | 11.161 | 59,15 | 1.125 | 60,03 | ||||
| 2026-02-10 | 13F | Keyvantage Wealth, Llc | 4.992 | 503 | ||||||
| 2026-02-11 | 13F | Oak Wealth Advisors LLC | 17.393 | 1.754 | ||||||
| 2025-11-14 | 13F | Old Mission Capital Llc | 0 | -100,00 | 0 | |||||
| 2026-02-04 | 13F | Timonier Family Office, LTD. | 18.441 | -1,94 | 1.859 | -1,43 | ||||
| 2026-02-17 | 13F | Bank Of America Corp /de/ | 133.769 | 20,55 | 13.488 | 21,16 | ||||
| 2026-02-11 | 13F | J.w. Cole Advisors, Inc. | 2.094 | -9,04 | 211 | -8,26 | ||||
| 2026-02-17 | 13F | Integrated Advisors Network LLC | 0 | -100,00 | 0 | |||||
| 2026-01-21 | 13F | Apella Capital, LLC | 52.050 | 5.248 | ||||||
| 2026-02-17 | 13F | Equitable Holdings, Inc. | 131.334 | 11,75 | 13.242 | 12,31 | ||||
| 2026-01-14 | 13F | Net Worth Advisory Group | 2.069 | 209 | ||||||
| 2026-01-21 | 13F | Flagship Harbor Advisors, Llc | 10.995 | 14,53 | 1.109 | 15,06 | ||||
| 2026-02-18 | 13F | GWM Advisors LLC | 0 | -100,00 | 0 | |||||
| 2026-01-26 | 13F | Luminvest Wealth Management LLC | 4.782 | 0,00 | 482 | 0,63 | ||||
| 2026-01-21 | 13F | SJS Investment Consulting Inc. | 2.120 | 87,78 | 214 | 88,50 | ||||
| 2026-02-17 | 13F | Cresset Asset Management, LLC | 1.985 | -9,57 | 200 | -9,09 | ||||
| 2026-01-12 | 13F | Seacrest Wealth Management, Llc | 2.164 | 219 | ||||||
| 2026-01-16 | 13F | DiNuzzo Private Wealth, Inc. | 828 | 13,58 | 84 | 15,28 | ||||
| 2026-01-07 | 13F | IAM Advisory, LLC | 9.586 | 967 | ||||||
| 2026-02-10 | 13F | Envestnet Asset Management Inc | 308.659 | -4,40 | 31.122 | -3,93 | ||||
| 2026-01-08 | 13F | Sprinkle Financial Consultants LLC | 10.000 | 1.008 | ||||||
| 2026-01-20 | 13F | C2P Capital Advisory Group, LLC d.b.a. Prosperity Capital Advisors | 37.241 | 10,17 | 3.755 | 10,73 | ||||
| 2026-02-13 | 13F | Graney & King, LLC | 505 | 1,00 | 51 | 0,00 | ||||
| 2026-02-05 | 13F | Avantax Planning Partners, Inc. | 159.973 | -5,33 | 16.130 | -4,85 | ||||
| 2026-02-09 | 13F | HBK Sorce Advisory LLC | 9.783 | 17,95 | 996 | 19,42 | ||||
| 2026-02-02 | 13F | Oppenheimer & Co Inc | 21.747 | 56,45 | 2.193 | 57,25 | ||||
| 2026-01-29 | 13F | S.A. Mason LLC | 43.061 | 856,91 | 4.342 | 862,53 | ||||
| 2026-01-30 | 13F | Joel Isaacson & Co., LLC | 236.654 | 0,61 | 23.862 | 1,11 | ||||
| 2026-02-17 | 13F | Advisor Group Holdings, Inc. | 11.476 | 49,33 | 1.157 | 52,24 | ||||
| 2026-01-15 | 13F | 25 Llc | 6.310 | 0,41 | 636 | 0,95 | ||||
| 2026-01-27 | 13F | Seeds Investor Llc | 162.266 | -1,80 | 16.361 | -1,30 | ||||
| 2026-02-09 | 13F | Gordian Advisors LLC | 4.313 | 0,00 | 435 | 0,46 | ||||
| 2026-02-10 | 13F | Goldman Sachs Group Inc | 3.356 | 338 | ||||||
| 2026-01-26 | 13F | Merit Financial Group, LLC | 59.757 | 6.025 | ||||||
| 2026-02-09 | 13F | Narus Financial Partners, LLC | 2.000 | 0,00 | 202 | 0,50 | ||||
| 2026-01-21 | 13F | Crews Bank & Trust | 5.515 | 26,78 | 556 | 27,52 | ||||
| 2026-02-05 | 13F | Rossmore Private Capital | 6.998 | 706 | ||||||
| 2025-10-27 | 13F | Belvedere Trading LLC | Call | 0 | -100,00 | 0 | ||||
| 2026-02-13 | 13F | Wells Fargo & Company/mn | 0 | 0 | ||||||
| 2025-10-27 | 13F | Belvedere Trading LLC | Put | 0 | -100,00 | 0 | ||||
| 2026-01-23 | 13F | Farther Finance Advisors, LLC | 9.012 | -12,02 | 909 | -11,59 | ||||
| 2026-02-11 | 13F | Tiaa Trust, National Association | 403.849 | 45,08 | 40.720 | 45,80 | ||||
| 2026-02-17 | 13F | Elequin Capital Lp | 14.062 | 1.418 | ||||||
| 2026-01-29 | 13F | Sanctuary Advisors, LLC | 2.580 | 11,88 | 260 | 12,55 | ||||
| 2026-01-14 | 13F | Spire Wealth Management | 30 | -86,96 | 3 | -86,96 | ||||
| 2026-02-10 | 13F | IFG Advisory, LLC | 4.200 | 423 | ||||||
| 2026-01-07 | 13F | Winebrenner Capital Management Llc | 2.700 | 0,00 | 272 | 0,74 | ||||
| 2026-01-26 | 13F | Frankly Finances, LLC | 13.979 | 1.410 | ||||||
| 2026-02-06 | 13F | EverSource Wealth Advisors, LLC | 4.816 | 196,37 | 486 | 199,38 | ||||
| 2026-02-05 | 13F | Atria Investments Llc | 54.042 | -3,25 | 5.449 | -2,77 | ||||
| 2026-02-06 | 13F | Envestnet Portfolio Solutions, Inc. | 11.733 | 2,57 | 1.183 | 3,14 | ||||
| 2025-11-14 | 13F | Aberdeen Wealth Management LLC | 0 | -100,00 | 0 | |||||
| 2025-10-30 | 13F | Oak Hill Wealth Advisors, Llc | 16.781 | 27,06 | 1.684 | 29,56 | ||||
| 2026-01-22 | 13F | Paragon Capital Management Ltd | 17.562 | 0,66 | 1.771 | 1,14 | ||||
| 2026-01-23 | 13F | Sheridan Capital Management, LLC | 10.025 | 16,23 | 1.011 | 16,76 | ||||
| 2026-01-26 | 13F | Tribridge Partners Financial LLC | 6.346 | 120,96 | 640 | 122,65 | ||||
| 2026-02-17 | 13F | Tower Research Capital LLC (TRC) | 1.450 | 146 | ||||||
| 2026-02-17 | 13F | Royal Bank Of Canada | 4.216 | 201,36 | 425 | 203,57 | ||||
| 2026-01-13 | 13F | CoreCap Advisors, LLC | 4.855 | 0,54 | 490 | 1,03 | ||||
| 2026-01-16 | 13F | Aspire Private Capital, LLC | 103.450 | 0,10 | 10.431 | 0,59 | ||||
| 2026-02-14 | 13F | Dempze Nancy E | 1.994 | 201 | ||||||
| 2026-01-20 | 13F | American National Bank | 662 | 115,64 | 67 | 120,00 | ||||
| 2026-01-29 | 13F | Ashton Thomas Private Wealth, LLC | 64.754 | 44,28 | 6.529 | 45,02 | ||||
| 2026-01-27 | 13F | Symmetry Partners, LLC | 3.432 | 346 | ||||||
| 2026-02-13 | 13F | Kestra Advisory Services, LLC | 0 | -100,00 | 0 |