Grundlæggende statistik
| Institutionelle ejere | 181 total, 181 long only, 0 short only, 0 long/short - change of 5,85% MRQ |
| Gennemsnitlig porteføljeallokering | 0.2032 % - change of 7,60% MRQ |
| Institutionelle aktier (lange) | 2.643.434 (ex 13D/G) - change of -0,21MM shares -7,35% MRQ |
| Institutionel værdi (lang) | $ 314.372 USD ($1000) |
Institutionelt ejerskab og aktionærer
Vanguard Admiral Funds - Vanguard S&P Small-Cap 600 Growth ETF (US:VIOG) har 181 institutionelle ejere og aktionærer, der har indsendt 13D/G- eller 13F-formularer til Securities Exchange Commission (SEC). Disse institutioner har i alt 2,643,434 aktier. Største aktionærer omfatter Morgan Stanley, LPL Financial LLC, Strategic Advocates LLC, Bank Of America Corp /de/, Raymond James Financial Inc, Mariner, LLC, Dougherty Wealth Advisers LLC, Steward Partners Investment Advisory, Llc, Royal Bank Of Canada, and Global Retirement Partners, LLC .
Vanguard Admiral Funds - Vanguard S&P Small-Cap 600 Growth ETF (ARCA:VIOG) institutionel ejerskabsstruktur viser aktuelle positioner i virksomheden efter institutioner og fonde, samt seneste ændringer i positionsstørrelse. Større aktionærer kan omfatte individuelle investorer, investeringsforeninger, hedgefonde eller institutioner. Skema 13D angiver, at investoren besidder (eller besidder) mere end 5 % af virksomheden og har til hensigt (eller har til hensigt at) aktivt at forfølge en ændring i forretningsstrategi. Skema 13G indikerer en passiv investering på over 5%.
The share price as of March 27, 2026 is 121,40 / share. Previously, on March 31, 2025, the share price was 106,88 / share. This represents an increase of 13,59% over that period.

Fondens stemningsscore
Fund Sentiment Score (fka Ownership Accumulation Score) finder de aktier, der bliver mest købt af fonde. Det er resultatet af en sofistikeret, multi-faktor kvantitativ model, der identificerer virksomheder med de højeste niveauer af institutionel akkumulering. Scoringsmodellen bruger en kombination af den samlede stigning i oplyste ejere, ændringerne i porteføljeallokeringer i disse ejere og andre målinger. Tallet går fra 0 til 100, hvor højere tal indikerer et højere niveau af akkumulering for sine jævnaldrende, og 50 er gennemsnittet.
Opdateringsfrekvens: Dagligt
Se Ownership Explorer, som giver en liste over højest rangerende virksomheder.
AI+ Ask Fintel’s AI assistant about Vanguard Admiral Funds - Vanguard S&P Small-Cap 600 Growth ETF.
Select a question to share a public post with an AI-crafted answer.
Thinking of good questions…
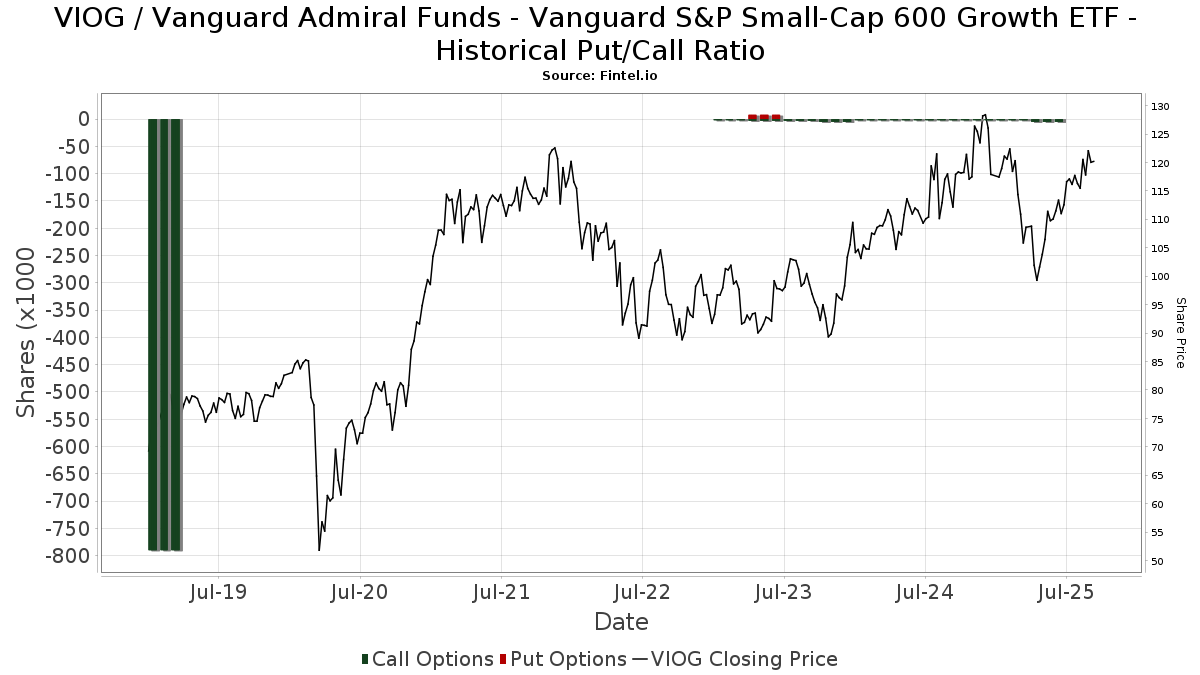
Institutionel Put/Call-forhold
Ud over at indberette standardaktie- og gældsudstedelser skal institutter med mere end 100 mill. aktiver under forvaltning også oplyse deres put- og call-optionsbeholdninger. Da salgsoptioner generelt indikerer negativ stemning, og købsoptioner indikerer positiv stemning, kan vi få en fornemmelse af den overordnede institutionelle stemning ved at plotte forholdet mellem put og kald. Diagrammet til højre viser det historiske put/call-forhold for dette instrument.
Brug af Put/Call Ratio som en indikator for investorernes stemning overvinder en af de vigtigste mangler ved at bruge totalt institutionelt ejerskab, som er, at en betydelig mængde af aktiver under forvaltning investeres passivt for at spore indekser. Passivt forvaltede fonde køber typisk ikke optioner, så indikatoren for put/call-forholdet følger mere nøje følelsen af aktivt forvaltede fonde.
13D/G-arkivering
Vi præsenterer 13D/G ansøgninger separat fra 13F ansøgninger på grund af den forskellige behandling af SEC. 13D/G-ansøgninger kan indgives af grupper af investorer (med én ledende), hvorimod 13F-ansøgninger ikke kan. Dette resulterer i situationer, hvor en investor kan indsende en 13D/G, der rapporterer én værdi for de samlede aktier (der repræsenterer alle de aktier, der ejes af investorgruppen), men derefter indsender en 13F, der rapporterer en anden værdi for de samlede aktier (der udelukkende repræsenterer deres egne) ejendomsret). Det betyder, at aktieejerskab af 13D/G-arkiver og 13F-arkiveringer ofte ikke er direkte sammenlignelige, så vi præsenterer dem separat.
Bemærk: Fra den 16. maj 2021 viser vi ikke længere ejere, der ikke har indsendt en 13D/G inden for det seneste år. Tidligere viste vi den fulde historie af 13D/G-arkiver. Generelt skal enheder, der er forpligtet til at indgive 13D/G-ansøgninger, indgive mindst årligt, før de indsender en afsluttende ansøgning. Dog forlader fonde nogle gange positioner uden at indsende en afsluttende ansøgning (dvs. de afvikler), så visning af den fulde historie resulterede nogle gange i forvirring om det nuværende ejerskab. For at undgå forvirring viser vi nu kun 'aktuelle' ejere - det vil sige - ejere, der har anmeldt inden for det seneste år.
Upgrade to unlock premium data.
| Fil dato | Form | Investor | Forrige Aktier |
Seneste Aktier |
Δ Aktier (Procent) |
Ejendomsret (Procent) |
Δ Ejerskab (Procent) |
|
|---|---|---|---|---|---|---|---|---|
| 2025-04-21 | Bank of New York Mellon Corp | 762,469 | 65 | -99.99 | 0.00 | -100.00 |
13F og NPORT arkivering
Detaljer om 13F-arkivering er gratis. Detaljer om NP-ansøgninger kræver et premium-medlemskab. Grønne rækker angiver nye positioner. Røde rækker angiver lukkede positioner. Klik på linket ikon for at se den fulde transaktionshistorik.
Opgrader
for at låse premium-data op og eksportere til Excel ![]() .
.
| Fil dato | Kilde | Investor | Type | Gennemsnitlig pris (Øst) |
Aktier | Δ Aktier (%) |
Rapporteret Værdi ($1000) |
Δ Værdi (%) |
Port Alloc (%) |
|
|---|---|---|---|---|---|---|---|---|---|---|
| 2025-10-27 | 13F | Bogart Wealth, LLC | 0 | -100,00 | 0 | |||||
| 2026-02-06 | 13F | Global Retirement Partners, LLC | 61.246 | 2,91 | 7.428 | 2,51 | ||||
| 2026-02-11 | 13F | Atlanta Consulting Group Advisors, LLC | 3.185 | 0,00 | 386 | -0,52 | ||||
| 2025-11-06 | 13F | Ameritas Advisory Services, LLC | 0 | -100,00 | 0 | |||||
| 2025-11-14 | 13F | Capital Analysts, Inc. | 0 | -100,00 | 0 | |||||
| 2025-11-14 | 13F | CI Private Wealth, LLC | 0 | -100,00 | 0 | -100,00 | ||||
| 2026-02-05 | 13F | Tucker Asset Management Llc | 10 | 0,00 | 1 | 0,00 | ||||
| 2026-01-29 | 13F | Washington Capital Management Inc | 0 | -100,00 | 0 | |||||
| 2026-02-12 | 13F | Hm Payson & Co | 35 | 0,00 | 4 | 0,00 | ||||
| 2026-02-13 | 13F | MAI Capital Management | 2.651 | 0,57 | 321 | 0,31 | ||||
| 2026-01-28 | 13F | Davis Capital Management | 200 | 0,00 | 24 | 0,00 | ||||
| 2026-02-11 | 13F | LPL Financial LLC | 234.197 | 5,72 | 28.405 | 5,31 | ||||
| 2026-02-13 | 13F | SYM FINANCIAL Corp | 214 | 55,07 | 26 | 56,25 | ||||
| 2026-02-23 | 13F | Beaird Harris Wealth Management, LLC | 3.202 | 0,57 | 388 | 0,26 | ||||
| 2026-01-20 | 13F | SOA Wealth Advisors, LLC. | 132 | 0,00 | 16 | 0,00 | ||||
| 2026-02-14 | 13F | Howe & Rusling Inc | 0 | -100,00 | 0 | |||||
| 2026-01-26 | 13F | Code Waechter LLC | 49.872 | 3,51 | 6.049 | 3,51 | ||||
| 2026-02-12 | 13F | Financial Engines Advisors L.L.C. | 21.957 | -16,13 | 2.663 | -16,44 | ||||
| 2026-01-29 | 13F | Comerica Bank | 87 | 0,00 | 10 | 0,00 | ||||
| 2026-01-13 | 13F | Dakota Wealth Management | 1.800 | 0,00 | 218 | -0,46 | ||||
| 2026-01-26 | 13F | AE Wealth Management LLC | 423 | 0,48 | 51 | 0,00 | ||||
| 2026-02-11 | 13F | Jessup Wealth Management, Inc | 46 | 6 | ||||||
| 2026-01-29 | 13F | UBS Group AG | 29.773 | -23,78 | 3.611 | -24,07 | ||||
| 2026-02-14 | 13F | Rockefeller Capital Management L.P. | 428 | -46,90 | 52 | -47,96 | ||||
| 2026-01-16 | 13F | FNY Investment Advisers, LLC | 0 | -100,00 | 0 | |||||
| 2026-01-23 | 13F | SpringVest Wealth Management LLC | 5.066 | 0,00 | 614 | -0,32 | ||||
| 2026-02-09 | 13F | Keating Financial Advisory Services, Inc. | 623 | 76 | ||||||
| 2026-02-17 | 13F | Citadel Advisors Llc | 4.350 | 528 | ||||||
| 2026-01-16 | 13F | Ronald Blue Trust, Inc. | 250 | 400,00 | 30 | 400,00 | ||||
| 2026-02-03 | 13F/A | Bank Of America Corp /de/ | Call | 0 | -100,00 | 0 | -100,00 | |||
| 2026-01-21 | 13F | Sound Income Strategies, LLC | 80 | 10 | ||||||
| 2025-10-28 | 13F | BRYN MAWR TRUST Co | 209 | 16,11 | 25 | 25,00 | ||||
| 2025-11-07 | 13F | Keener Financial Planning LLC | 0 | -100,00 | 0 | |||||
| 2026-01-08 | 13F | Signet Financial Management, Llc | 4.227 | -0,59 | 513 | -0,97 | ||||
| 2026-01-20 | 13F | Nvwm, Llc | 36 | 0,00 | 4 | 0,00 | ||||
| 2025-11-17 | 13F | FSA Wealth Management LLC | 2.284 | 0,00 | 218 | 11,28 | ||||
| 2026-02-12 | 13F | Triumph Capital Management | 621 | 1,97 | 75 | 1,35 | ||||
| 2026-01-30 | 13F | Simplicity Wealth,LLC | 6.478 | 1,16 | 786 | 0,77 | ||||
| 2026-02-11 | 13F | Strategic Advocates LLC | 155.656 | 4,20 | 19.169 | 5,38 | ||||
| 2026-02-17 | 13F | Spears Abacus Advisors LLC | 4.365 | 14,72 | 529 | 14,25 | ||||
| 2026-02-18 | 13F | GWM Advisors LLC | 1.948 | 2,31 | 236 | 2,16 | ||||
| 2026-01-29 | 13F | D.a. Davidson & Co. | 11.402 | 4,38 | 1.383 | 3,91 | ||||
| 2026-02-02 | 13F | Capital Wealth Management, Llc | 13.007 | 14,97 | 1.578 | 14,52 | ||||
| 2026-02-03 | 13F | Bokf, Na | 127 | 15 | ||||||
| 2026-01-28 | 13F | Salomon & Ludwin, LLC | 620 | 0,00 | 77 | 1,33 | ||||
| 2026-02-17 | 13F | Ameriflex Group, Inc. | 772 | -51,26 | 94 | -51,56 | ||||
| 2026-02-10 | 13F | Continuum Advisory, LLC | 0 | -100,00 | 0 | -100,00 | ||||
| 2026-02-17 | 13F | Jones Financial Companies Lllp | 4.622 | 6,03 | 561 | 5,86 | ||||
| 2026-01-20 | 13F | Sovran Advisors, LLC | 7.703 | 4,83 | 998 | 13,54 | ||||
| 2026-02-11 | 13F | Janney Montgomery Scott LLC | 22.276 | 8,54 | 3 | 0,00 | ||||
| 2026-01-07 | 13F | Fragasso Group Inc. | 1.721 | 209 | ||||||
| 2026-02-05 | 13F | Bessemer Group Inc | 207 | 0,00 | 0 | |||||
| 2026-01-06 | 13F | Davis Investment Partners, LLC | 2.058 | -46,66 | 250 | -46,91 | ||||
| 2025-11-14 | 13F | Brass Tax Wealth Management, Inc | 2.212 | 0,00 | 269 | 6,32 | ||||
| 2026-02-10 | 13F/A | Northwestern Mutual Wealth Management Co | 57.794 | 27,94 | 7.010 | 27,44 | ||||
| 2026-02-17 | 13F | Warren Averett Asset Management, LLC | 6.226 | 54,45 | 755 | 54,08 | ||||
| 2026-02-13 | 13F | Smartleaf Asset Management LLC | 326 | 5.333,33 | 40 | |||||
| 2026-02-12 | 13F | Adviser Investments LLC | 34.469 | 12,73 | 4.181 | 12,31 | ||||
| 2026-02-10 | 13F | Belvedere Trading LLC | Put | 0 | -100,00 | 0 | ||||
| 2026-02-12 | 13F | Bank Of Montreal /can/ | 274 | 28,04 | 33 | 26,92 | ||||
| 2026-01-26 | 13F | Integrated Capital Management, LLC | 1.733 | 0,29 | 210 | -1,87 | ||||
| 2026-02-03 | 13F | Insight 2811, Inc. | 2.431 | 1,93 | 295 | 1,38 | ||||
| 2026-02-11 | 13F | OneAscent Financial Services LLC | 2.115 | 4,96 | 257 | 4,49 | ||||
| 2026-03-16 | 13F | Bank of New Hampshire | 14.955 | -60,86 | 1.814 | -61,02 | ||||
| 2026-02-17 | 13F | Ameriprise Financial Inc | 54.030 | -84,76 | 6.556 | -84,81 | ||||
| 2026-01-29 | 13F | Kestra Private Wealth Services, Llc | 6.355 | 0,30 | 771 | -0,13 | ||||
| 2026-02-05 | 13F | Pacific Sun Financial Corp | 4.377 | -1,68 | 531 | -2,21 | ||||
| 2026-01-13 | 13F | Mather Group, Llc. | 0 | -100,00 | 0 | |||||
| 2026-02-10 | 13F | Blue Barn Wealth, LLC | 0 | -100,00 | 0 | |||||
| 2026-02-17 | 13F | Silvercrest Asset Management Group Llc | 10.610 | 0,31 | 1.287 | -0,08 | ||||
| 2025-11-19 | 13F | Sunbelt Securities, Inc. | 0 | -100,00 | 0 | |||||
| 2026-02-05 | 13F | Allworth Financial LP | 453 | 55 | ||||||
| 2026-01-15 | 13F | Financial Planning Hawaii, Inc. | 2.570 | 312 | ||||||
| 2026-02-12 | 13F | Great Valley Advisor Group, Inc. | 1.733 | 0,52 | 210 | 0,48 | ||||
| 2026-02-13 | 13F | SRS Capital Advisors, Inc. | 265 | 23,26 | 32 | 23,08 | ||||
| 2026-02-17 | 13F | Clark Capital Management Group, Inc. | 3.045 | 369 | ||||||
| 2026-01-30 | 13F | Us Bancorp \de\ | 53 | 0,00 | 6 | 0,00 | ||||
| 2026-02-13 | 13F | Gts Securities Llc | 0 | -100,00 | 0 | |||||
| 2026-02-13 | 13F | Advyzon Investment Management, LLC | 6.569 | 797 | ||||||
| 2026-01-15 | 13F | Kieckhefer Group Llc | 41.015 | -1,43 | 4.975 | -1,82 | ||||
| 2026-01-29 | 13F | ProVise Management Group, LLC | 25.772 | 5,58 | 3.126 | 5,15 | ||||
| 2026-02-11 | 13F | Sunrise Financial Services, LLC | 2.082 | 253 | ||||||
| 2025-11-17 | 13F | Silicon Valley Capital Partners | 0 | -100,00 | 0 | |||||
| 2026-01-21 | 13F | Flagship Harbor Advisors, Llc | 281 | 34 | ||||||
| 2026-01-08 | 13F | Wealth Enhancement Advisory Services, Llc | 4.073 | 0,00 | 513 | 4,07 | ||||
| 2026-02-25 | 13F | Tempo Wealth, LLC | 13.336 | 1.617 | ||||||
| 2026-02-17 | 13F | Cetera Investment Advisers | 21.889 | 9,05 | 2.655 | 8,59 | ||||
| 2026-02-11 | 13F | Ackerman Capital Advisors, LLC | 7.522 | -30,37 | 912 | -30,65 | ||||
| 2026-02-12 | 13F | Moneta Group Investment Advisors Llc | 46.882 | 6,59 | 5.686 | 6,18 | ||||
| 2026-01-22 | 13F | Financial Consulate, Inc | 636 | 0,00 | 77 | 0,00 | ||||
| 2026-01-28 | 13F | Barrett & Company, Inc. | 1.297 | 0,00 | 157 | 0,00 | ||||
| 2026-02-17 | 13F | Advisory Services Network, LLC | 0 | -100,00 | 0 | |||||
| 2026-02-13 | 13F | Brown Advisory Inc | 30.163 | 3,71 | 3.658 | 3,30 | ||||
| 2026-02-13 | 13F | Ubs Asset Management Americas Inc | 286 | 35 | ||||||
| 2026-02-10 | 13F | Belvedere Trading LLC | Call | 4.300 | 86,96 | 522 | 86,07 | |||
| 2026-02-17 | 13F | Bank Of America Corp /de/ | 114.221 | -4,08 | 13.853 | -4,46 | ||||
| 2026-01-30 | 13F | Catalytic Wealth RIA, LLC | 1.690 | -0,82 | 205 | -1,45 | ||||
| 2026-02-12 | 13F | Livet Wealth, LLC | 3.904 | 473 | ||||||
| 2026-02-10 | 13F | Evolution Wealth Management Inc. | 0 | -100,00 | 0 | -100,00 | ||||
| 2026-02-06 | 13F | Larson Financial Group LLC | 4 | 0,00 | 0 | |||||
| 2026-01-29 | 13F | Dougherty Wealth Advisers LLC | 77.808 | 2,95 | 9.437 | 2,54 | ||||
| 2026-02-09 | 13F | Studio Investment Management Llc | 16.693 | -1,19 | 2.025 | -1,84 | ||||
| 2026-01-27 | 13F | Bonfire Financial | 1.973 | -9,20 | 239 | -9,81 | ||||
| 2026-02-12 | 13F | Cloud Capital Management, LLC | 0 | -100,00 | 0 | |||||
| 2026-01-07 | 13F | Crescent Sterling, Ltd. | 7.644 | 35,85 | 927 | 35,33 | ||||
| 2026-02-10 | 13F | Vantus Wealth LLC | 6.699 | 812 | ||||||
| 2026-02-13 | 13F | Entrewealth, Llc | 1.916 | 0,05 | 252 | 7,73 | ||||
| 2026-01-22 | 13F | Rodgers & Associates, LTD | 4.807 | -7,24 | 583 | -7,46 | ||||
| 2026-02-17 | 13F | Equitable Holdings, Inc. | 18.282 | 3,68 | 2.217 | 3,31 | ||||
| 2026-01-23 | 13F | Farther Finance Advisors, LLC | 5.030 | -7,30 | 610 | -7,58 | ||||
| 2026-02-17 | 13F | Mercer Global Advisors Inc /adv | 9.201 | -6,40 | 1.116 | -6,77 | ||||
| 2026-02-09 | 13F | Prospera Financial Services Inc | 3.554 | 2,45 | 431 | 2,13 | ||||
| 2026-01-28 | 13F | Geneos Wealth Management Inc. | 32 | 0,00 | 4 | 0,00 | ||||
| 2026-01-29 | 13F | Vanguard Group Inc | 5.091 | -2,08 | 617 | -2,53 | ||||
| 2026-01-28 | 13F | Glassman Wealth Services | 8 | 0,00 | 1 | |||||
| 2026-02-18 | 13F | Veratis Advisors, Inc. | 17.325 | 2.269 | ||||||
| 2026-01-29 | 13F | Nbc Securities, Inc. | 105 | 13 | ||||||
| 2026-02-12 | 13F | Principal Securities, Inc. | 31.097 | 5,06 | 3.772 | 4,66 | ||||
| 2025-11-14 | 13F | Keebeck Wealth Management, LLC | 0 | -100,00 | 0 | |||||
| 2026-01-28 | 13F | Chicago Partners Investment Group LLC | 1.852 | 1,31 | 239 | 6,25 | ||||
| 2026-01-09 | 13F | Breakwater Capital Group | 2.800 | -3,48 | 340 | -3,97 | ||||
| 2026-02-03 | 13F | Sequoia Financial Advisors, LLC | 2.432 | -0,12 | 295 | -0,68 | ||||
| 2026-01-15 | 13F | Arcadia Investment Advisors Llc | 1.094 | 0,00 | 133 | -0,75 | ||||
| 2026-02-13 | 13F | Mariner, LLC | 88.976 | -35,32 | 10.791 | -35,57 | ||||
| 2026-02-10 | 13F | MidAtlantic Capital Management, Inc. | 1.284 | 156 | ||||||
| 2026-02-17 | 13F | Blair William & Co/il | 1.065 | 0,00 | 129 | 0,00 | ||||
| 2026-02-17 | 13F | Qube Research & Technologies Ltd | 634 | -3,35 | 77 | -3,80 | ||||
| 2026-01-27 | 13F | Osborne Partners Capital Management, Llc | 1.770 | 215 | ||||||
| 2026-02-17 | 13F | Advisor Group Holdings, Inc. | 20.157 | 1,24 | 2.446 | 1,41 | ||||
| 2026-02-23 | 13F | Virtu Financial LLC | 4.944 | 169,87 | 1 | |||||
| 2026-02-17 | 13F | Fmr Llc | 1.353 | -8,15 | 164 | -8,38 | ||||
| 2026-02-18 | 13F | Sierra Capital LLC | 7.698 | 0,31 | 1 | |||||
| 2026-02-09 | 13F | Hantz Financial Services, Inc. | 19 | 0 | ||||||
| 2026-02-10 | 13F | Goldman Sachs Group Inc | 50.000 | -4,10 | 6.064 | -4,47 | ||||
| 2026-01-07 | 13F | Riversedge Advisors, Llc | 6.389 | -3,20 | 775 | -3,61 | ||||
| 2026-02-04 | 13F | Provident Investment Management, Inc. | 0 | -100,00 | 0 | |||||
| 2026-02-05 | 13F | Cambridge Investment Research Advisors, Inc. | 15.150 | 0,13 | 2 | 0,00 | ||||
| 2026-02-13 | 13F | Stifel Financial Corp | 8.601 | -1,82 | 1.043 | -2,16 | ||||
| 2026-02-11 | 13F | Jpmorgan Chase & Co | 21.069 | -2,50 | 2.555 | -2,89 | ||||
| 2026-02-10 | 13F | Savant Capital, LLC | 2.545 | 0,00 | 309 | -0,32 | ||||
| 2026-01-16 | 13F | First Pacific Financial | 348 | 0,58 | 42 | 0,00 | ||||
| 2026-02-03 | 13F | We Are One Seven, LLC | 5.554 | 7,49 | 674 | 7,00 | ||||
| 2026-02-12 | 13F | Commonwealth Equity Services, Llc | 21.387 | -10,07 | 2.594 | 129.550,00 | ||||
| 2026-02-17 | 13F | Russell Investments Group, Ltd. | 119 | -4,80 | 14 | -6,67 | ||||
| 2026-01-26 | 13F | Cwm, Llc | 4.096 | 0,59 | 0 | |||||
| 2026-01-28 | 13F | Morton Brown Family Wealth, LLC | 1.151 | 0,00 | 140 | -0,71 | ||||
| 2026-02-17 | 13F | Susquehanna International Group, Llp | 9.355 | 14,04 | 1.135 | 13,63 | ||||
| 2026-02-06 | 13F | Pnc Financial Services Group, Inc. | 415 | 0,24 | 50 | 0,00 | ||||
| 2026-02-10 | 13F | Viawealth, Llc | 6.022 | -1,28 | 730 | -1,62 | ||||
| 2026-02-17 | 13F | Royal Bank Of Canada | 64.958 | 147,20 | 7.878 | 146,19 | ||||
| 2026-01-29 | 13F | Quent Capital, LLC | 12 | 0,00 | 1 | 0,00 | ||||
| 2026-02-13 | 13F | Aptus Capital Advisors, LLC | 960 | 0,21 | 116 | 0,00 | ||||
| 2026-01-26 | 13F | Lowery Thomas, Llc | 24.534 | 0,79 | 2.976 | 0,40 | ||||
| 2026-02-17 | 13F | Raymond James Financial Inc | 113.342 | 11,83 | 13.747 | 11,39 | ||||
| 2026-02-17 | 13F | Wiley Bros.-aintree Capital, Llc | 3.681 | -0,94 | 446 | -1,33 | ||||
| 2026-02-09 | 13F | Summit Asset Management, LLC | 7.546 | 0,00 | 915 | -0,33 | ||||
| 2026-01-13 | 13F | Balanced Wealth Group Llc | 2.505 | 0,48 | 305 | 5,92 | ||||
| 2026-02-04 | 13F | Nwam Llc | 1.586 | -7,14 | 205 | -1,91 | ||||
| 2026-01-27 | 13F | PFG Advisors | 23.505 | 0,68 | 2.851 | 0,28 | ||||
| 2026-02-17 | 13F | Creative Planning | 2.323 | 27,08 | 282 | 26,58 | ||||
| 2026-02-24 | 13F | MidFirst Bank | 19.248 | 2.334 | ||||||
| 2026-02-10 | 13F | Parr Mcknight Wealth Management Group, Llc | 0 | -100,00 | 0 | |||||
| 2026-02-11 | 13F | J.w. Cole Advisors, Inc. | 3.111 | -37,74 | 265 | -56,41 | ||||
| 2026-02-13 | 13F | Hurley Capital, LLC | 284 | 0,00 | 34 | 0,00 | ||||
| 2026-01-21 | 13F | Naviter Wealth, LLC | 5.778 | 0,00 | 701 | -0,71 | ||||
| 2026-02-13 | 13F | Mml Investors Services, Llc | 10.704 | 6,85 | 1.298 | 6,48 | ||||
| 2026-01-07 | 13F | Hilltop National Bank | 290 | 0,00 | 35 | 0,00 | ||||
| 2026-01-13 | 13F | CoreCap Advisors, LLC | 1.908 | 67,66 | 231 | 67,39 | ||||
| 2026-02-12 | 13F | Jane Street Group, Llc | 0 | -100,00 | 0 | |||||
| 2026-02-11 | 13F | O'shaughnessy Asset Management, Llc | 1.088 | 0,00 | 132 | -0,76 | ||||
| 2026-02-13 | 13F | Mosaic Family Wealth Partners, Llc | 0 | -100,00 | 0 | |||||
| 2026-02-17 | 13F | Aqr Capital Management Llc | 2.331 | 283 | ||||||
| 2026-02-05 | 13F | Financial Strategies Group, Inc. | 1.781 | 1,54 | 224 | 6,67 | ||||
| 2026-02-19 | 13F | Birchwood Financial Partners, Inc. | 260 | 32 | ||||||
| 2026-01-26 | 13F | Austin Wealth Management, LLC | 1.935 | -0,46 | 244 | 2,97 | ||||
| 2026-01-30 | 13F | Archer Investment Corp | 1.411 | -8,14 | 171 | -8,56 | ||||
| 2026-01-21 | 13F | Indiana Trust & Investment Management CO | 586 | 0,00 | 71 | 0,00 | ||||
| 2026-02-02 | 13F | Fifth Third Bancorp | 1.835 | 0,00 | 223 | -0,45 | ||||
| 2026-02-12 | 13F | Steward Partners Investment Advisory, Llc | 77.304 | 0,11 | 9.376 | -0,29 | ||||
| 2026-03-26 | 13F | Alexander Labrunerie & Co., Inc. | 8.264 | -6,28 | 1.002 | -6,62 | ||||
| 2026-01-12 | 13F | Heartwood Wealth Advisors LLC | 2.006 | 0,00 | 243 | -0,41 | ||||
| 2026-02-02 | 13F | Del-Sette Capital Management, LLC | 44.552 | 2,73 | 5.403 | 2,33 | ||||
| 2026-02-03 | 13F | SBI Securities Co., Ltd. | 64 | 0,00 | 8 | 0,00 | ||||
| 2026-01-27 | 13F | First Horizon Corp | 751 | 0,00 | 91 | 0,00 | ||||
| 2026-02-06 | 13F | IFP Advisors, Inc | 702 | 116,67 | 85 | 117,95 | ||||
| 2026-02-06 | 13F | Creative Financial Designs Inc /adv | 11.217 | -0,63 | 1.360 | -1,02 | ||||
| 2026-02-03 | 13F | Washington Trust Advisors, Inc. | 170 | 0,00 | 21 | 0,00 | ||||
| 2026-01-30 | 13F | Strategic Blueprint, LLC | 8.731 | 137,19 | 1.059 | 136,16 | ||||
| 2026-01-22 | 13F | Glass Jacobson Investment Advisors llc | 137 | 0,00 | 17 | 0,00 | ||||
| 2026-01-20 | 13F | Relyea Zuckerberg Hanson LLC | 2.267 | -6,78 | 275 | -7,09 | ||||
| 2026-02-13 | 13F | Citigroup Inc | 2.275 | -24,64 | 276 | -25,07 | ||||
| 2025-10-15 | 13F | MJT & Associates Financial Advisory Group, Inc. | 0 | -100,00 | 0 | |||||
| 2026-01-09 | 13F | Silverlake Wealth Management Llc | 2.735 | 0,55 | 332 | 0,00 | ||||
| 2026-02-13 | 13F | Morgan Stanley | 260.007 | 3,62 | 31.535 | 3,21 | ||||
| 2025-11-06 | 13F | LexAurum Advisors, LLC | 0 | -100,00 | 0 | |||||
| 2026-02-09 | 13F | Harbour Investments, Inc. | 205 | -13,87 | 25 | -14,29 | ||||
| 2026-02-02 | 13F | LMG Wealth Partners, LLC | 58.708 | -9,74 | 7.120 | -10,09 | ||||
| 2026-02-10 | 13F | Envestnet Asset Management Inc | 43.639 | 11,87 | 5.293 | 11,43 | ||||
| 2026-02-04 | 13F | Meridian Wealth Management, LLC | 3.162 | 0,44 | 384 | 0,00 | ||||
| 2026-02-02 | 13F | Alliance Wealth Advisors, LLC /UT | 59.762 | 1.617,30 | 7.248 | 1.613,48 | ||||
| 2026-03-03 | 13F | EJMK Ventures LLC | 2.167 | 263 | ||||||
| 2026-02-13 | 13F | Alerus Financial Na | 0 | -100,00 | 0 | |||||
| 2026-02-09 | 13F | St. Louis Trust Co | 12.290 | 0,00 | 1.491 | -0,40 | ||||
| 2026-02-13 | 13F | Wells Fargo & Company/mn | 44.747 | -0,94 | 5.427 | -1,33 | ||||
| 2026-01-23 | 13F | Assetmark, Inc | 6 | 0,00 | 1 | |||||
| 2026-02-13 | 13F | Kestra Advisory Services, LLC | 0 | -100,00 | 0 | |||||
| 2026-02-17 | 13F | Private Advisor Group, LLC | 14.981 | -11,77 | 1.817 | -12,14 | ||||
| 2026-02-06 | 13F | Financial Synergies Wealth Advisors, Inc. | 1.725 | 209 |