Grundlæggende statistik
| Institutionelle aktier (lange) | 388.756.643 - 99,36% (ex 13D/G) - change of -68,25MM shares -14,93% MRQ |
| Institutionel værdi (lang) | $ 6.809.739 USD ($1000) |
Institutionelt ejerskab og aktionærer
V.F. Corporation (US:VFC) har 532 institutionelle ejere og aktionærer, der har indsendt 13D/G- eller 13F-formularer til Securities Exchange Commission (SEC). Disse institutioner har i alt 388,756,643 aktier. Største aktionærer omfatter Pnc Financial Services Group, Inc., Dodge & Cox, Vanguard Group Inc, BlackRock, Inc., M&G Plc, Northern Trust Corp, Fmr Llc, State Street Corp, Price T Rowe Associates Inc /md/, and Morgan Stanley .
V.F. Corporation (NYSE:VFC) institutionel ejerskabsstruktur viser aktuelle positioner i virksomheden efter institutioner og fonde, samt seneste ændringer i positionsstørrelse. Større aktionærer kan omfatte individuelle investorer, investeringsforeninger, hedgefonde eller institutioner. Skema 13D angiver, at investoren besidder (eller besidder) mere end 5 % af virksomheden og har til hensigt (eller har til hensigt at) aktivt at forfølge en ændring i forretningsstrategi. Skema 13G indikerer en passiv investering på over 5%.
The share price as of April 24, 2026 is 19,79 / share. Previously, on April 28, 2025, the share price was 11,57 / share. This represents an increase of 71,05% over that period.

Fondens stemningsscore
Fund Sentiment Score (fka Ownership Accumulation Score) finder de aktier, der bliver mest købt af fonde. Det er resultatet af en sofistikeret, multi-faktor kvantitativ model, der identificerer virksomheder med de højeste niveauer af institutionel akkumulering. Scoringsmodellen bruger en kombination af den samlede stigning i oplyste ejere, ændringerne i porteføljeallokeringer i disse ejere og andre målinger. Tallet går fra 0 til 100, hvor højere tal indikerer et højere niveau af akkumulering for sine jævnaldrende, og 50 er gennemsnittet.
Opdateringsfrekvens: Dagligt
Se Ownership Explorer, som giver en liste over højest rangerende virksomheder.
AI+ Ask Fintel’s AI assistant about V.F. Corporation.
Select a question to share a public post with an AI-crafted answer.
Thinking of good questions…
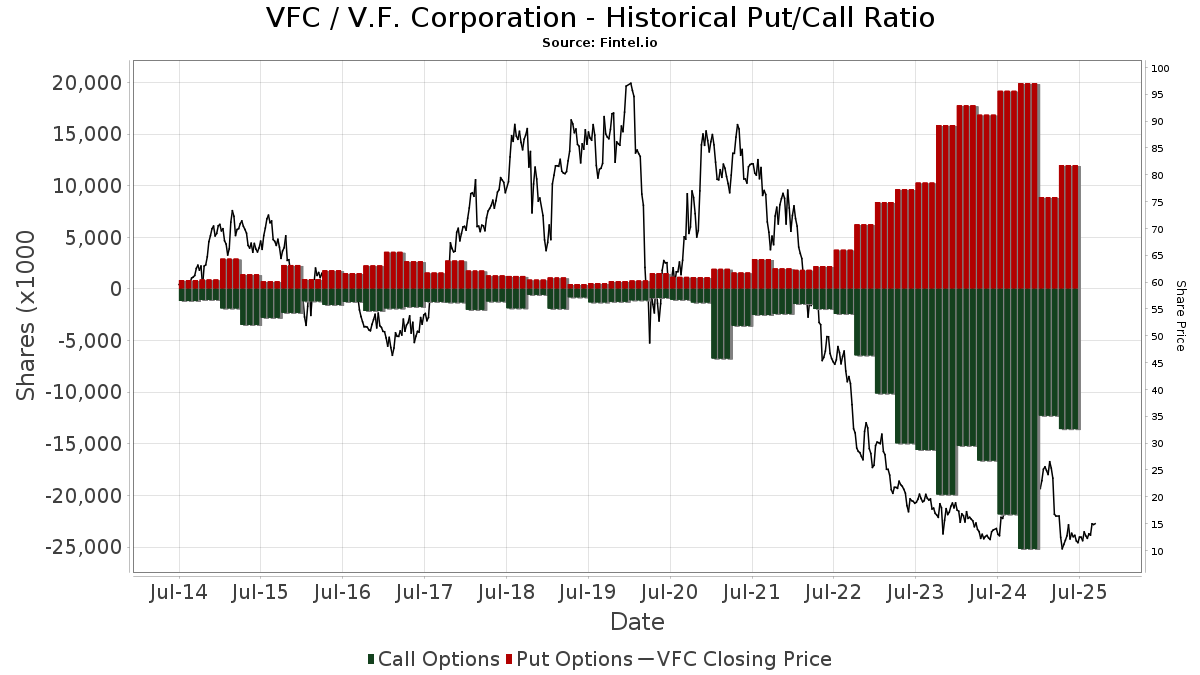
Institutionel Put/Call-forhold
Ud over at indberette standardaktie- og gældsudstedelser skal institutter med mere end 100 mill. aktiver under forvaltning også oplyse deres put- og call-optionsbeholdninger. Da salgsoptioner generelt indikerer negativ stemning, og købsoptioner indikerer positiv stemning, kan vi få en fornemmelse af den overordnede institutionelle stemning ved at plotte forholdet mellem put og kald. Diagrammet til højre viser det historiske put/call-forhold for dette instrument.
Brug af Put/Call Ratio som en indikator for investorernes stemning overvinder en af de vigtigste mangler ved at bruge totalt institutionelt ejerskab, som er, at en betydelig mængde af aktiver under forvaltning investeres passivt for at spore indekser. Passivt forvaltede fonde køber typisk ikke optioner, så indikatoren for put/call-forholdet følger mere nøje følelsen af aktivt forvaltede fonde.
13D/G-arkivering
Vi præsenterer 13D/G ansøgninger separat fra 13F ansøgninger på grund af den forskellige behandling af SEC. 13D/G-ansøgninger kan indgives af grupper af investorer (med én ledende), hvorimod 13F-ansøgninger ikke kan. Dette resulterer i situationer, hvor en investor kan indsende en 13D/G, der rapporterer én værdi for de samlede aktier (der repræsenterer alle de aktier, der ejes af investorgruppen), men derefter indsender en 13F, der rapporterer en anden værdi for de samlede aktier (der udelukkende repræsenterer deres egne) ejendomsret). Det betyder, at aktieejerskab af 13D/G-arkiver og 13F-arkiveringer ofte ikke er direkte sammenlignelige, så vi præsenterer dem separat.
Bemærk: Fra den 16. maj 2021 viser vi ikke længere ejere, der ikke har indsendt en 13D/G inden for det seneste år. Tidligere viste vi den fulde historie af 13D/G-arkiver. Generelt skal enheder, der er forpligtet til at indgive 13D/G-ansøgninger, indgive mindst årligt, før de indsender en afsluttende ansøgning. Dog forlader fonde nogle gange positioner uden at indsende en afsluttende ansøgning (dvs. de afvikler), så visning af den fulde historie resulterede nogle gange i forvirring om det nuværende ejerskab. For at undgå forvirring viser vi nu kun 'aktuelle' ejere - det vil sige - ejere, der har anmeldt inden for det seneste år.
Upgrade to unlock premium data.
| Fil dato | Form | Investor | Forrige Aktier |
Seneste Aktier |
Δ Aktier (Procent) |
Ejendomsret (Procent) |
Δ Ejerskab (Procent) |
|
|---|---|---|---|---|---|---|---|---|
| 2026-02-11 | M&G Plc | 20,705,817 | 25,778,975 | 24.50 | 6.60 | 24.29 | ||
| 2025-10-31 | VANGUARD GROUP INC | 41,071,730 | 37,251,167 | -9.30 | 9.53 | -9.75 | ||
| 2025-04-17 | BlackRock, Inc. | 42,026,014 | 28,906,748 | -31.22 | 7.40 | -31.48 |
13F og NPORT arkivering
Detaljer om 13F-arkivering er gratis. Detaljer om NP-ansøgninger kræver et premium-medlemskab. Grønne rækker angiver nye positioner. Røde rækker angiver lukkede positioner. Klik på linket ikon for at se den fulde transaktionshistorik.
Opgrader
for at låse premium-data op og eksportere til Excel ![]() .
.
| Fil dato | Kilde | Investor | Type | Gennemsnitlig pris (Øst) |
Aktier | Δ Aktier (%) |
Rapporteret Værdi ($1000) |
Δ Værdi (%) |
Port Alloc (%) |
|
|---|---|---|---|---|---|---|---|---|---|---|
| 2026-02-13 | 13F | Alberta Investment Management Corp | 96.200 | 1.739 | ||||||
| 2026-04-17 | 13F | Kennebec Savings Bank | 0 | -100,00 | 0 | |||||
| 2026-02-13 | 13F | Manufacturers Life Insurance Company, The | 0 | -100,00 | 0 | |||||
| 2026-02-13 | 13F | Treasurer of the State of North Carolina | 147.122 | -6,81 | 3 | 0,00 | ||||
| 2026-02-12 | 13F | Ci Investments Inc. | 0 | -100,00 | 0 | |||||
| 2026-01-27 | 13F | Lecap Asset Management Ltd | 25.878 | -6,14 | 468 | 17,63 | ||||
| 2026-02-02 | 13F | Millstone Evans Group, LLC | 243 | 0,00 | 4 | 33,33 | ||||
| 2026-02-13 | 13F | Dymon Asia Capital (singapore) Pte. Ltd. | 0 | -100,00 | 0 | |||||
| 2026-04-22 | 13F | Parcion Private Wealth LLC | 13.393 | 228 | ||||||
| 2026-02-12 | 13F | Jane Street Group, Llc | 368.589 | 135,61 | 6.664 | 195,26 | ||||
| 2026-02-12 | 13F | Jane Street Group, Llc | Call | 927.000 | 48,32 | 16.760 | 85,85 | |||
| 2026-04-10 | 13F | Marshall Financial Group LLC | 11.523 | 196 | ||||||
| 2026-02-12 | 13F | Jane Street Group, Llc | Put | 1.805.700 | 64,23 | 32.647 | 105,78 | |||
| 2026-02-05 | 13F | Peak Asset Management, LLC | 13.235 | 0,00 | 239 | 25,79 | ||||
| 2026-02-11 | 13F | Modus Advisors, LLC | 19.954 | -65,62 | 361 | -56,99 | ||||
| 2026-02-05 | 13F | Peak Asset Management, LLC | Call | 22 | -25,00 | |||||
| 2025-11-12 | 13F | CIBC Bancorp USA Inc. | 14.452 | 209 | ||||||
| 2026-02-23 | 13F | Beaird Harris Wealth Management, LLC | 2.186 | 0,00 | 40 | 25,81 | ||||
| 2026-02-23 | 13F | Mv Capital Management, Inc. | 6 | 500,00 | 0 | |||||
| 2026-02-18 | 13F | EP Wealth Advisors, Inc. | 10.082 | 182 | ||||||
| 2026-04-13 | 13F | Wolff Wiese Magana Llc | 1.321 | 0,00 | 22 | -4,35 | ||||
| 2026-02-13 | 13F | Public Employees Retirement Association Of Colorado | 34.350 | 0,00 | 1 | |||||
| 2026-02-13 | 13F | Citigroup Inc | 1.292.094 | 19,07 | 23.361 | 49,20 | ||||
| 2026-02-17 | 13F | Wealth Watch Advisors, INC | 61 | 0,00 | 1 | |||||
| 2026-02-17 | 13F | Shelton Capital Management | 10.943 | -8,92 | 198 | 13,87 | ||||
| 2026-02-13 | 13F | Verition Fund Management LLC | 244.662 | -35,59 | 4.423 | -19,30 | ||||
| 2026-02-13 | 13F | Citigroup Inc | Put | 60.000 | 0,00 | 1.085 | 25,32 | |||
| 2026-02-17 | 13F | Trexquant Investment LP | 44.893 | 812 | ||||||
| 2026-01-29 | 13F | Sanctuary Advisors, LLC | 11.788 | -24,29 | 213 | -11,62 | ||||
| 2026-02-13 | 13F | Neo Ivy Capital Management | 287.061 | 61,54 | 5.190 | 102,42 | ||||
| 2026-02-17 | 13F | Engineers Gate Manager LP | 15.391 | 278 | ||||||
| 2026-02-10 | 13F | Bnp Paribas Arbitrage, Sa | 101.639 | -44,06 | 1.838 | -29,91 | ||||
| 2026-02-17 | 13F | FIL Ltd | 295.344 | -37,38 | 5.340 | -21,54 | ||||
| 2026-02-13 | 13F | Umb Bank N A/mo | 365.256 | 0,01 | 6.604 | 25,32 | ||||
| 2025-11-06 | 13F | Abich Financial Wealth Management LLC | 0 | -100,00 | 0 | |||||
| 2026-01-30 | 13F | Mitsubishi UFJ Trust & Banking Corp | 124.048 | 1,24 | 2.243 | 26,81 | ||||
| 2026-02-12 | 13F | BlackRock, Inc. | 29.364.704 | -2,90 | 530.914 | 21,67 | ||||
| 2026-02-13 | 13F | Commerce Bank | 15.304 | 0,00 | 277 | 25,45 | ||||
| 2026-02-17 | 13F | Utah Retirement Systems | 18.561 | 0,00 | 336 | 25,47 | ||||
| 2025-11-12 | 13F | HAP Trading, LLC | Call | 25.900 | 18 | |||||
| 2026-04-08 | 13F | Canandaigua National Corp | 0 | -100,00 | 0 | |||||
| 2026-02-13 | 13F | Walleye Trading LLC | Put | 3.064.900 | 413,21 | 55.413 | 543,07 | |||
| 2026-02-05 | 13F | HFM Investment Advisors, LLC | 17 | 0,00 | 0 | |||||
| 2026-02-13 | 13F | Walleye Trading LLC | Call | 625.700 | 241,91 | 11.313 | 328,48 | |||
| 2026-02-10 | 13F | Sivia Capital Partners, LLC | 17.773 | 321 | ||||||
| 2026-02-13 | 13F | Walleye Trading LLC | 845.589 | 260,77 | 15.288 | 352,04 | ||||
| 2026-02-17 | 13F | Mercer Global Advisors Inc /adv | 87.964 | 100,73 | 1.590 | 151,58 | ||||
| 2026-02-12 | 13F | MetLife Investment Management, LLC | 160.748 | -4,90 | 2.906 | 19,15 | ||||
| 2026-04-14 | 13F | West Branch Capital LLC | 318 | 0,00 | 5 | 0,00 | ||||
| 2026-02-17 | 13F | Holocene Advisors, LP | 0 | -100,00 | 0 | |||||
| 2026-02-06 | 13F | Gsa Capital Partners Llp | 0 | -100,00 | 0 | |||||
| 2026-02-13 | 13F | Walleye Capital LLC | Put | 66.600 | -36,27 | 1.204 | -20,11 | |||
| 2026-02-13 | 13F | JustInvest LLC | 51.408 | 29,96 | 929 | 62,98 | ||||
| 2026-02-13 | 13F | Dodge & Cox | 40.679.850 | -0,73 | 735.492 | 24,38 | ||||
| 2026-02-13 | 13F | Walleye Capital LLC | 49.536 | 142,02 | 896 | 203,39 | ||||
| 2026-02-05 | 13F | 1620 Investment Advisors, Inc. | 20.086 | -8,30 | 363 | 14,87 | ||||
| 2026-02-13 | 13F | Walleye Capital LLC | Call | 115.500 | 206,37 | 2.088 | 283,82 | |||
| 2026-02-12 | 13F | Quadrant Capital Group Llc | 1.721 | -0,52 | 31 | 29,17 | ||||
| 2026-04-24 | 13F | Yousif Capital Management, Llc | 107.397 | -4,28 | 1.825 | -12,81 | ||||
| 2026-02-09 | 13F | Huntington National Bank | 17.196 | -0,15 | 311 | 25,00 | ||||
| 2026-02-13 | 13F | Sei Investments Co | 188.579 | 15,30 | 3.410 | 44,45 | ||||
| 2026-04-13 | 13F | True Wealth Design, LLC | 4.177 | 159,44 | 71 | 141,38 | ||||
| 2026-02-02 | 13F | Danske Bank A/s | 1.900 | 0,00 | 34 | 25,93 | ||||
| 2026-02-17 | 13F | Amundi | 49.232 | 114,60 | 890 | 168,07 | ||||
| 2026-04-14 | 13F | Thurston, Springer, Miller, Herd & Titak, Inc. | 388 | -9,56 | 7 | -14,29 | ||||
| 2026-02-13 | 13F | Kestra Advisory Services, LLC | 12.735 | 230 | ||||||
| 2025-11-13 | 13F | Qsemble Capital Management, LP | 0 | -100,00 | 0 | |||||
| 2026-02-17 | 13F | Brevan Howard Capital Management LP | 0 | -100,00 | 0 | |||||
| 2026-04-16 | 13F | Beese Fulmer Investment Management, Inc. | 12.113 | 206 | ||||||
| 2026-02-13 | 13F | MAI Capital Management | 1.674 | -65,12 | 30 | -56,52 | ||||
| 2026-02-11 | 13F | LPL Financial LLC | 600.702 | 23,25 | 10.861 | 54,41 | ||||
| 2026-02-12 | 13F | Hrt Financial Lp | 70.400 | 1 | ||||||
| 2026-02-17 | 13F | Masters Capital Management Llc | 0 | -100,00 | 0 | |||||
| 2026-02-17 | 13F | Masters Capital Management Llc | Call | 0 | -100,00 | 0 | ||||
| 2026-04-07 | 13F | Central Pacific Bank - Trust Division | 12.000 | 0,00 | 204 | -6,02 | ||||
| 2026-02-13 | 13F | Boston Partners | 0 | -100,00 | 0 | |||||
| 2026-02-20 | 13F | Sunbelt Securities, Inc. | 114 | 280,00 | 2 | |||||
| 2026-02-13 | 13F | Wells Fargo & Company/mn | 2.329.051 | -32,87 | 42.109 | -15,89 | ||||
| 2026-02-13 | 13F | Wells Fargo & Company/mn | Put | 449.200 | 8.122 | |||||
| 2026-02-12 | 13F | Ensign Peak Advisors, Inc | 18.737 | -68,92 | 339 | -61,10 | ||||
| 2026-02-14 | 13F | Rockefeller Capital Management L.P. | 16.323 | -1,88 | 295 | 22,92 | ||||
| 2026-04-08 | 13F | NorthCrest Asset Manangement, LLC | 38.472 | 69,07 | 649 | 51,64 | ||||
| 2026-04-10 | 13F | Perigon Wealth Management, LLC | 24.612 | 2,86 | 418 | -3,24 | ||||
| 2026-04-23 | 13F | Farmers & Merchants Investments Inc | 5.794 | -0,17 | 98 | -5,77 | ||||
| 2025-11-14 | 13F | Worldquant Millennium Advisors Llc | 0 | -100,00 | 0 | |||||
| 2026-02-02 | 13F | Principal Financial Group Inc | 706.713 | -3,22 | 12.777 | 21,27 | ||||
| 2026-02-17 | 13F | Janus Henderson Group Plc | 147.200 | 0,00 | 2.661 | 25,29 | ||||
| 2026-02-11 | 13F | Parallel Advisors, LLC | 2.106 | 9,69 | 38 | 40,74 | ||||
| 2026-02-10 | 13F | Collar Capital Management, LLC | 114.755 | 0,51 | 2.075 | 25,93 | ||||
| 2026-04-15 | 13F | QSM Asset Management Ltd | 279.957 | -19,17 | 4.661 | -25,56 | ||||
| 2026-02-05 | 13F | Bessemer Group Inc | 1.101 | -77,65 | 0 | |||||
| 2026-02-17 | 13F | Captrust Financial Advisors | 90.873 | 28,00 | 1.643 | 60,35 | ||||
| 2026-02-10 | 13F | Rothschild Investment Llc | 3.567 | -4,80 | 64 | 18,52 | ||||
| 2025-11-14 | 13F | Teza Capital Management LLC | 0 | -100,00 | 0 | -100,00 | ||||
| 2026-02-14 | 13F | Whipplewood Advisors, LLC | 21.125 | 0,00 | 382 | 25,33 | ||||
| 2026-02-03 | 13F | Mitsubishi UFJ Kokusai Asset Management Co., Ltd. | 1.339 | -68,14 | 24 | -60,00 | ||||
| 2026-02-11 | 13F | Manchester Capital Management LLC | 83 | 2 | ||||||
| 2026-04-07 | 13F | Farther Finance Advisors, LLC | 10.381 | 37,99 | 176 | 28,68 | ||||
| 2026-02-13 | 13F | Rhumbline Advisers | 871.809 | -2,69 | 15.762 | 21,92 | ||||
| 2026-04-17 | 13F | Community Bank of Raymore | 42.320 | 4,34 | 719 | -1,91 | ||||
| 2026-01-30 | 13F | Torren Management, LLC | 18 | 0 | ||||||
| 2026-02-12 | 13F | Wealthspire Advisors, LLC | 0 | -100,00 | 0 | |||||
| 2025-11-14 | 13F | Capstone Investment Advisors, Llc | 27.906 | 403 | ||||||
| 2026-04-23 | 13F | Broad Peak Investment Advisers Pte Ltd | 177.000 | 3.007 | ||||||
| 2026-02-12 | 13F | Principal Securities, Inc. | 0 | -100,00 | 0 | -100,00 | ||||
| 2026-02-17 | 13F | Ameriprise Financial Inc | 726.947 | -5,77 | 13.143 | 18,07 | ||||
| 2026-04-03 | 13F | Investors Research Corp | 21.660 | -3,67 | 368 | -9,36 | ||||
| 2026-04-15 | 13F | Activest Wealth Management | 887 | 691,96 | 15 | 650,00 | ||||
| 2026-02-13 | 13F | Great West Life Assurance Co /can/ | 222.744 | -17,22 | 4 | 33,33 | ||||
| 2026-02-18 | 13F | State of Tennessee, Treasury Department | 124.661 | -4,11 | 2.442 | 30,24 | ||||
| 2026-01-28 | 13F | Ai Financial Services Llc | 0 | -100,00 | 0 | |||||
| 2026-02-12 | 13F | State Board Of Administration Of Florida Retirement System | 319.344 | -2,97 | 5.774 | 21,59 | ||||
| 2026-04-14 | 13F | Nbc Securities, Inc. | 1.084 | 0,00 | 18 | -5,26 | ||||
| 2026-02-17 | 13F | Citadel Advisors Llc | Put | 2.273.700 | 126,33 | 41.108 | 183,58 | |||
| 2026-02-17 | 13F | Citadel Advisors Llc | 5.809.310 | 339,87 | 105.032 | 451,15 | ||||
| 2026-04-21 | 13F | Maseco Llp | 36 | 0,00 | 1 | |||||
| 2026-02-06 | 13F | Covestor Ltd | 747 | 40,41 | 0 | |||||
| 2025-11-03 | 13F | Scion Asset Management, LLC | Call | 0 | -100,00 | 0 | -100,00 | |||
| 2026-02-02 | 13F | Truist Financial Corp | 39.741 | -17,23 | 719 | 3,76 | ||||
| 2026-02-10 | 13F/A | Northwestern Mutual Wealth Management Co | 11.837 | -17,94 | 214 | 2,88 | ||||
| 2026-01-30 | 13F | New York State Teachers Retirement System | 312.209 | 0,00 | 6 | 25,00 | ||||
| 2026-04-24 | 13F | Oakworth Capital, Inc. | 1.790 | 0,00 | 30 | -6,25 | ||||
| 2026-01-28 | 13F | Salomon & Ludwin, LLC | 301 | 0,00 | 6 | 25,00 | ||||
| 2026-04-08 | 13F | DiNuzzo Private Wealth, Inc. | 39 | 18,18 | 1 | |||||
| 2026-02-13 | 13F | Bridgewater Associates, LP | 527.372 | 452,01 | 9.535 | 591,87 | ||||
| 2026-02-02 | 13F | Cornerstone Planning Group LLC | 0 | -100,00 | 0 | |||||
| 2026-02-13 | 13F | Arkadios Wealth Advisors | 72.368 | -4,22 | 1.308 | 20,00 | ||||
| 2026-02-18 | 13F | GWM Advisors LLC | 2.356 | -3,05 | 43 | 20,00 | ||||
| 2026-03-31 | 13F | Employees Provident Fund Board | 0 | -100,00 | 0 | -100,00 | ||||
| 2026-04-22 | 13F | Stone House Investment Management, LLC | 108 | 2 | ||||||
| 2025-11-14 | 13F | Bridgefront Capital, LLC | 0 | -100,00 | 0 | |||||
| 2025-11-13 | 13F | Entropy Technologies, LP | 0 | -100,00 | 0 | -100,00 | ||||
| 2026-04-13 | 13F | Robinhood Asset Management, LLC | 309.576 | 5.260 | ||||||
| 2026-01-20 | 13F | Nvwm, Llc | 48 | 0,00 | 1 | |||||
| 2025-11-13 | 13F | Quantitative Investment Management, LLC | 0 | -100,00 | 0 | |||||
| 2026-02-17 | 13F | Gladstone Institutional Advisory LLC | 20.759 | 1,21 | 375 | 27,12 | ||||
| 2026-01-30 | 13F | Bogart Wealth, LLC | 80 | -30,43 | 1 | 0,00 | ||||
| 2026-02-05 | 13F | Thrivent Financial For Lutherans | 102.889 | -11,61 | 2 | 0,00 | ||||
| 2026-01-26 | 13F | Riverview Trust Co | 50 | 0,00 | 1 | |||||
| 2026-01-28 | 13F | Arizona State Retirement System | 92.824 | -5,31 | 1.678 | 18,67 | ||||
| 2026-04-06 | 13F | GAMMA Investing LLC | 11.656 | 6,09 | 198 | 0,00 | ||||
| 2026-02-11 | 13F | Deseret Mutual Benefit Administrators | 5.027 | 6,10 | 91 | 32,35 | ||||
| 2026-02-17 | 13F | Citadel Advisors Llc | Call | 1.156.000 | 39,50 | 20.900 | 74,78 | |||
| 2025-11-14 | 13F | Goldman Sachs Group Inc | Put | 0 | -100,00 | 0 | -100,00 | |||
| 2025-11-06 | 13F | New York Life Investment Management Llc | 0 | -100,00 | 0 | -100,00 | ||||
| 2026-02-17 | 13F | Paloma Partners Management Co | Call | 427.500 | 7.729 | |||||
| 2026-02-06 | 13F | Larson Financial Group LLC | 980 | -78,74 | 18 | -74,24 | ||||
| 2025-11-13 | 13F | Quadrature Capital Ltd | 0 | -100,00 | 0 | -100,00 | ||||
| 2026-04-17 | 13F | Vermillion Wealth Management, Inc. | 13 | 0 | ||||||
| 2026-01-27 | 13F | BankPlus Trust Department | 185 | 0,00 | 3 | 50,00 | ||||
| 2026-02-11 | 13F | TCTC Holdings, LLC | 800 | 0,00 | 14 | 27,27 | ||||
| 2026-02-09 | 13F | Atlantic Trust, LLC | 448 | 92,27 | 8 | 166,67 | ||||
| 2026-02-17 | 13F | Polymer Capital Management (US) LLC | 0 | -100,00 | 0 | |||||
| 2026-02-10 | 13F | Basepoint Wealth LLC | 41 | 1 | ||||||
| 2026-04-20 | 13F | Ritholtz Wealth Management | 17.755 | 29,05 | 302 | 21,37 | ||||
| 2026-04-07 | 13F | First Financial Corp /in/ | 800 | 0,00 | 14 | -7,14 | ||||
| 2025-11-14 | 13F | Quarry LP | 0 | -100,00 | 0 | -100,00 | ||||
| 2026-04-20 | 13F | Jfs Wealth Advisors, Llc | 190 | 7,95 | 3 | 0,00 | ||||
| 2026-02-06 | 13F | EverSource Wealth Advisors, LLC | 6.915 | 151,64 | 125 | 220,51 | ||||
| 2026-02-12 | 13F | Skopos Labs, Inc. | 18.535 | 23,01 | 337 | 54,84 | ||||
| 2026-02-13 | 13F | Change Path, LLC | 18.183 | 329 | ||||||
| 2026-02-10 | 13F | Mutual Of America Capital Management Llc | 136.592 | -9,86 | 2.470 | 12,95 | ||||
| 2026-03-31 | 13F | Sankala Group LLC | 28 | 0,00 | 0 | |||||
| 2026-04-09 | 13F | Tompkins Financial Corp | 43 | 0,00 | 1 | |||||
| 2026-02-13 | 13F | Police & Firemen's Retirement System of New Jersey | 151.177 | -3,35 | 2.733 | 21,09 | ||||
| 2025-11-12 | 13F | Aster Capital Management (DIFC) Ltd | 0 | -100,00 | 0 | |||||
| 2026-02-11 | 13F | Group One Trading, L.p. | Put | 393.500 | 90,00 | 7.114 | 138,09 | |||
| 2026-02-06 | 13F | GPS Wealth Strategies Group, LLC | 0 | -100,00 | 0 | |||||
| 2026-02-11 | 13F | Group One Trading, L.p. | 283.964 | -7,53 | 5.134 | 15,87 | ||||
| 2026-02-17 | 13F | Boreal Capital Management LLC | 200 | 0,00 | 4 | 50,00 | ||||
| 2025-11-14 | 13F | Texas Permanent School Fund | 0 | -100,00 | 0 | |||||
| 2026-02-11 | 13F | Group One Trading, L.p. | Call | 617.500 | 45,26 | 11.164 | 82,00 | |||
| 2026-01-21 | 13F | Westfuller Advisors, LLC | 56 | 1,82 | 1 | |||||
| 2026-02-26 | 13F | Anchor Investment Management, LLC | 16 | 0,00 | 0 | |||||
| 2026-02-10 | 13F | New Mexico Educational Retirement Board | 66.300 | 0,00 | 1 | |||||
| 2026-02-04 | 13F | Summit Wealth Group Llc / Co | 0 | -100,00 | 0 | -100,00 | ||||
| 2026-04-20 | 13F | Fiduciary Alliance LLC | 589.793 | -8,91 | 11.584 | -1,05 | ||||
| 2026-02-17 | 13F | Cetera Investment Advisers | 46.243 | -15,59 | 836 | 5,82 | ||||
| 2026-02-19 | 13F | Invesco Ltd. | 1.089.114 | 8,71 | 19.691 | 36,20 | ||||
| 2026-02-13 | 13F | Pinnacle Wealth Planning Services, Inc. | 36 | 1 | ||||||
| 2026-02-17 | 13F | Millennium Management Llc | Put | 200.000 | -6,10 | 3.616 | 17,67 | |||
| 2026-02-17 | 13F | Millennium Management Llc | Call | 190.000 | 89,24 | 3.435 | 137,22 | |||
| 2026-02-12 | 13F | New York State Common Retirement Fund | 540.861 | 0,79 | 9.779 | 26,28 | ||||
| 2026-01-16 | 13F | Piscataqua Savings Bank | 0 | -100,00 | 0 | -100,00 | ||||
| 2026-02-10 | 13F | Norges Bank | 4.209.501 | 76.108 | ||||||
| 2026-04-24 | 13F | Retirement Systems of Alabama | 402.922 | 2,29 | 6.846 | -3,88 | ||||
| 2026-02-13 | 13F | Mariner, LLC | 213.636 | 97,96 | 3.867 | 148,30 | ||||
| 2026-01-27 | 13F | Duncker Streett & Co Inc | 0 | -100,00 | 0 | |||||
| 2026-01-30 | 13F/A | M&t Bank Corp | 13.743 | 11,93 | 248 | 40,11 | ||||
| 2026-04-14 | 13F | Bay Harbor Wealth Management, LLC | 56 | 93,10 | 1 | |||||
| 2026-04-21 | 13F | Pallas Capital Advisors LLC | 33.152 | 121,89 | 563 | 108,52 | ||||
| 2026-02-11 | 13F | Buckingham Strategic Partners | 22.917 | 49,73 | 414 | 86,49 | ||||
| 2026-01-28 | 13F | Chicago Partners Investment Group LLC | 21.565 | 109,76 | 426 | 185,23 | ||||
| 2026-04-23 | 13F | Oppenheimer & Co Inc | 13.975 | -1,41 | 237 | -7,42 | ||||
| 2026-02-23 | 13F | Wealth Preservation Advisors, LLC | 15 | 0,00 | 0 | |||||
| 2026-02-17 | 13F | MIRAE ASSET GLOBAL ETFS HOLDINGS Ltd. | 27.890 | -8,36 | 504 | 14,81 | ||||
| 2026-04-13 | 13F | Mather Group, Llc. | 20 | 0 | ||||||
| 2026-01-30 | 13F | Pekin Hardy Strauss, Inc. | 161.861 | -31,06 | 2.926 | -13,61 | ||||
| 2026-02-17 | 13F | Bank Of America Corp /de/ | 1.052.131 | -41,95 | 19.023 | -27,26 | ||||
| 2026-02-09 | 13F | Hantz Financial Services, Inc. | 14.397 | 124,29 | 0 | |||||
| 2025-11-14 | 13F | Mount Yale Investment Advisors, LLC | 0 | -100,00 | 0 | -100,00 | ||||
| 2026-01-16 | 13F | FNY Investment Advisers, LLC | 0 | -100,00 | 0 | |||||
| 2026-02-09 | 13F | Geode Capital Management, Llc | 5.968.942 | -0,02 | 107.940 | 25,27 | ||||
| 2026-02-02 | 13F | Sachetta, LLC | 152 | 0,00 | 3 | 0,00 | ||||
| 2026-02-17 | 13F | Canada Pension Plan Investment Board | 1.832.600 | 4,57 | 33.133 | 31,02 | ||||
| 2026-02-13 | 13F | Centiva Capital, LP | 114.900 | 2.077 | ||||||
| 2026-02-17 | 13F | 9823 Capital, L.P. | 10.112 | 183 | ||||||
| 2026-02-10 | 13F | Bruce G. Allen Investments, LLC | 18 | 0,00 | 0 | |||||
| 2026-02-13 | 13F | Centiva Capital, LP | Put | 484.600 | 8.762 | |||||
| 2026-02-12 | 13F | Xponance, Inc. | 33.322 | -16,45 | 602 | 4,70 | ||||
| 2026-02-17 | 13F | Man Group plc | 300.642 | 1.018,29 | 5.436 | 1.304,39 | ||||
| 2026-02-17 | 13F | Engaged Capital LLC | 5.306.548 | -9,48 | 95.942 | 13,42 | ||||
| 2026-04-20 | 13F | Compass Wealth Management LLC | 618.821 | 3,09 | 10.514 | -3,13 | ||||
| 2026-02-17 | 13F | Bank Of America Corp /de/ | Call | 0 | -100,00 | 0 | -100,00 | |||
| 2026-02-17 | 13F | Bank Of America Corp /de/ | Put | 0 | -100,00 | 0 | -100,00 | |||
| 2026-04-15 | 13F | Fortitude Family Office, LLC | 210 | 275,00 | 4 | 200,00 | ||||
| 2026-02-10 | 13F | Quantbot Technologies LP | 103.632 | -34,01 | 1.874 | -17,34 | ||||
| 2026-02-18 | 13F | Beacon Pointe Advisors, LLC | 21.431 | 0,29 | 387 | 25,65 | ||||
| 2026-02-04 | 13F | Pacer Advisors, Inc. | 65.611 | 51,70 | 1.186 | 90,06 | ||||
| 2026-02-12 | 13F | California Public Employees Retirement System | 462.555 | -22,83 | 8.363 | -3,31 | ||||
| 2026-04-17 | 13F | Krilogy Financial LLC | 34.923 | 9,74 | 703 | 10,38 | ||||
| 2026-01-16 | 13F | Trust Co Of Vermont | 211 | 4 | ||||||
| 2026-02-12 | 13F | SWAN Capital LLC | 885 | -62,11 | 16 | -51,52 | ||||
| 2026-03-20 | 13F/A | Hsbc Holdings Plc | 30.570 | -1,77 | 553 | 23,71 | ||||
| 2025-11-12 | 13F | Park Square Financial Group, LLC | 0 | -100,00 | 0 | |||||
| 2026-02-10 | 13F | Measured Wealth Private Client Group, LLC | 47 | 0,00 | 1 | |||||
| 2026-02-11 | 13F | Allianz Asset Management GmbH | 1.819.714 | 37,22 | 32.900 | 71,94 | ||||
| 2026-02-13 | 13F | Saxon Interests, Inc. | 45.568 | 129,69 | 824 | 174,33 | ||||
| 2026-02-17 | 13F | American Trust Investment Advisors, LLC | 69.779 | 1,44 | 1.262 | 27,12 | ||||
| 2026-04-21 | 13F | GHP Investment Advisors, Inc. | 337 | 11,59 | 6 | 0,00 | ||||
| 2026-02-13 | 13F | Y-Intercept (Hong Kong) Ltd | 319.238 | 6,16 | 5.772 | 33,00 | ||||
| 2026-01-29 | 13F | China Universal Asset Management Co., Ltd. | 24.906 | 0,00 | 450 | 25,35 | ||||
| 2026-02-09 | 13F | Rit Capital Partners Plc | 0 | -100,00 | 0 | |||||
| 2026-01-23 | 13F | Financial Advisory Partners, Llc | 35.503 | -3,27 | 642 | 21,17 | ||||
| 2025-11-10 | 13F | Citigroup Inc | Call | 0 | -100,00 | 0 | -100,00 | |||
| 2026-02-04 | 13F | Securian Asset Management, Inc | 23.919 | -2,67 | 432 | 22,03 | ||||
| 2025-11-13 | 13F | Connor, Clark & Lunn Investment Management Ltd. | 0 | -100,00 | 0 | |||||
| 2025-11-14 | 13F | Qube Research & Technologies Ltd | 0 | -100,00 | 0 | -100,00 | ||||
| 2025-11-10 | 13F | Optiver Holding B.V. | 0 | -100,00 | 0 | |||||
| 2026-04-17 | 13F | Bell Investment Advisors, Inc | 128 | 0,00 | 2 | 0,00 | ||||
| 2026-02-10 | 13F | Peapack Gladstone Financial Corp | 0 | -100,00 | 0 | |||||
| 2025-11-10 | 13F | Jupiter Asset Management Ltd | 0 | -100,00 | 0 | -100,00 | ||||
| 2026-02-11 | 13F | Capital World Investors | 2.380.695 | 0,00 | 43.043 | 25,29 | ||||
| 2026-02-13 | 13F | Neuberger Berman Group LLC | 15.954 | 10,60 | 288 | 38,46 | ||||
| 2026-04-17 | 13F | CENTRAL TRUST Co | 1.300 | 116,67 | 22 | 120,00 | ||||
| 2026-02-09 | 13F | New Age Alpha Advisors, LLC | 47.585 | -2,91 | 860 | 21,64 | ||||
| 2026-02-13 | 13F | Integrated Wealth Concepts LLC | 42.832 | -2,95 | 774 | 21,70 | ||||
| 2026-01-29 | 13F | Vanguard Group Inc | 36.871.184 | -1,02 | 666.631 | 24,01 | ||||
| 2026-02-05 | 13F | North Dakota State Investment Board | 12.308 | 223 | ||||||
| 2026-02-19 | 13F | CI Private Wealth, LLC | 43.142 | 63,60 | 783 | 106,05 | ||||
| 2026-02-17 | 13F | Lighthouse Investment Partners, LLC | 15.855 | 287 | ||||||
| 2026-04-09 | 13F | Moody National Bank Trust Division | 73.901 | -58,72 | 1.256 | -61,22 | ||||
| 2026-01-12 | 13F | Rialto Wealth Management, LLC | 114 | 20,00 | 2 | 100,00 | ||||
| 2026-02-18 | 13F | Caitlin John, LLC | 107 | 0,00 | 2 | 0,00 | ||||
| 2026-02-13 | 13F | Arete Wealth Advisors, LLC | 0 | -100,00 | 0 | |||||
| 2026-02-10 | 13F | Goldman Sachs Group Inc | Call | 1.049.100 | 23,42 | 18.968 | 54,64 | |||
| 2026-02-13 | 13F | Kilter Group LLC | 52 | -13,33 | 1 | |||||
| 2026-02-09 | 13F | Optimize Financial Inc | 40.379 | 1,46 | 730 | 27,18 | ||||
| 2026-01-26 | 13F | Great Hill Capital LLC | Call | 3.406.200 | 2,50 | 76.084 | 58,66 | |||
| 2026-04-24 | 13F | Boston Trust Walden Corp | 11.660 | 0,00 | 198 | -5,71 | ||||
| 2026-01-26 | 13F | Great Hill Capital LLC | 568.627 | 25,12 | 10.281 | 56,78 | ||||
| 2026-02-05 | 13F | Elyxium Wealth, LLC | 124 | 2 | ||||||
| 2026-02-10 | 13F | Goldman Sachs Group Inc | 1.299.154 | -4,10 | 23.489 | 20,16 | ||||
| 2026-01-26 | 13F | Private Trust Co Na | 79 | 0,00 | 1 | 0,00 | ||||
| 2026-02-17 | 13F | Creative Planning | 140.514 | 35,41 | 2.540 | 69,67 | ||||
| 2026-01-28 | 13F | Geneos Wealth Management Inc. | 339 | 0,30 | 6 | 50,00 | ||||
| 2026-02-06 | 13F | Addison Advisors LLC | 816 | 0,00 | 15 | 27,27 | ||||
| 2026-02-17 | 13F | Balyasny Asset Management Llc | 201.190 | 3.638 | ||||||
| 2026-04-23 | 13F | Farmers & Merchants Trust Co of Chambersburg PA | 100 | 0,00 | 0 | |||||
| 2026-02-13 | 13F | BNP Paribas Asset Management Holding S.A. | 4.943 | 44,87 | 0 | |||||
| 2026-02-17 | 13F | Alphadyne Asset Management, LLC | Call | 13.400 | 242 | |||||
| 2026-02-17 | 13F | Credit Agricole S A | 0 | -100,00 | 0 | |||||
| 2026-02-17 | 13F | Alphadyne Asset Management, LLC | Put | 12.100 | 219 | |||||
| 2026-02-04 | 13F | First Eagle Investment Management, LLC | 201 | 4 | ||||||
| 2026-04-10 | 13F | Quaker Wealth Management, LLC | 7 | 0,00 | 0 | |||||
| 2026-01-28 | 13F | U S Global Investors Inc | 0 | -100,00 | 0 | -100,00 | ||||
| 2025-11-10 | 13F | Personal Cfo Solutions, Llc | 0 | -100,00 | 0 | |||||
| 2025-11-14 | 13F | Scientech Research LLC | 0 | -100,00 | 0 | -100,00 | ||||
| 2026-01-12 | 13F | Schaper Benz & Wise Investment Counsel Inc/wi | 105.920 | -1,90 | 1.915 | 22,91 | ||||
| 2026-02-12 | 13F | Brinker Capital Investments, LLC | 15.319 | 9,55 | 277 | 37,31 | ||||
| 2026-04-20 | 13F | State of Alaska, Department of Revenue | 55.005 | 0,44 | 1 | |||||
| 2026-02-17 | 13F | Tower Research Capital LLC (TRC) | 12.471 | -12,20 | 225 | 10,29 | ||||
| 2025-11-13 | 13F | Clear Street Markets Llc | 0 | -100,00 | 0 | -100,00 | ||||
| 2026-02-05 | 13F | Cambridge Investment Research Advisors, Inc. | 21.479 | -19,12 | 0 | |||||
| 2026-02-09 | 13F | Jefferies Financial Group Inc. | 15.206 | 275 | ||||||
| 2026-02-17 | 13F | XTX Topco Ltd | 62.518 | 1.130 | ||||||
| 2026-02-04 | 13F | Atlantic Union Bankshares Corp | 2.772 | -5,87 | 50 | 19,05 | ||||
| 2026-02-17 | 13F | Aqr Capital Management Llc | 6.051.810 | 77,60 | 109.417 | 122,76 | ||||
| 2026-04-24 | 13F | Deprince Race & Zollo Inc | 2.590.391 | -2,17 | 44.011 | -8,07 | ||||
| 2026-02-10 | 13F | Hazlett, Burt & Watson, Inc. | 0 | -100,00 | 0 | |||||
| 2026-02-11 | 13F | Jpmorgan Chase & Co | Put | 2.700 | 49 | |||||
| 2026-02-12 | 13F | Bank of Jackson Hole Trust | 0 | -100,00 | 0 | |||||
| 2026-02-17 | 13F | Cape Investment Advisory, Inc. | 146 | 3 | ||||||
| 2025-11-13 | 13F | Renaissance Technologies Llc | 0 | -100,00 | 0 | -100,00 | ||||
| 2026-01-30 | 13F | American Capital Advisory, LLC | 17 | 0,00 | 0 | |||||
| 2026-04-13 | 13F | Salem Investment Counselors Inc | 21.469 | 0,01 | 365 | -6,19 | ||||
| 2026-04-20 | 13F | Ronald Blue Trust, Inc. | 357 | 0,00 | 6 | 0,00 | ||||
| 2026-02-11 | 13F | Jpmorgan Chase & Co | 662.283 | 0,91 | 11.974 | 26,43 | ||||
| 2026-02-17 | 13F | Capital Fund Management S.a. | Call | 125.800 | -16,25 | 2.274 | 4,94 | |||
| 2026-02-11 | 13F | Jpmorgan Chase & Co | Call | 2.700 | 49 | |||||
| 2026-02-17 | 13F | Capital Fund Management S.a. | Put | 558.800 | -8,78 | 10.103 | 14,30 | |||
| 2026-02-11 | 13F | Prestige Wealth Management Group LLC | 207 | 18,29 | 4 | 50,00 | ||||
| 2026-02-17 | 13F | Public Employees Retirement System Of Ohio | 105.687 | -3,65 | 1.911 | 20,73 | ||||
| 2026-01-27 | 13F | Legacy Advisors, LLC | 18.064 | 0,00 | 327 | 25,38 | ||||
| 2026-02-17 | 13F | Tudor Investment Corp Et Al | 422.237 | 7.634 | ||||||
| 2026-02-17 | 13F | Tudor Investment Corp Et Al | Call | 204.300 | 3.694 | |||||
| 2026-02-13 | 13F | Charles Schwab Investment Management Inc | 4.188.514 | 2,92 | 75.728 | 28,96 | ||||
| 2026-02-13 | 13F | Vontobel Holding Ltd. | 71.025 | 138,38 | 1.284 | 199,30 | ||||
| 2026-04-15 | 13F | Bayforest Capital Ltd | 4.777 | 81 | ||||||
| 2025-11-14 | 13F | Advisor Group Holdings, Inc. | Put | 0 | -100,00 | 0 | -100,00 | |||
| 2025-11-14 | 13F | AXA Investment Managers S.A. | 30.000 | 433 | ||||||
| 2026-04-13 | 13F | IFP Advisors, Inc | 5.251 | 23,52 | 89 | 17,11 | ||||
| 2026-01-21 | 13F | Sound Income Strategies, LLC | 62 | 588,89 | 1 | |||||
| 2026-02-10 | 13F | Bank of New York Mellon Corp | 2.625.213 | 1,30 | 47.464 | 26,92 | ||||
| 2026-02-13 | 13F | Victory Capital Management Inc | 53.504 | 0,01 | 967 | 25,42 | ||||
| 2026-02-17 | 13F | Ancora Advisors, LLC | 797 | 14 | ||||||
| 2026-01-15 | 13F | Nisa Investment Advisors, Llc | 31.719 | 0,84 | 573 | 26,49 | ||||
| 2026-02-17 | 13F | Interval Partners, LP | Call | 44.400 | 803 | |||||
| 2025-11-05 | 13F | Plato Investment Management Ltd | 0 | -100,00 | 0 | |||||
| 2025-11-14 | 13F | Strategic Wealth Partners, Ltd. | 57 | 0,00 | 1 | |||||
| 2026-02-13 | 13F | Resources Management Corp /ct/ /adv | 25 | 0,00 | 0 | |||||
| 2026-02-17 | 13F | Bayesian Capital Management, LP | 0 | -100,00 | 0 | |||||
| 2026-02-17 | 13F | Aristeia Capital Llc | 38.143 | 690 | ||||||
| 2026-02-17 | 13F | Interval Partners, LP | 734.035 | 13.271 | ||||||
| 2026-02-17 | 13F | Scopus Asset Management, L.p. | Call | 500.000 | 9.040 | |||||
| 2026-04-22 | 13F | Sterling Capital Management LLC | 11.781 | -43,28 | 200 | -46,67 | ||||
| 2026-02-12 | 13F | South Dakota Investment Council | 128.024 | -56,21 | 2 | -50,00 | ||||
| 2026-02-13 | 13F | First Trust Advisors Lp | 61.935 | -13,14 | 1.120 | 8,85 | ||||
| 2026-02-13 | 13F | Arrowstreet Capital, Limited Partnership | 333.584 | -49,37 | 6.031 | -36,56 | ||||
| 2025-11-14 | 13F/A | NorthRock Partners, LLC | 0 | -100,00 | 0 | -100,00 | ||||
| 2026-02-10 | 13F | Savant Capital, LLC | 36.982 | 1,47 | 669 | 27,24 | ||||
| 2026-01-22 | 13F | Massachusetts Financial Services Co /ma/ | 3.367.502 | 23,20 | 60.884 | 54,37 | ||||
| 2026-02-12 | 13F | Commonwealth Equity Services, Llc | 796.730 | -0,19 | 14.405 | 130.845,45 | ||||
| 2026-02-23 | 13F | Kera Capital Partners, Inc. | 15.737 | 21,78 | 308 | 65,59 | ||||
| 2026-01-28 | 13F | Universal- Beteiligungs- und Servicegesellschaft mbH | 59.321 | -25,53 | 1.077 | -6,35 | ||||
| 2026-02-17 | 13F | Massar Capital Management, LP | 0 | -100,00 | 0 | |||||
| 2026-01-28 | 13F | HB Wealth Management, LLC | 15.141 | 45,35 | 274 | 82,00 | ||||
| 2026-02-02 | 13F | Montag A & Associates Inc | 5.790 | -29,17 | 105 | -11,11 | ||||
| 2026-01-30 | 13F | State of New Jersey Common Pension Fund D | 148.136 | -9,25 | 2.678 | 13,72 | ||||
| 2026-02-17 | 13F | Summit Trail Advisors, Llc | 58.985 | -30,74 | 1.066 | -13,19 | ||||
| 2025-11-07 | 13F | Atticus Wealth Management, Llc | 0 | -100,00 | 0 | |||||
| 2026-04-14 | 13F | Murphy Pohlad Asset Management LLC | 277.145 | -0,72 | 4.709 | -6,70 | ||||
| 2026-01-22 | 13F | Harwood Advisory Group, LLC | 149 | 0,00 | 3 | 0,00 | ||||
| 2026-02-13 | 13F | Morgan Stanley | 6.747.348 | -9,92 | 121.992 | 12,87 | ||||
| 2026-01-29 | 13F | Camelot Portfolios, LLC | 40.901 | -7,03 | 739 | 16,56 | ||||
| 2026-04-14 | 13F | Moisand Fitzgerald Tamayo, LLC | 300 | 0,00 | 5 | 0,00 | ||||
| 2026-04-17 | 13F | Fifth Third Wealth Advisors LLC | 10.819 | 4,56 | 184 | -2,14 | ||||
| 2026-04-20 | 13F | Friedenthal Financial | 12 | 0,00 | 0 | |||||
| 2026-01-23 | 13F | Assetmark, Inc | 32 | 18,52 | 1 | |||||
| 2026-02-11 | 13F | Franklin Resources Inc | 10.693 | -1,04 | 193 | 24,52 | ||||
| 2026-04-22 | 13F | Pinnacle Bancorp, Inc. | 700 | 0,00 | 12 | -8,33 | ||||
| 2025-11-14 | 13F | ExodusPoint Capital Management, LP | 0 | -100,00 | 0 | -100,00 | ||||
| 2026-01-07 | 13F | Marotta Asset Management | 14.848 | 0,00 | 268 | 18,06 | ||||
| 2025-11-14 | 13F | Sherbrooke Park Advisers Llc | 0 | -100,00 | 0 | |||||
| 2026-01-26 | 13F | Whittier Trust Co | 406 | -17,14 | 8 | 0,00 | ||||
| 2026-02-13 | 13F | Blueshift Asset Management, LLC | 117.346 | 191,62 | 2.122 | 265,69 | ||||
| 2026-02-17 | 13F | Susquehanna International Group, Llp | 1.011.508 | -51,37 | 18.288 | -39,07 | ||||
| 2026-04-15 | 13F | Merit Financial Group, LLC | 83.113 | 255,40 | 1.412 | 234,60 | ||||
| 2026-04-23 | 13F | Rexford Capital Inc | 4.055 | 0,00 | 69 | -6,85 | ||||
| 2026-02-11 | 13F | O'shaughnessy Asset Management, Llc | 19.487 | 4,34 | 352 | 30,86 | ||||
| 2026-02-13 | 13F | Pacific Center for Financial Services | 120 | 0,00 | 2 | 0,00 | ||||
| 2026-02-17 | 13F | Susquehanna International Group, Llp | Put | 2.374.600 | 164,64 | 42.933 | 231,57 | |||
| 2026-02-17 | 13F | Susquehanna International Group, Llp | Call | 6.600.300 | 56,83 | 119.333 | 96,49 | |||
| 2026-04-15 | 13F | Radnor Capital Management, LLC | 32.150 | -0,62 | 503 | -6,51 | ||||
| 2026-02-12 | 13F | Brown Brothers Harriman & Co | 0 | -100,00 | 0 | |||||
| 2026-02-13 | 13F | Edgestream Partners, L.P. | 0 | -100,00 | 0 | |||||
| 2025-11-14 | 13F | Wolverine Trading, Llc | 103.771 | 41,19 | 1.499 | 72,30 | ||||
| 2025-11-14 | 13F | Wolverine Trading, Llc | Call | 384.500 | 34,63 | 5.556 | 64,33 | |||
| 2025-11-14 | 13F | Wolverine Trading, Llc | Put | 269.800 | 26,19 | 3.899 | 54,01 | |||
| 2026-02-10 | 13F | Mycio Wealth Partners, Llc | 18.585 | 0,48 | 336 | 26,32 | ||||
| 2026-02-12 | 13F | Rossby Financial, LCC | 22 | 0 | ||||||
| 2026-02-04 | 13F | Virginia Retirement Systems Et Al | 17.300 | -79,88 | 313 | -74,84 | ||||
| 2025-11-13 | 13F | FORA Capital, LLC | 0 | -100,00 | 0 | |||||
| 2026-04-13 | 13F | Bank & Trust Co | 2.540 | 0,00 | 43 | -4,44 | ||||
| 2026-01-29 | 13F | Quent Capital, LLC | 13.170 | 1.635,18 | 238 | 2.280,00 | ||||
| 2026-02-09 | 13F | Harbour Investments, Inc. | 398 | -76,22 | 7 | -70,83 | ||||
| 2026-02-11 | 13F | First Command Advisory Services, Inc. | 1.814 | 0,00 | 33 | 23,08 | ||||
| 2026-02-17 | 13F | Royal Bank Of Canada | 403.954 | -44,38 | 7.303 | -30,31 | ||||
| 2026-02-13 | 13F | Eventide Asset Management, Llc | 21.864 | -39,23 | 399 | -23,12 | ||||
| 2026-01-23 | 13F | Rsm Us Wealth Management Llc | 13.548 | 247 | ||||||
| 2026-02-12 | 13F | CIBC Private Wealth Group, LLC | 690 | -86,91 | 12 | -84,21 | ||||
| 2026-02-12 | 13F | Johnson Financial Group, Inc. | 94 | 0,00 | 2 | 0,00 | ||||
| 2026-02-04 | 13F | Ameritas Advisory Services, LLC | 0 | -100,00 | 0 | |||||
| 2026-02-17 | 13F | Soviero Asset Management, LP | 0 | -100,00 | 0 | |||||
| 2026-02-10 | 13F | Principia Wealth Advisory, LLC | 4 | 0,00 | 0 | |||||
| 2026-02-09 | 13F | Keating Financial Advisory Services, Inc. | 215 | 4 | ||||||
| 2025-10-30 | 13F | Keebeck Alpha, LP | 0 | -100,00 | 0 | |||||
| 2025-11-17 | 13F | FSA Wealth Management LLC | 2 | 0,00 | 0 | |||||
| 2026-02-17 | 13F | Wellington Management Group Llp | 831.557 | 15.035 | ||||||
| 2025-11-14 | 13F | Axa S.a. | 0 | -100,00 | 0 | -100,00 | ||||
| 2026-01-27 | 13F | Asset Management One Co., Ltd. | 0 | -100,00 | 0 | |||||
| 2026-02-12 | 13F | Triumph Capital Management | 320 | 0,00 | 6 | 25,00 | ||||
| 2025-11-14 | 13F | Wood Tarver Financial Group, LLC | 0 | -100,00 | 0 | |||||
| 2026-04-06 | 13F | Versant Capital Management, Inc | 2.575 | 968,46 | 44 | 975,00 | ||||
| 2026-02-12 | 13F | Federation des caisses Desjardins du Quebec | 1.443 | 0,00 | 26 | 30,00 | ||||
| 2026-02-04 | 13F | Swiss Life Asset Management Ltd | 15.553 | 0,00 | 281 | 25,45 | ||||
| 2026-02-06 | 13F | HighTower Advisors, LLC | 43.717 | -6,62 | 790 | 17,04 | ||||
| 2026-02-13 | 13F | SRS Capital Advisors, Inc. | 14.108 | -77,98 | 255 | -72,40 | ||||
| 2026-02-12 | 13F | Marex Group plc | 12.106 | -58,09 | 219 | -47,60 | ||||
| 2026-04-16 | 13F | Evolve Private Wealth, Llc | 21.830 | 44,52 | 371 | 35,53 | ||||
| 2026-01-21 | 13F | Signature Resources Capital Management, LLC | 300 | 0,00 | 5 | 25,00 | ||||
| 2026-02-11 | 13F | SOUTH STATE Corp | 778 | 0,00 | 14 | 27,27 | ||||
| 2026-04-07 | 13F | Signaturefd, Llc | 7.041 | 2,31 | 120 | -4,03 | ||||
| 2026-02-11 | 13F | Empowered Funds, LLC | 177.340 | 12,34 | 3.206 | 40,80 | ||||
| 2026-02-10 | 13F | Natixis Advisors, L.p. | 89.560 | 2 | ||||||
| 2026-02-12 | 13F | Advisors Asset Management, Inc. | 0 | -100,00 | 0 | |||||
| 2026-02-13 | 13F | Aigen Investment Management, Lp | 71.774 | 1.298 | ||||||
| 2026-04-02 | 13F | Hilltop National Bank | 625 | 0,00 | 11 | -9,09 | ||||
| 2026-02-17 | 13F | Lotus Technology Management, LP | 123.255 | 2.228 | ||||||
| 2026-01-28 | 13F | Hoey Investments, Inc | 36 | 0,00 | 1 | |||||
| 2026-02-13 | 13F | Truvestments Capital Llc | 3 | 0,00 | 0 | |||||
| 2026-01-29 | 13F | UBS Group AG | Put | 4.375.500 | 193,76 | 79.109 | 268,07 | |||
| 2026-01-29 | 13F | UBS Group AG | Call | 3.852.784 | 26,11 | 69.658 | 58,02 | |||
| 2026-04-06 | 13F | Highline Wealth Partners Llc | 48 | 336,36 | 1 | |||||
| 2026-01-05 | 13F | Catherine Avery Investment Management LLC | 2 | 0,00 | 0 | |||||
| 2026-01-29 | 13F | UBS Group AG | 4.039.788 | -29,95 | 73.039 | -12,23 | ||||
| 2026-04-20 | 13F | Louisiana State Employees Retirement System | 95.300 | 4,96 | 1.619 | -1,34 | ||||
| 2026-04-23 | 13F | SJS Investment Consulting Inc. | 1.037 | 757,02 | 18 | 750,00 | ||||
| 2026-02-09 | 13F | Kingsview Wealth Management, LLC | 30.932 | 19,41 | 559 | 49,87 | ||||
| 2026-02-17 | 13F | Warren Averett Asset Management, LLC | 14.679 | 16,32 | 265 | 45,60 | ||||
| 2026-02-23 | 13F | Phillip James Consulting Co. | 236 | 0 | ||||||
| 2026-02-13 | 13F | Squarepoint Ops LLC | Call | 77.500 | -79,89 | 1.401 | -74,81 | |||
| 2026-03-12 | 13F/A | Peak6 Llc | Call | 33.900 | 10,42 | 613 | 38,15 | |||
| 2026-02-13 | 13F | Squarepoint Ops LLC | Put | 62.300 | -85,66 | 1.126 | -82,04 | |||
| 2026-02-13 | 13F | Squarepoint Ops LLC | 564.604 | -64,68 | 10.208 | -55,74 | ||||
| 2026-03-12 | 13F/A | Peak6 Llc | 147.073 | 2.659 | ||||||
| 2026-04-22 | 13F | Janney Montgomery Scott LLC | 68.662 | -4,22 | 1 | 0,00 | ||||
| 2026-03-12 | 13F/A | Peak6 Llc | Put | 150.900 | 187,98 | 2.728 | 260,85 | |||
| 2026-02-12 | 13F | Bank Of Montreal /can/ | 76.378 | -1,12 | 1.381 | 23,88 | ||||
| 2025-11-17 | 13F | LGT Financial Advisors LLC | 0 | -100,00 | 0 | |||||
| 2026-02-13 | 13F | Baird Financial Group, Inc. | 51.653 | -17,03 | 934 | 3,90 | ||||
| 2026-01-26 | 13F | Whittier Trust Co Of Nevada Inc | 1.410 | -15,52 | 27 | 8,00 | ||||
| 2026-02-06 | 13F | Global Retirement Partners, LLC | 838 | 8,41 | 15 | 36,36 | ||||
| 2026-01-22 | 13F | Bear Mountain Capital, Inc. | 16 | 0,00 | 0 | |||||
| 2026-04-16 | 13F | Capital Advisors, Ltd. LLC | 1 | -83,33 | 0 | |||||
| 2026-02-12 | 13F | Systematic Alpha Investments, LLC | 116.777 | 0,00 | 2.111 | 25,28 | ||||
| 2026-01-22 | 13F | Bartlett & Co. Wealth Management Llc | 379 | -56,88 | 7 | -50,00 | ||||
| 2026-04-22 | 13F | Pictet Asset Management Holding SA | 53.048 | -0,55 | 901 | -6,54 | ||||
| 2026-02-12 | 13F | EntryPoint Capital, LLC | 0 | -100,00 | 0 | |||||
| 2026-02-12 | 13F | Colonial Trust Co / SC | 101 | 1,00 | 2 | 0,00 | ||||
| 2026-01-29 | 13F | Comerica Bank | 103.193 | -7,91 | 1.866 | 15,34 | ||||
| 2026-02-17 | 13F/A | Intesa Sanpaolo S.p.a. | 466.751 | 8.523 | ||||||
| 2026-02-13 | 13F | Ieq Capital, Llc | 558.272 | 134,10 | 10.094 | 193,32 | ||||
| 2026-02-13 | 13F | Caitong International Asset Management Co., Ltd | 1.432 | 26 | ||||||
| 2026-02-04 | 13F | Midwest Trust Co | 35.463 | 1,44 | 641 | 27,18 | ||||
| 2026-02-17 | 13F | California State Teachers Retirement System | 320.645 | 1,10 | 5.797 | 26,68 | ||||
| 2026-01-30 | 13F | AMG National Trust Bank | 985.063 | -2,56 | 17.810 | 22,09 | ||||
| 2026-01-15 | 13F | Private Advisory Group LLC | 0 | -100,00 | 0 | -100,00 | ||||
| 2026-01-29 | 13F | Teachers Retirement System Of The State Of Kentucky | 102.547 | -5,53 | 2 | 0,00 | ||||
| 2026-04-24 | 13F | Strs Ohio | 90.898 | 980,70 | 1.544 | 915,79 | ||||
| 2026-02-10 | 13F | Semanteon Capital Management, LP | 0 | -100,00 | 0 | |||||
| 2026-02-13 | 13F | Marshall Wace, Llp | 24.068 | 435 | ||||||
| 2026-01-26 | 13F | Cwm, Llc | 167.189 | 166,64 | 3 | |||||
| 2026-04-16 | 13F | Smith Thornton Advisors LLC | 32.225 | 0,00 | 547 | -6,01 | ||||
| 2026-02-05 | 13F | Plante Moran Financial Advisors, LLC | 57 | 1 | ||||||
| 2026-02-23 | 13F | Monetary Solutions, Ltd | 25 | 0 | ||||||
| 2025-11-04 | 13F | Penserra Capital Management LLC | 0 | -100,00 | 0 | |||||
| 2025-11-04 | 13F | Guerra Advisors Inc | 55 | 1 | ||||||
| 2026-02-17 | 13F | Northern Trust Corp | 19.987.028 | -0,34 | 361.365 | 24,87 | ||||
| 2026-02-17 | 13F | D. E. Shaw & Co., Inc. | Call | 16.400 | -52,74 | 297 | -40,80 | |||
| 2026-01-29 | 13F | IMC-Chicago, LLC | 153.745 | -39,20 | 2.780 | -23,82 | ||||
| 2026-01-29 | 13F | IMC-Chicago, LLC | Put | 400.000 | -7,75 | 7.232 | 15,60 | |||
| 2026-01-29 | 13F | IMC-Chicago, LLC | Call | 709.200 | 3,14 | 12.822 | 29,23 | |||
| 2026-02-12 | 13F | Nuveen, LLC | 642.103 | -12,80 | 11.609 | 9,26 | ||||
| 2026-02-17 | 13F | D. E. Shaw & Co., Inc. | 889.584 | -48,86 | 16.084 | -35,92 | ||||
| 2026-02-17 | 13F | D. E. Shaw & Co., Inc. | Put | 217.000 | 165,28 | 3.923 | 232,46 | |||
| 2025-10-30 | 13F | Twin Peaks Wealth Advisors, LLC | 0 | -100,00 | 0 | |||||
| 2026-02-17 | 13F | Jones Financial Companies Lllp | 2.425.030 | 17,60 | 43.845 | 44,35 | ||||
| 2026-04-17 | 13F | Union Savings Bank | 175 | 0,00 | 3 | -33,33 | ||||
| 2026-02-10 | 13F | Commonwealth Of Pennsylvania Public School Empls Retrmt Sys | 82.132 | -2,47 | 1.485 | 22,14 | ||||
| 2025-11-04 | 13F | Independent Advisor Alliance | 0 | -100,00 | 0 | -100,00 | ||||
| 2026-04-15 | 13F | Norden Group Llc | 29.369 | -0,62 | 499 | -6,74 | ||||
| 2026-02-13 | 13F | Transamerica Financial Advisors, Inc. | 11 | 0 | ||||||
| 2026-01-23 | 13F | Nbt Bank N A /ny | 285 | -36,67 | 5 | -16,67 | ||||
| 2026-01-29 | 13F | State Of Michigan Retirement System | 77.600 | -0,64 | 1.403 | 24,60 | ||||
| 2026-02-17 | 13F | SummitTX Capital, L.P. | 91.653 | 1.657 | ||||||
| 2026-02-11 | 13F | Cerity Partners LLC | 209.732 | 232,81 | 3.792 | 317,05 | ||||
| 2026-04-23 | 13F | J.w. Cole Advisors, Inc. | 0 | -100,00 | 0 | |||||
| 2026-04-14 | 13F | Zrc Wealth Management, Llc | 168 | 3 | ||||||
| 2026-02-13 | 13F | Golden State Wealth Management, LLC | 108 | 0,00 | 2 | 0,00 | ||||
| 2026-02-04 | 13F | Madison Asset Management, LLC | 236.287 | 0,38 | 4.272 | 25,80 | ||||
| 2026-02-11 | 13F | Simplex Trading, Llc | 92.499 | 147,29 | 1.672 | |||||
| 2026-02-11 | 13F | Simplex Trading, Llc | Call | 726.600 | -0,62 | 13.137 | 131.260,00 | |||
| 2026-02-13 | 13F | K2 Principal Fund, L.p. | 0 | -100,00 | 0 | -100,00 | ||||
| 2026-01-12 | 13F | CVA Family Office, LLC | 35 | 1 | ||||||
| 2026-02-11 | 13F | Simplex Trading, Llc | Put | 510.800 | -10,56 | 9.235 | 115.337,50 | |||
| 2026-04-14 | 13F | Kozak & Associates, Inc. | 337 | 0,30 | 6 | 0,00 | ||||
| 2025-11-07 | 13F | Heartland Advisors Inc | 0 | -100,00 | 0 | |||||
| 2026-02-13 | 13F | Colony Group, LLC | 49.905 | 50,14 | 902 | 90,30 | ||||
| 2026-04-16 | 13F | Diversified Trust Co | 21.210 | 360 | ||||||
| 2026-02-12 | 13F | Dimensional Fund Advisors Lp | 5.618.360 | -6,28 | 101.583 | 17,44 | ||||
| 2026-02-12 | 13F | Cloud Capital Management, LLC | 0 | -100,00 | 0 | |||||
| 2025-10-31 | 13F | Cullen/frost Bankers, Inc. | 0 | -100,00 | 0 | -100,00 | ||||
| 2026-04-08 | 13F | Wealth Enhancement Advisory Services, Llc | 319.162 | 93,82 | 4.735 | 47,05 | ||||
| 2026-04-15 | 13F | Exchange Traded Concepts, Llc | 2.823 | 48 | ||||||
| 2026-04-22 | 13F | Patriot Financial Group Insurance Agency, LLC | 55.488 | 105,01 | 943 | 92,64 | ||||
| 2026-04-24 | 13F | Balentine LLC | 21.202 | 0,00 | 360 | -6,01 | ||||
| 2026-02-13 | 13F | Smartleaf Asset Management LLC | 68 | 47,83 | 1 | |||||
| 2026-02-17 | 13F | Price T Rowe Associates Inc /md/ | 9.432.379 | -24,53 | 171 | -5,56 | ||||
| 2026-01-28 | 13F | DekaBank Deutsche Girozentrale | 38.110 | 0,00 | 1 | |||||
| 2026-02-06 | 13F | Van Hulzen Asset Management, LLC | 21.550 | -7,11 | 390 | 16,47 | ||||
| 2026-02-05 | 13F | Amalgamated Bank | 153.284 | 1,54 | 3 | 0,00 | ||||
| 2025-11-21 | 13F | Nebula Research & Development LLC | 0 | -100,00 | 0 | -100,00 | ||||
| 2026-01-30 | 13F | Valued Wealth Advisors LLC | 6 | 0,00 | 0 | |||||
| 2026-02-17 | 13F | Two Sigma Advisers, Lp | 0 | -100,00 | 0 | |||||
| 2026-02-04 | 13F | Oregon Public Employees Retirement Fund | 65.256 | -1,21 | 1.180 | 23,71 | ||||
| 2026-02-17 | 13F | Rivermont Capital Management LP | 760.112 | 26,64 | 13.743 | 58,68 | ||||
| 2026-04-20 | 13F | City State Bank | 4 | 0,00 | 0 | |||||
| 2025-11-14 | 13F | Point72 Asia (Singapore) Pte. Ltd. | 21.403 | 2,92 | 309 | 26,23 | ||||
| 2026-02-09 | 13F | Hartland & Co., LLC | 1.682 | 53,61 | 30 | 100,00 | ||||
| 2026-01-27 | 13F | Regions Financial Corp | 37.524 | -1,60 | 678 | 23,27 | ||||
| 2026-01-30 | 13F | Us Bancorp \de\ | 16.235 | -11,46 | 294 | 10,98 | ||||
| 2026-02-17 | 13F | Boothbay Fund Management, Llc | 159.230 | 12,56 | 2.879 | 41,01 | ||||
| 2026-02-13 | 13F | American Century Companies Inc | 3.941.324 | 68,11 | 71.259 | 110,63 | ||||
| 2026-02-17 | 13F | Twinbeech Capital Lp | 181.653 | 3.284 | ||||||
| 2026-04-24 | 13F | Key FInancial Inc | 2.658 | -1,48 | 45 | -6,25 | ||||
| 2026-02-17 | 13F | Quantinno Capital Management LP | 679.769 | 59,53 | 12.290 | 99,90 | ||||
| 2026-02-17 | 13F | SageView Advisory Group, LLC | 215 | 4 | ||||||
| 2025-10-27 | 13F | Stephens Inc /ar/ | 0 | -100,00 | 0 | |||||
| 2026-02-13 | 13F | Parkside Financial Bank & Trust | 3.839 | -22,79 | 69 | -2,82 | ||||
| 2025-11-14 | 13F | Cubist Systematic Strategies, LLC | Put | 78.700 | -33,31 | 1.136 | -18,11 | |||
| 2026-01-29 | 13F | Concurrent Investment Advisors, LLC | 0 | -100,00 | 0 | |||||
| 2025-11-14 | 13F | Cubist Systematic Strategies, LLC | Call | 54.100 | -23,04 | 781 | -5,57 | |||
| 2026-01-29 | 13F | Concurrent Investment Advisors, LLC | Put | 0 | -100,00 | 0 | ||||
| 2026-01-29 | 13F | Rakuten Securities, Inc. | 5 | -99,00 | 0 | -100,00 | ||||
| 2026-01-29 | 13F | Concurrent Investment Advisors, LLC | Call | 0 | -100,00 | 0 | ||||
| 2026-01-30 | 13F | Levin Capital Strategies, L.p. | Put | 0 | -100,00 | 0 | ||||
| 2026-04-07 | 13F | Eastern Bank | 1.874 | 0,00 | 32 | -6,06 | ||||
| 2026-02-17 | 13F | Farringdon Capital, Ltd. | 0 | -100,00 | 0 | |||||
| 2026-02-13 | 13F | Ubs Asset Management Americas Inc | 1.207.109 | -2,08 | 21.825 | 22,69 | ||||
| 2026-04-07 | 13F | CoreCap Advisors, LLC | 128 | 374,07 | 2 | |||||
| 2026-02-10 | 13F | Eurizon Capital SGR S.p.A. | 2.064 | 38 | ||||||
| 2026-04-03 | 13F | Global Wealth Strategies & Associates | 5.660 | 0,00 | 96 | -5,88 | ||||
| 2026-02-12 | 13F | Summit Financial, LLC | 13.601 | -2,68 | 246 | 21,89 | ||||
| 2026-02-11 | 13F | Twin Tree Management, LP | Call | 218.900 | 3.958 | |||||
| 2026-02-11 | 13F | Twin Tree Management, LP | Put | 573.600 | 170,18 | 10.371 | 238,56 | |||
| 2026-02-11 | 13F | Twin Tree Management, LP | 305.740 | 82,46 | 5.528 | 128,58 | ||||
| 2026-02-05 | 13F | Allworth Financial LP | 5.701 | 129,42 | 103 | 194,29 | ||||
| 2026-02-09 | 13F | Legal & General Group Plc | 658.009 | -15,42 | 11.897 | 5,98 | ||||
| 2026-02-27 | 13F | Groupama Asset Managment | 38.467 | 0,00 | 695 | 25,23 | ||||
| 2026-02-17 | 13F | Alliancebernstein L.p. | 656.100 | 1,13 | 11.862 | 26,72 | ||||
| 2026-02-11 | 13F | MCF Advisors LLC | 15.740 | -29,84 | 285 | -12,07 | ||||
| 2026-04-16 | 13F | Westmount Partners, LLC | 22.461 | 382 | ||||||
| 2026-02-12 | 13F | Caerus Investment Advisors, LLC | 10.811 | 195 | ||||||
| 2026-02-12 | 13F | Federated Hermes, Inc. | 484.292 | 0,68 | 8.756 | 26,15 | ||||
| 2026-02-09 | 13F | Bleakley Financial Group, LLC | 40.609 | 10,92 | 734 | 39,02 | ||||
| 2026-02-06 | 13F | Handelsbanken Fonder AB | 112.000 | 19,15 | 2 | 100,00 | ||||
| 2026-02-11 | 13F | Los Angeles Capital Management Llc | 1.509 | 21 | ||||||
| 2025-10-28 | 13F | Campbell & CO Investment Adviser LLC | 0 | -100,00 | 0 | |||||
| 2026-02-17 | 13F | Millennium Management Llc | 166.114 | -90,96 | 3.003 | -88,67 | ||||
| 2026-02-03 | 13F | Everence Capital Management Inc | 18.085 | 0,00 | 0 | |||||
| 2026-02-06 | 13F | Bare Financial Services, Inc | 22 | 0 | ||||||
| 2026-04-23 | 13F | Glass Jacobson Investment Advisors llc | 68 | 0,00 | 1 | 0,00 | ||||
| 2026-02-13 | 13F | Pathstone Holdings, LLC | 35.116 | 19,15 | 635 | 49,18 | ||||
| 2026-02-17 | 13F | State Of Wisconsin Investment Board | 142.205 | -20,52 | 2.571 | -0,39 | ||||
| 2026-02-13 | 13F | Rice Hall James & Associates, Llc | 118.462 | -1,14 | 2.142 | 23,83 | ||||
| 2026-02-13 | 13F | Boston Family Office Llc | 20.000 | 0 | ||||||
| 2026-02-13 | 13F | Headlands Technologies LLC | 0 | -100,00 | 0 | |||||
| 2026-01-27 | 13F | TD Waterhouse Canada Inc. | 2.684 | 0,00 | 48 | 17,07 | ||||
| 2026-02-17 | 13F | PDT Partners, LLC | 276.214 | 0,00 | 4.994 | 25,29 | ||||
| 2026-04-23 | 13F | TFC Financial Management | 3.642 | -41,02 | 62 | -45,05 | ||||
| 2026-02-13 | 13F | National Bank Of Canada /fi/ | 7 | -98,85 | 0 | -100,00 | ||||
| 2026-04-13 | 13F | Massmutual Trust Co Fsb/adv | 599 | -41,56 | 10 | -44,44 | ||||
| 2025-11-12 | 13F | NewSquare Capital LLC | 0 | -100,00 | 0 | |||||
| 2026-01-29 | 13F | Dunhill Financial, LLC | 18 | 125,00 | 0 | |||||
| 2026-01-28 | 13F | Teacher Retirement System Of Texas | 10.962 | -74,74 | 198 | -68,37 | ||||
| 2026-02-17 | 13F | Maryland State Retirement & Pension System | 18.852 | 15,29 | 341 | 44,68 | ||||
| 2026-02-13 | 13F | Barclays Plc | 450.513 | -50,07 | 8.145 | -37,44 | ||||
| 2025-11-12 | 13F | Mcdonald Partners Llc | 0 | -100,00 | 0 | -100,00 | ||||
| 2026-02-12 | 13F | Voya Investment Management Llc | 25.908 | -64,21 | 468 | -55,17 | ||||
| 2026-02-03 | 13F | Strengthening Families & Communities, LLC | 0 | -100,00 | 0 | |||||
| 2025-11-14 | 13F | Sona Asset Management (us) Llc | 0 | -100,00 | 0 | |||||
| 2026-04-06 | 13F | CX Institutional | 3.604 | 0,53 | 0 | |||||
| 2026-02-13 | 13F | Heritage Wealth Advisors | 400 | 0,00 | 7 | 40,00 | ||||
| 2026-01-28 | 13F | Klp Kapitalforvaltning As | 71.000 | 2,01 | 1.284 | 27,79 | ||||
| 2026-02-12 | 13F | Colonial Trust Advisors | 200 | 4 | ||||||
| 2026-02-10 | 13F | Acadian Asset Management Llc | 0 | -100,00 | 0 | |||||
| 2026-01-23 | 13F | Steigerwald, Gordon & Koch Inc. | 150 | 0,00 | 3 | 0,00 | ||||
| 2026-02-13 | 13F | Barclays Plc | Call | 225.000 | -91,83 | 4.068 | -92,59 | |||
| 2026-02-13 | 13F | Barclays Plc | Put | 225.000 | -67,26 | 4.068 | -70,33 | |||
| 2025-11-14 | 13F | Point72 Hong Kong Ltd | 12.969 | 939,18 | 187 | 1.235,71 | ||||
| 2025-11-10 | 13F | Northern Financial Advisors Inc | 0 | -100,00 | 0 | -100,00 | ||||
| 2026-02-12 | 13F | M&G Plc | 25.550.701 | 12,93 | 459.913 | 45,20 | ||||
| 2026-02-17 | 13F | Kelly Lawrence W & Associates Inc/ca | 1.475 | 0,00 | 27 | 23,81 | ||||
| 2026-02-12 | 13F | Swiss National Bank | 654.700 | 1,93 | 11.837 | 27,71 | ||||
| 2026-02-13 | 13F | Ceredex Value Advisors LLC | 1.542.000 | 27.879 | ||||||
| 2026-02-17 | 13F | Qube Research & Technologies Ltd | Call | 8.400 | -41,26 | 152 | -26,70 | |||
| 2026-02-17 | 13F | Fmr Llc | 12.745.898 | 6,51 | 230.446 | 33,45 | ||||
| 2026-02-17 | 13F | Blair William & Co/il | 16.248 | 2,95 | 294 | 29,07 | ||||
| 2026-04-23 | 13F | Sippican Capital Advisors | 106.700 | 1,26 | 1.813 | -4,88 | ||||
| 2026-02-02 | 13F | Savoir Faire Capital Management, L.P. | 117.715 | -62,50 | 2.128 | -53,01 | ||||
| 2026-02-23 | 13F | Virtu Financial LLC | 41.212 | 108,46 | 1 | |||||
| 2026-01-27 | 13F | Evergreen Capital Management Llc | 23.990 | 434 | ||||||
| 2026-02-13 | 13F | Wells Fargo & Company/mn | Call | 0 | -100,00 | 0 | -100,00 | |||
| 2026-02-17 | 13F | Qube Research & Technologies Ltd | Put | 8.500 | 0,00 | 154 | 25,41 | |||
| 2026-02-17 | 13F | Caption Management, LLC | 116.900 | 39,17 | 2.114 | 74,34 | ||||
| 2025-12-09 | 13F/A | Tudor Investment Corp Et Al | Put | 0 | -100,00 | 0 | ||||
| 2026-02-06 | 13F | Pnc Financial Services Group, Inc. | 74.398.593 | -0,36 | 1.345.127 | 24,84 | ||||
| 2026-02-17 | 13F | Select Equity Group, L.P. | Call | 277.400 | 8,27 | 5.015 | 35,69 | |||
| 2025-10-27 | 13F | First Horizon Corp | 0 | -100,00 | 0 | -100,00 | ||||
| 2026-02-14 | 13F | POM Investment Strategies, LLC | 0 | -100,00 | 0 | |||||
| 2026-02-17 | 13F | Advisor Group Holdings, Inc. | 292.657 | -21,70 | 5.291 | -6,07 | ||||
| 2026-01-20 | 13F | Cromwell Holdings LLC | 58 | 0,00 | 1 | |||||
| 2026-04-20 | 13F | Assenagon Asset Management S.A. | 248.621 | 120,89 | 4.224 | 107,67 | ||||
| 2026-02-03 | 13F | Sequoia Financial Advisors, LLC | 11.039 | 200 | ||||||
| 2026-02-11 | 13F | Ameritas Investment Partners, Inc. | 60.150 | -2,21 | 1.088 | 22,55 | ||||
| 2026-04-21 | 13F | Pflug Koory, LLC | 75 | 0,00 | 1 | 0,00 | ||||
| 2026-02-11 | 13F | CoreFirst Bank & Trust | 0 | -100,00 | 0 | |||||
| 2026-02-11 | 13F | Harvest Fund Management Co., Ltd | 3.794 | 0,00 | 0 | |||||
| 2026-01-21 | 13F | Future Financial Wealth Managment LLC | 0 | -100,00 | 0 | |||||
| 2026-02-13 | 13F | Stifel Financial Corp | 390.215 | -0,25 | 7.055 | 24,98 | ||||
| 2026-01-27 | 13F | Zurcher Kantonalbank (Zurich Cantonalbank) | 97.071 | 23,59 | 1.755 | 54,90 | ||||
| 2026-02-13 | 13F | Landscape Capital Management, L.l.c. | 164.630 | -26,81 | 2.977 | -8,29 | ||||
| 2026-03-13 | 13F | Fund Advisors of America Inc/FL | 14.175 | 256 | ||||||
| 2026-01-28 | 13F | Financial Perspectives, Inc | 700 | 0,00 | 13 | 20,00 | ||||
| 2026-02-13 | 13F | Johnson Investment Counsel Inc | 0 | -100,00 | 0 | |||||
| 2026-02-13 | 13F | Diametric Capital, LP | 101.954 | 115,95 | 1.843 | 170,63 | ||||
| 2026-02-12 | 13F | Sepio Capital, LP | 17.838 | 1,62 | 323 | 27,27 | ||||
| 2026-02-03 | 13F | SBI Securities Co., Ltd. | 3.482 | -5,64 | 63 | 16,98 | ||||
| 2026-02-06 | 13F | Leonteq Securities AG | 16.059 | -48,50 | 290 | -35,41 | ||||
| 2026-02-13 | 13F | Prudential Financial Inc | 23.357 | -38,18 | 422 | -22,57 | ||||
| 2026-02-03 | 13F | International Assets Investment Management, Llc | 343 | 6 | ||||||
| 2025-11-14 | 13F | Atom Investors LP | 0 | -100,00 | 0 | |||||
| 2025-11-14 | 13F | WealthTrak Capital Management LLC | 0 | -100,00 | 0 | |||||
| 2026-02-03 | 13F | Bokf, Na | 1.321 | 0,00 | 24 | 21,05 | ||||
| 2026-02-10 | 13F | Godfrey Financial Associates, Inc. | 5 | 0 | ||||||
| 2026-01-13 | 13F | Fort Washington Investment Advisors Inc /oh/ | 0 | -100,00 | 0 | -100,00 | ||||
| 2026-02-13 | 13F | Segall Bryant & Hamill, Llc | 4.283.186 | -13,26 | 77.440 | 8,68 | ||||
| 2026-02-17 | 13F | Gotham Asset Management, LLC | 209.253 | -0,03 | 3.783 | 25,26 | ||||
| 2026-02-17 | 13F | Parallax Volatility Advisers, L.P. | 8.211 | 148 | ||||||
| 2026-02-17 | 13F | Advisory Services Network, LLC | 0 | -100,00 | 0 | |||||
| 2026-02-17 | 13F | Parallax Volatility Advisers, L.P. | Call | 150.000 | 0,00 | 2.712 | 25,32 | |||
| 2026-02-17 | 13F | Russell Investments Group, Ltd. | 659.773 | 14,00 | 11.930 | 42,86 | ||||
| 2026-02-02 | 13F | Fifth Third Bancorp | 11.066 | -1,12 | 200 | 24,22 | ||||
| 2026-04-17 | 13F | AdvisorNet Financial, Inc | 103 | 0,00 | 2 | 0,00 | ||||
| 2026-02-17 | 13F | Wiley Bros.-aintree Capital, Llc | 15.725 | -14,63 | 284 | 7,17 | ||||
| 2025-11-17 | 13F | Sender Co & Partners, Inc. | 0 | -100,00 | 0 | -100,00 | ||||
| 2026-02-17 | 13F | Nissay Asset Management Corp /japan/ /adv | 97.916 | 0,00 | 1.770 | 25,35 | ||||
| 2026-02-17 | 13F | ArrowMark Colorado Holdings LLC | 423.975 | 0,00 | 7.665 | 25,31 | ||||
| 2026-04-13 | 13F | Creative Financial Designs Inc /adv | 10 | 0,00 | 0 | |||||
| 2026-04-15 | 13F | Financial Management Professionals, Inc. | 6 | 0 | ||||||
| 2026-04-24 | 13F | Root Financial Partners, LLC | 3.052 | 282,94 | 52 | 264,29 | ||||
| 2026-01-26 | 13F | Asset Dedication, LLC | 13.443 | 10,67 | 243 | 38,86 | ||||
| 2026-02-17 | 13F | Point72 Asset Management, L.P. | Put | 48.000 | 361,54 | 868 | 478,00 | |||
| 2026-02-17 | 13F | VARCOV Co. | 49.247 | 890 | ||||||
| 2026-01-29 | 13F | Mendel Money Management | 14.455 | -21,08 | 261 | -1,14 | ||||
| 2026-02-11 | 13F | Fox Run Management, L.l.c. | 77.959 | 1.409 | ||||||
| 2026-01-21 | 13F | Indiana Trust & Investment Management CO | 40 | 1 | ||||||
| 2026-02-17 | 13F | Point72 Asset Management, L.P. | 1.250.961 | -53,33 | 22.617 | -41,52 | ||||
| 2026-02-17 | 13F | Nomura Holdings Inc | 322.255 | 153,14 | 5.826 | 217,32 | ||||
| 2026-02-12 | 13F | Kovack Advisors, Inc. | 0 | -100,00 | 0 | |||||
| 2026-02-17 | 13F | Nomura Holdings Inc | Call | 1.000.000 | 18.080 | |||||
| 2026-02-17 | 13F | Point72 Asset Management, L.P. | Call | 35.200 | 198,31 | 636 | 274,12 | |||
| 2026-02-17 | 13F | Nomura Holdings Inc | Put | 500.000 | 0,00 | 9.040 | 25,29 | |||
| 2026-02-17 | 13F | Two Sigma Investments, Lp | 670.108 | 11,75 | 12.116 | 40,03 | ||||
| 2026-02-13 | 13F | Dynamic Technology Lab Private Ltd | 63.217 | 1.143 | ||||||
| 2025-11-04 | 13F | High Note Wealth, LLC | 0 | -100,00 | 0 | |||||
| 2026-02-11 | 13F | Inceptionr Llc | 17.945 | 38,37 | 324 | 73,26 | ||||
| 2025-11-14 | 13F | Petrus Trust Company, LTA | 0 | -100,00 | 0 | |||||
| 2026-04-16 | 13F | Toth Financial Advisory Corp | 480 | -11,93 | 8 | -11,11 | ||||
| 2026-02-17 | 13F | Capital Fund Management S.a. | 0 | -100,00 | 0 | |||||
| 2026-02-12 | 13F | BRYN MAWR TRUST Co | 6.300 | -0,83 | 114 | 24,18 | ||||
| 2026-02-17 | 13F | Freestone Grove Partners LP | 0 | -100,00 | 0 | |||||
| 2026-02-17 | 13F | Raymond James Financial Inc | 285.927 | 13,79 | 5.170 | 42,59 | ||||
| 2025-11-06 | 13F | Caisse Des Depots Et Consignations | 0 | -100,00 | 0 | |||||
| 2025-11-14 | 13F | Jain Global LLC | 0 | -100,00 | 0 | |||||
| 2026-01-26 | 13F | KBC Group NV | 8.982 | 0,00 | 0 | |||||
| 2026-02-13 | 13F | Formula Growth Ltd | 65.721 | -5,46 | 1.188 | 18,44 | ||||
| 2026-02-17 | 13F | Schonfeld Strategic Advisors LLC | Put | 32.000 | 579 | |||||
| 2026-02-09 | 13F | Koesten, Hirschmann & Crabtree, INC. | 0 | -100,00 | 0 | |||||
| 2026-04-21 | 13F | Financial Consulate, Inc | 31 | 0,00 | 1 | |||||
| 2026-02-17 | 13F | Schonfeld Strategic Advisors LLC | 430.314 | 544,34 | 7.780 | 707,89 | ||||
| 2026-02-17 | 13F | Schonfeld Strategic Advisors LLC | Call | 32.000 | 579 | |||||
| 2026-02-06 | 13F | ProShare Advisors LLC | 13.163 | -5,69 | 238 | 17,91 | ||||
| 2025-10-27 | 13F | Nordea Investment Management Ab | 0 | -100,00 | 0 | |||||
| 2026-02-04 | 13F | Clark Wealth Partners | 0 | -100,00 | 0 | |||||
| 2026-02-11 | 13F | Deutsche Bank Ag\ | 106.575 | -10,96 | 1.927 | 11,52 | ||||
| 2026-04-21 | 13F | Vise Technologies, Inc. | 10.638 | 0,00 | 192 | 0,00 | ||||
| 2026-02-13 | 13F | 1 North Wealth Services Llc | 241 | 4 | ||||||
| 2026-02-17 | 13F | Parvin Asset Management, LLC | 325 | 0,00 | 6 | 25,00 | ||||
| 2026-04-15 | 13F | Compagnie Lombard Odier SCmA | 5.100 | 0,00 | 87 | -6,52 | ||||
| 2026-01-30 | 13F | Caldwell Securities, Inc | 37 | 0,00 | 1 | |||||
| 2026-02-10 | 13F | Nomura Asset Management Co Ltd | 5.300 | 0,00 | 96 | 25,00 | ||||
| 2026-02-17 | 13F | Prelude Capital Management, Llc | 25.367 | -14,86 | 459 | 6,76 | ||||
| 2026-02-05 | 13F | Northwestern Mutual Investment Management Company, Llc | 73.432 | 0,40 | 1.328 | 25,78 | ||||
| 2026-02-10 | 13F | Envestnet Asset Management Inc | 19.506 | -54,00 | 353 | -42,39 | ||||
| 2026-04-16 | 13F | SG Americas Securities, LLC | 98.133 | -5,22 | 2 | 0,00 | ||||
| 2026-02-17 | 13F | Graham Capital Management, L.P. | 79.007 | 109,34 | 1.428 | 162,50 | ||||
| 2026-02-09 | 13F | Quest Partners LLC | 20.512 | -5,19 | 371 | 18,59 | ||||
| 2026-02-17 | 13F | Limestone Investment Advisors LP | 33.129 | 599 | ||||||
| 2026-02-13 | 13F | S&t Bank/pa | 165 | 0,00 | 3 | 0,00 | ||||
| 2025-11-14 | 13F | Cubist Systematic Strategies, LLC | 0 | -100,00 | 0 | -100,00 | ||||
| 2025-11-14 | 13F | SIH Partners, LLLP | 0 | -100,00 | 0 | -100,00 | ||||
| 2026-04-09 | 13F | Cliftonlarsonallen Wealth Advisors, Llc | 16.028 | 0,00 | 272 | -5,88 | ||||
| 2026-02-11 | 13F | CSM Advisors, LLC | 34.785 | 66,21 | 1 | |||||
| 2026-02-17 | 13F | Fund 1 Investments, LLC | 578.818 | 623,52 | 10.465 | 806,85 | ||||
| 2026-02-10 | 13F | CIBC Asset Management Inc | 12.138 | 0,00 | 219 | 25,14 | ||||
| 2026-01-23 | 13F | Ogorek Anthony Joseph /ny/ /adv | 229 | 197,40 | 0 | |||||
| 2025-11-14 | 13F | Toroso Investments, LLC | 0 | -100,00 | 0 | -100,00 | ||||
| 2026-02-13 | 13F | State Street Corp | 10.785.490 | -1,94 | 195.002 | 22,87 | ||||
| 2026-02-12 | 13F | Steward Partners Investment Advisory, Llc | 15.077 | 11,36 | 273 | 39,49 | ||||
| 2026-04-21 | 13F | Robeco Institutional Asset Management B.V. | 72.715 | 0,00 | 1.235 | -6,01 | ||||
| 2025-11-13 | 13F | Jump Financial, LLC | 0 | -100,00 | 0 | |||||
| 2025-11-13 | 13F | Eisler Capital Management Ltd. | 68.630 | 994 | ||||||
| 2026-02-09 | 13F | Coldstream Capital Management Inc | 10.843 | -10,74 | 196 | 12,00 | ||||
| 2026-02-17 | 13F | Dark Forest Capital Management Lp | 0 | -100,00 | 0 | |||||
| 2026-04-08 | 13F | Community Financial Services Group, LLC | 79 | 1 | ||||||
| 2026-04-21 | 13F | Gilpin Wealth Management, Llc | 1.311 | 0,00 | 22 | -4,35 | ||||
| 2025-11-14 | 13F | Two Sigma Securities, Llc | 0 | -100,00 | 0 | -100,00 | ||||
| 2026-04-13 | 13F | Hm Payson & Co | 10.816 | -0,92 | 184 | -7,11 | ||||
| 2026-02-03 | 13F | Crossmark Global Holdings, Inc. | 32.857 | -0,19 | 594 | 25,05 | ||||
| 2026-02-05 | 13F | Td Private Client Wealth Llc | 114 | 0,00 | 2 | 100,00 | ||||
| 2026-02-10 | 13F | ESL Trust Services, LLC | 2.000 | 0,00 | 36 | 28,57 | ||||
| 2026-02-10 | 13F | Koss-Olinger Consulting, LLC | 79.645 | -18,69 | 1.440 | 25,11 | ||||
| 2026-04-23 | 13F | McMillan Office, Inc. | 71 | 0,00 | 1 | 0,00 |