Grundlæggende statistik
| Institutionelle ejere | 219 total, 213 long only, 0 short only, 6 long/short - change of 9,50% MRQ |
| Gennemsnitlig porteføljeallokering | 0.2088 % - change of -34,92% MRQ |
| Institutionelle aktier (lange) | 7.518.756 (ex 13D/G) - change of -1,04MM shares -12,13% MRQ |
| Institutionel værdi (lang) | $ 367.192 USD ($1000) |
Institutionelt ejerskab og aktionærer
Sprott Funds Trust - Sprott Uranium Miners ETF (US:URNM) har 219 institutionelle ejere og aktionærer, der har indsendt 13D/G- eller 13F-formularer til Securities Exchange Commission (SEC). Disse institutioner har i alt 7,518,756 aktier. Største aktionærer omfatter Susquehanna International Group, Llp, Clal Insurance Enterprises Holdings Ltd, Goldman Sachs Group Inc, Morgan Stanley, Susquehanna International Group, Llp, Susquehanna International Group, Llp, UBS Group AG, Lloyd Harbor Capital Management, LLC, LPL Financial LLC, and HighTower Advisors, LLC .
Sprott Funds Trust - Sprott Uranium Miners ETF (ARCA:URNM) institutionel ejerskabsstruktur viser aktuelle positioner i virksomheden efter institutioner og fonde, samt seneste ændringer i positionsstørrelse. Større aktionærer kan omfatte individuelle investorer, investeringsforeninger, hedgefonde eller institutioner. Skema 13D angiver, at investoren besidder (eller besidder) mere end 5 % af virksomheden og har til hensigt (eller har til hensigt at) aktivt at forfølge en ændring i forretningsstrategi. Skema 13G indikerer en passiv investering på over 5%.
The share price as of April 10, 2026 is 64,44 / share. Previously, on April 14, 2025, the share price was 31,43 / share. This represents an increase of 105,03% over that period.

Fondens stemningsscore
Fund Sentiment Score (fka Ownership Accumulation Score) finder de aktier, der bliver mest købt af fonde. Det er resultatet af en sofistikeret, multi-faktor kvantitativ model, der identificerer virksomheder med de højeste niveauer af institutionel akkumulering. Scoringsmodellen bruger en kombination af den samlede stigning i oplyste ejere, ændringerne i porteføljeallokeringer i disse ejere og andre målinger. Tallet går fra 0 til 100, hvor højere tal indikerer et højere niveau af akkumulering for sine jævnaldrende, og 50 er gennemsnittet.
Opdateringsfrekvens: Dagligt
Se Ownership Explorer, som giver en liste over højest rangerende virksomheder.
AI+ Ask Fintel’s AI assistant about Sprott Funds Trust - Sprott Uranium Miners ETF.
Select a question to share a public post with an AI-crafted answer.
Thinking of good questions…
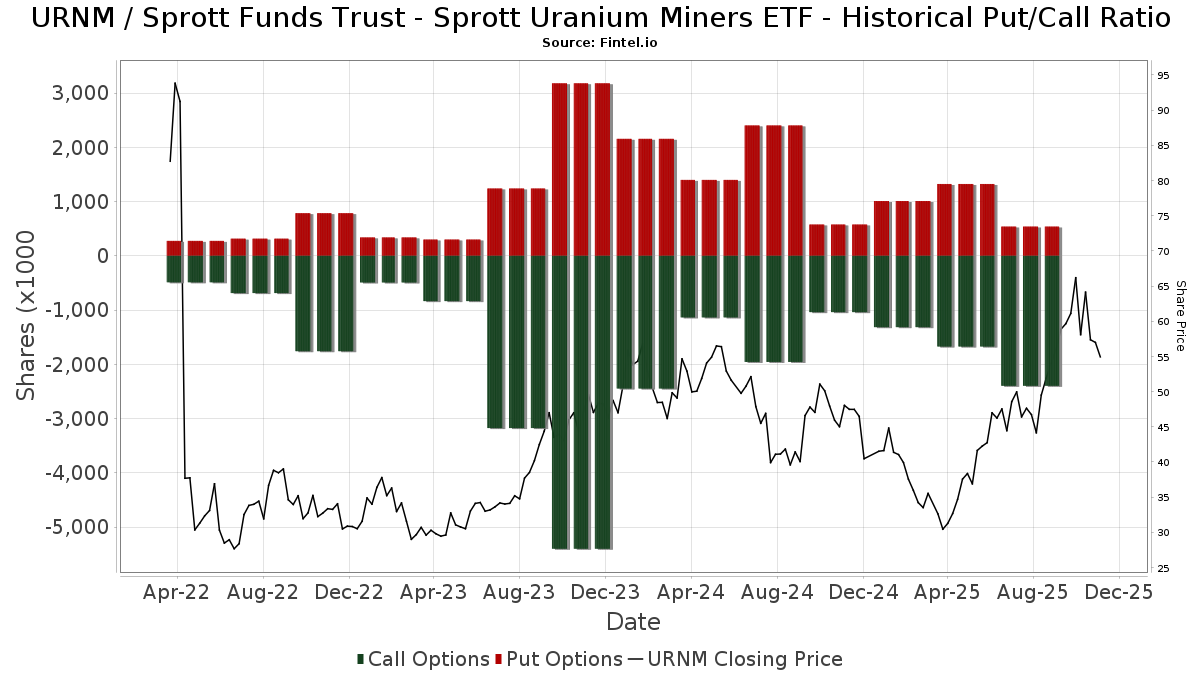
Institutionel Put/Call-forhold
Ud over at indberette standardaktie- og gældsudstedelser skal institutter med mere end 100 mill. aktiver under forvaltning også oplyse deres put- og call-optionsbeholdninger. Da salgsoptioner generelt indikerer negativ stemning, og købsoptioner indikerer positiv stemning, kan vi få en fornemmelse af den overordnede institutionelle stemning ved at plotte forholdet mellem put og kald. Diagrammet til højre viser det historiske put/call-forhold for dette instrument.
Brug af Put/Call Ratio som en indikator for investorernes stemning overvinder en af de vigtigste mangler ved at bruge totalt institutionelt ejerskab, som er, at en betydelig mængde af aktiver under forvaltning investeres passivt for at spore indekser. Passivt forvaltede fonde køber typisk ikke optioner, så indikatoren for put/call-forholdet følger mere nøje følelsen af aktivt forvaltede fonde.
13F og NPORT arkivering
Detaljer om 13F-arkivering er gratis. Detaljer om NP-ansøgninger kræver et premium-medlemskab. Grønne rækker angiver nye positioner. Røde rækker angiver lukkede positioner. Klik på linket ikon for at se den fulde transaktionshistorik.
Opgrader
for at låse premium-data op og eksportere til Excel ![]() .
.
| Fil dato | Kilde | Investor | Type | Gennemsnitlig pris (Øst) |
Aktier | Δ Aktier (%) |
Rapporteret Værdi ($1000) |
Δ Værdi (%) |
Port Alloc (%) |
|
|---|---|---|---|---|---|---|---|---|---|---|
| 2026-01-14 | 13F | Hennion & Walsh Asset Management, Inc. | 16.280 | 0,00 | 894 | -9,16 | ||||
| 2026-02-11 | 13F | Jpmorgan Chase & Co | 4.674 | -62,66 | 257 | -66,14 | ||||
| 2026-01-09 | 13F | Tactive Advisors, LLC | 29.818 | -2,88 | 1.637 | -11,81 | ||||
| 2026-04-07 | 13F | CoreCap Advisors, LLC | 2 | 0,00 | 0 | |||||
| 2026-01-27 | 13F | Compass Financial Group, INC/SD | 6.600 | 0,00 | 362 | -9,05 | ||||
| 2026-01-29 | 13F | UBS Group AG | 306.713 | 100,26 | 16.835 | 81,90 | ||||
| 2025-11-04 | 13F | Gitterman Wealth Management, LLC | 4.697 | -0,82 | 284 | 25,22 | ||||
| 2026-02-26 | 13F | Ssa Swiss Advisors Ag | 0 | -100,00 | 0 | |||||
| 2026-01-23 | 13F | Financial Enhancement Group LLC | 33.784 | 2.513 | ||||||
| 2026-02-17 | 13F | Advisor Group Holdings, Inc. | 163.590 | -11,02 | 8.982 | -12,31 | ||||
| 2026-02-13 | 13F | Samjo Management, LLC | 0 | -100,00 | 0 | |||||
| 2026-02-11 | 13F | LPL Financial LLC | 276.252 | 2,18 | 15.163 | -7,19 | ||||
| 2026-02-17 | 13F | ExodusPoint Capital Management, LP | 0 | -100,00 | 0 | -100,00 | ||||
| 2026-02-19 | 13F | CI Private Wealth, LLC | 4.633 | 0,00 | 254 | -8,96 | ||||
| 2026-02-17 | 13F | Cetera Investment Advisers | 87.145 | 0,90 | 4.783 | -8,35 | ||||
| 2026-02-06 | 13F | Cullen/frost Bankers, Inc. | 21 | 1 | ||||||
| 2025-11-14 | 13F | Alphadyne Asset Management, LLC | Call | 0 | -100,00 | 0 | ||||
| 2026-01-20 | 13F | Savvy Advisors, Inc. | 47.213 | 0,46 | 2.592 | -8,77 | ||||
| 2026-02-02 | 13F | Marks Wealth, LLC | 0 | -100,00 | 0 | |||||
| 2026-02-17 | 13F | Parallax Volatility Advisers, L.P. | Put | 1.700 | 93 | |||||
| 2026-02-17 | 13F | Parallax Volatility Advisers, L.P. | Call | 9.500 | 521 | |||||
| 2026-02-17 | 13F | Parallax Volatility Advisers, L.P. | 1 | 0 | ||||||
| 2026-02-17 | 13F | VestGen Advisors, LLC | 4.926 | 270 | ||||||
| 2026-02-12 | 13F | Brinker Capital Investments, LLC | 4.938 | -45,68 | 271 | -50,64 | ||||
| 2026-02-06 | 13F | Kimelman & Baird, LLC | 7 | 0,00 | 0 | |||||
| 2026-02-04 | 13F | Ameritas Advisory Services, LLC | 5.359 | -75,30 | 294 | -77,56 | ||||
| 2026-02-11 | 13F | Invst, LLC | 33.908 | 1,52 | 1.861 | -7,78 | ||||
| 2026-02-13 | 13F | Botty Investors LLC | 13.000 | 714 | ||||||
| 2026-02-17 | 13F | Royal Bank Of Canada | 120.516 | 171,89 | 6.615 | 147,01 | ||||
| 2026-01-28 | 13F | WIT Partners Advisory Pte. Ltd. | 10.330 | 37,73 | 539 | 25,12 | ||||
| 2026-02-17 | 13F | Graham Capital Management, L.P. | 4.323 | 237 | ||||||
| 2025-11-14 | 13F | Creative Planning | 0 | -100,00 | 0 | |||||
| 2026-02-05 | 13F | Allworth Financial LP | 210 | 0,00 | 12 | -8,33 | ||||
| 2026-02-11 | 13F | J.w. Cole Advisors, Inc. | 0 | -100,00 | 0 | |||||
| 2026-01-22 | 13F | Vision Financial Markets Llc | 2 | 100,00 | 0 | |||||
| 2026-02-03 | 13F | Redwood Wealth Management Group, LLC | 9.284 | 0,34 | 510 | -8,94 | ||||
| 2026-02-13 | 13F | Avid Wealth Partners LLC | 3.895 | 214 | ||||||
| 2026-02-17 | 13F | Susquehanna International Group, Llp | Call | 947.400 | -19,25 | 52.003 | -26,66 | |||
| 2026-01-09 | 13F | 180 Wealth Advisors, Llc | 29.532 | -1,19 | 1.621 | -10,30 | ||||
| 2026-02-17 | 13F | Susquehanna International Group, Llp | 391.032 | 26,03 | 21.464 | 14,48 | ||||
| 2026-02-17 | 13F | Susquehanna International Group, Llp | Put | 356.700 | 83,49 | 19.579 | 66,67 | |||
| 2025-11-14 | 13F | Wolverine Trading, Llc | 11.977 | 4,60 | 723 | 33,95 | ||||
| 2025-11-14 | 13F | Wolverine Trading, Llc | Call | 98.400 | 19,27 | 5.937 | 52,78 | |||
| 2025-11-04 | 13F | Jones Financial Companies Lllp | 0 | -100,00 | 0 | -100,00 | ||||
| 2025-11-14 | 13F | Wolverine Trading, Llc | Put | 88.200 | -0,90 | 5.322 | 26,93 | |||
| 2026-02-03 | 13F | Privium Fund Management B.V. | 5.407 | -52,77 | 297 | -57,16 | ||||
| 2026-02-12 | 13F | Jane Street Group, Llc | Call | 197.000 | -48,21 | 10.813 | -52,96 | |||
| 2026-02-17 | 13F | Capital Wealth Alliance, LLC | 24.704 | 0,91 | 1.793 | 21,16 | ||||
| 2026-01-21 | 13F | Sound Income Strategies, LLC | 7 | -97,73 | 0 | -100,00 | ||||
| 2026-02-17 | 13F | Tower Research Capital LLC (TRC) | 24 | 1 | ||||||
| 2026-02-12 | 13F | Jane Street Group, Llc | 128.763 | -25,67 | 7.068 | -32,50 | ||||
| 2026-02-17 | 13F | D. E. Shaw & Co., Inc. | 20.156 | 1.106 | ||||||
| 2025-11-13 | 13F | UBS Group AG | Put | 0 | -100,00 | 0 | -100,00 | |||
| 2025-11-06 | 13F | Oppenheimer & Co Inc | 0 | -100,00 | 0 | |||||
| 2026-02-02 | 13F | Mutual Advisors, LLC | 4.207 | 0,84 | 231 | -3,77 | ||||
| 2026-02-12 | 13F | Jane Street Group, Llc | Put | 106.300 | -25,97 | 5.835 | -32,76 | |||
| 2026-02-10 | 13F | Operose Advisors LLC | 414 | -79,25 | 23 | -81,67 | ||||
| 2026-02-13 | 13F | Vontobel Holding Ltd. | 13.090 | -3,00 | 719 | -11,90 | ||||
| 2026-02-13 | 13F | Mml Investors Services, Llc | 44.281 | 8,14 | 2.431 | -1,78 | ||||
| 2026-02-12 | 13F | Cibc World Markets Corp | 180.000 | 9.880 | ||||||
| 2026-02-14 | 13F | Rockefeller Capital Management L.P. | 15.127 | 8,31 | 830 | -1,66 | ||||
| 2026-02-12 | 13F | Wealthspire Advisors, LLC | 7.655 | 1,81 | 420 | -7,49 | ||||
| 2026-02-06 | 13F/A | Rathbone Brothers plc | 4.410 | 10,25 | 242 | 0,41 | ||||
| 2026-02-17 | 13F | Spruce Point Capital Management, Llc | 15.000 | 823 | ||||||
| 2026-02-13 | 13F | Morgan Stanley | 442.395 | -7,15 | 24.283 | -15,66 | ||||
| 2026-02-02 | 13F | Fifth Third Bancorp | 550 | 0,00 | 30 | -9,09 | ||||
| 2026-02-11 | 13F | Group One Trading, L.p. | 0 | -100,00 | 0 | |||||
| 2025-11-14 | 13F | Turim 21 Investimentos Ltda. | 0 | -100,00 | 0 | |||||
| 2026-01-09 | 13F | Zrc Wealth Management, Llc | 170 | 0,00 | 9 | -10,00 | ||||
| 2026-01-29 | 13F | UBS Group AG | Call | 0 | -100,00 | 0 | -100,00 | |||
| 2026-01-27 | 13F | Zurcher Kantonalbank (Zurich Cantonalbank) | 137 | -87,03 | 8 | -88,89 | ||||
| 2026-04-02 | 13F | Hilltop National Bank | 100 | 0,00 | 6 | 20,00 | ||||
| 2026-04-07 | 13F | Mb, Levis & Associates, Llc | 25 | 0,00 | 2 | 0,00 | ||||
| 2026-01-23 | 13F | Freestone Capital Holdings, LLC | 3.780 | 0,05 | 207 | -9,21 | ||||
| 2026-02-11 | 13F | MidWestOne Financial Group, Inc. | 15.351 | 843 | ||||||
| 2026-02-17 | 13F | Anatole Investment Management Ltd | 7.796 | -99,43 | 428 | -99,48 | ||||
| 2026-02-17 | 13F | Prelude Capital Management, Llc | 0 | -100,00 | 0 | |||||
| 2026-02-13 | 13F | Avos Capital Management, LLC | 5.387 | 0,00 | 296 | -9,23 | ||||
| 2026-02-18 | 13F | Caitlin John, LLC | 850 | 25,93 | 47 | 15,00 | ||||
| 2026-01-29 | 13F | Sanctuary Advisors, LLC | 4.853 | 3,43 | 266 | -6,01 | ||||
| 2026-02-05 | 13F | Cambridge Investment Research Advisors, Inc. | 40.580 | -5,68 | 2 | 0,00 | ||||
| 2026-02-12 | 13F | Federation des caisses Desjardins du Quebec | 9.692 | -45,75 | 532 | -50,79 | ||||
| 2026-04-08 | 13F | Fermata Advisors, LLC | 4.859 | 0,43 | 307 | 15,47 | ||||
| 2025-11-05 | 13F | Anthracite Investment Company, Inc. | 0 | -100,00 | 0 | -100,00 | ||||
| 2025-11-14 | 13F | Skopos Labs, Inc. | 0 | -100,00 | 0 | |||||
| 2026-02-06 | 13F | Pnc Financial Services Group, Inc. | 12.846 | 0,00 | 705 | -9,15 | ||||
| 2026-02-17 | 13F | Quadrature Capital Ltd | 12.855 | 706 | ||||||
| 2025-11-03 | 13F | Stonegate Investment Group, LLC | 16.000 | 0,00 | 967 | 26,11 | ||||
| 2025-11-14 | 13F | Mount Yale Investment Advisors, LLC | 0 | -100,00 | 0 | -100,00 | ||||
| 2026-01-22 | 13F | Accordant Advisory Group Inc | 7.882 | 1,26 | 433 | -8,09 | ||||
| 2026-04-07 | 13F | Farther Finance Advisors, LLC | 1.951 | 289,42 | 125 | 359,26 | ||||
| 2026-02-13 | 13F | Wells Fargo & Company/mn | 4.030 | -30,95 | 221 | -37,22 | ||||
| 2026-01-16 | 13F | Ronald Blue Trust, Inc. | 600 | 0,00 | 33 | -11,11 | ||||
| 2026-01-20 | 13F | AdvisorNet Financial, Inc | 3.665 | 18,69 | 201 | 8,06 | ||||
| 2026-02-09 | 13F | Kingsview Wealth Management, LLC | 120.800 | 6.631 | ||||||
| 2026-01-30 | 13F | Sigma Planning Corp | 6.418 | -0,88 | 352 | -9,97 | ||||
| 2026-02-04 | 13F | West Tower Group, LLC | 5.000 | 274 | ||||||
| 2026-01-29 | 13F | DecisionPoint Financial, LLC | 19 | 0,00 | 1 | 0,00 | ||||
| 2025-12-01 | 13F | CMC Financial Group | 0 | -100,00 | 0 | |||||
| 2026-02-11 | 13F | DCF Advisers, LLC | 35.000 | 1.921 | ||||||
| 2026-02-10 | 13F | Nomura Asset Management Co Ltd | 5.966 | 0,00 | 327 | -9,17 | ||||
| 2026-01-14 | 13F | BFI Infinity Ltd. | Put | 0 | -100,00 | 0 | ||||
| 2026-02-13 | 13F | Resources Investment Advisors, LLC. | 30.042 | -1,82 | 1.649 | -10,82 | ||||
| 2026-02-12 | 13F | Pettinga Financial Advisors, LLC | 26.566 | -2,83 | 1.458 | -11,74 | ||||
| 2025-10-27 | 13F | Mountain Hill Investment Partners Corp. | 0 | -100,00 | 0 | |||||
| 2026-04-10 | 13F | Perigon Wealth Management, LLC | 19.273 | 11,64 | 1.217 | 28,51 | ||||
| 2026-01-14 | 13F | ORG Partners LLC | 81 | 8.000,00 | 4 | |||||
| 2026-02-12 | 13F | Greenfield Seitz Capital Management, LLC | 112.502 | -12,37 | 6.175 | -20,40 | ||||
| 2026-02-03 | 13F | Oak Family Advisors, Llc | 20.417 | -7,57 | 1.121 | -16,04 | ||||
| 2025-11-14 | 13F | Natixis | 0 | -100,00 | 0 | |||||
| 2026-01-21 | 13F | Stone House Investment Management, LLC | 100 | 0,00 | 5 | -16,67 | ||||
| 2026-02-03 | 13F | Plan Group Financial, LLC | 0 | -100,00 | 0 | |||||
| 2026-02-13 | 13F | Barclays Plc | Put | 0 | -100,00 | 0 | -100,00 | |||
| 2026-02-13 | 13F | Barclays Plc | Call | 0 | -100,00 | 0 | -100,00 | |||
| 2026-02-13 | 13F | Centaurus Financial, Inc. | 0 | -100,00 | 0 | |||||
| 2026-02-17 | 13F | Aqr Capital Management Llc | 3.900 | 214 | ||||||
| 2026-02-12 | 13F | Steward Partners Investment Advisory, Llc | 5.428 | -57,00 | 298 | -61,02 | ||||
| 2026-01-23 | 13F | E&G Advisors, LP | 5.164 | -2,27 | 283 | -11,29 | ||||
| 2026-02-11 | 13F | Simplex Trading, Llc | 70.746 | 3.883 | ||||||
| 2026-02-12 | 13F | Insigneo Advisory Services, Llc | 0 | -100,00 | 0 | |||||
| 2026-02-12 | 13F | Commonwealth Equity Services, Llc | 129.478 | 8,16 | 7.107 | 101.428,57 | ||||
| 2026-02-12 | 13F | Scotia Capital Inc. | 7.126 | 7,06 | 391 | -2,74 | ||||
| 2026-02-17 | 13F | Private Advisor Group, LLC | 55.795 | -8,66 | 3.063 | -17,04 | ||||
| 2026-01-26 | 13F | Cwm, Llc | 0 | -100,00 | 0 | |||||
| 2026-01-23 | 13F | Assetmark, Inc | 77 | -88,84 | 4 | -90,24 | ||||
| 2026-01-15 | 13F | One + One Wealth Management, Llc | 78.843 | 2,63 | 4.328 | -6,79 | ||||
| 2026-02-17 | 13F | Hyposwiss Advisors SA | 4.460 | 245 | ||||||
| 2026-01-23 | 13F | Brown, Lisle/cummings, Inc. | 1.025 | 56 | ||||||
| 2026-02-13 | 13F | Barclays Plc | 9.353 | 534,53 | 513 | 476,40 | ||||
| 2026-01-22 | 13F | BOCHK Asset Management Ltd | 0 | -100,00 | 0 | |||||
| 2025-11-14 | 13F | Peak6 Llc | Put | 0 | -100,00 | 0 | -100,00 | |||
| 2026-02-11 | 13F | Manchester Capital Management LLC | 10.900 | 598 | ||||||
| 2026-02-17 | 13F | Citadel Advisors Llc | 0 | -100,00 | 0 | |||||
| 2026-01-21 | 13F | Petra Financial Advisors Inc | 34.349 | -4,05 | 1.885 | -12,85 | ||||
| 2026-02-04 | 13F | MONECO Advisors, LLC | 3.975 | -5,67 | 218 | -14,17 | ||||
| 2026-01-26 | 13F | AE Wealth Management LLC | 427 | 23 | ||||||
| 2026-02-14 | 13F | Militia Capital Partners, LP | 5.600 | -15,15 | 307 | -22,86 | ||||
| 2026-02-11 | 13F | TCTC Holdings, LLC | 1.100 | 0,00 | 60 | -9,09 | ||||
| 2025-11-12 | 13F | Ameriflex Group, Inc. | 0 | -100,00 | 0 | |||||
| 2026-01-20 | 13F | Global Trust Asset Management, LLC | 600 | 0,00 | 33 | -11,11 | ||||
| 2026-02-17 | 13F | Raymond James Financial Inc | 116.046 | 9,05 | 6.370 | -0,95 | ||||
| 2026-01-30 | 13F | Bogart Wealth, LLC | 325 | 0,00 | 18 | -10,53 | ||||
| 2026-02-09 | 13F | Harbour Investments, Inc. | 1.074 | -14,15 | 59 | -22,67 | ||||
| 2026-04-02 | 13F | Marex Group plc | 0 | -100,00 | 0 | -100,00 | ||||
| 2026-02-13 | 13F | SRS Capital Advisors, Inc. | 299 | -87,69 | 16 | -89,04 | ||||
| 2026-01-28 | 13F | Glassman Wealth Services | 1.010 | 0,00 | 55 | -9,84 | ||||
| 2026-02-05 | 13F | Blume Capital Management, Inc. | 725 | 0,00 | 40 | -9,30 | ||||
| 2026-02-06 | 13F | IFP Advisors, Inc | 6.509 | 804,03 | 357 | 730,23 | ||||
| 2026-01-13 | 13F | Stonehage Fleming Financial Services Holdings Ltd | 384 | 0,00 | 21 | -8,70 | ||||
| 2026-02-06 | 13F | Kilter Group LLC | 0 | -100,00 | 0 | |||||
| 2026-02-12 | 13F | Hollencrest Capital Management | 42.130 | 0,13 | 2.313 | -9,05 | ||||
| 2026-02-06 | 13F | Cumberland Partners Ltd | 224.686 | 12.334 | ||||||
| 2026-02-10 | 13F | Tandem Financial, LLC | 35.147 | -6,70 | 1.417 | -37,79 | ||||
| 2026-02-09 | 13F | Prospera Financial Services Inc | 114.591 | 1,82 | 6.290 | -7,51 | ||||
| 2026-01-29 | 13F | St. Johns Investment Management Company, LLC | 1.360 | 0,00 | 75 | -9,76 | ||||
| 2026-02-10 | 13F | Envestnet Asset Management Inc | 44.799 | -57,06 | 2.459 | -61,00 | ||||
| 2026-02-13 | 13F | Wilkerson Advisory Group LLC | 75 | 4 | ||||||
| 2026-02-06 | 13F | Private Wealth Advisors, LLC | 68.546 | 30,08 | 3.762 | 18,15 | ||||
| 2026-02-12 | 13F | CIBC Private Wealth Group, LLC | 526 | 0,00 | 29 | -9,68 | ||||
| 2026-02-17 | 13F | Russell Investments Group, Ltd. | 10 | 0,00 | 1 | |||||
| 2026-02-12 | 13F | Summit Financial, LLC | 7.519 | 3,34 | 413 | -6,15 | ||||
| 2026-02-17 | 13F | Boothbay Fund Management, Llc | 0 | -100,00 | 0 | |||||
| 2026-02-13 | 13F | Flow Traders U.s. Llc | 0 | -100,00 | 0 | |||||
| 2026-02-10 | 13F | Shepherd Financial Partners LLC | 4.000 | 0,00 | 220 | -9,13 | ||||
| 2026-02-17 | 13F | Millennium Management Llc | 73.007 | 19,12 | 4.007 | 8,21 | ||||
| 2026-02-13 | 13F | Clal Insurance Enterprises Holdings Ltd | 630.000 | 0,00 | 35 | -10,53 | ||||
| 2026-02-06 | 13F | HighTower Advisors, LLC | 255.227 | 0,16 | 14.009 | -9,02 | ||||
| 2026-02-13 | 13F | Oceanic Investment Management LTD | 5.701 | 313 | ||||||
| 2026-02-10 | 13F | Deuterium Capital Management, LLC | 15.000 | 0,00 | 823 | -9,16 | ||||
| 2026-04-06 | 13F | Miller Global Investments, LLC | 25.176 | -4,72 | 1.590 | 9,59 | ||||
| 2026-02-17 | 13F | Fmr Llc | 375 | 9,65 | 21 | 0,00 | ||||
| 2026-02-10 | 13F | JTC Employer Solutions Trusteee Ltd | 8.500 | 0,00 | 0 | |||||
| 2026-02-13 | 13F | Cordoba Advisory Partners LLC | 3.856 | 212 | ||||||
| 2026-02-13 | 13F | Colony Group, LLC | 4.544 | 249 | ||||||
| 2026-01-27 | 13F | Belpointe Asset Management LLC | 9.398 | -10,05 | 516 | -18,38 | ||||
| 2026-02-04 | 13F | Knuff & Co LLC | 567 | 31 | ||||||
| 2026-02-17 | 13F | Lloyd Harbor Capital Management, LLC | 303.171 | -38,13 | 16.641 | -43,80 | ||||
| 2026-02-18 | 13F | Corecam AG | 56.000 | 3.083 | ||||||
| 2026-02-17 | 13F | Citadel Advisors Llc | Put | 76.900 | -28,86 | 4.221 | -35,38 | |||
| 2026-02-17 | 13F | Advisory Services Network, LLC | 28.759 | 6,18 | 1.579 | -3,55 | ||||
| 2026-02-11 | 13F | Cerity Partners LLC | 9.000 | 0,00 | 494 | -9,02 | ||||
| 2026-02-17 | 13F | Citadel Advisors Llc | Call | 202.900 | -4,11 | 11.137 | -12,90 | |||
| 2026-02-06 | 13F | Gsa Capital Partners Llp | 27.716 | 0,00 | 2 | 0,00 | ||||
| 2026-02-17 | 13F | Bank Of America Corp /de/ | 169.051 | 73,70 | 9.279 | 57,78 | ||||
| 2026-04-07 | 13F | Signaturefd, Llc | 53 | 0,00 | 3 | 50,00 | ||||
| 2026-02-10 | 13F | Goldman Sachs Group Inc | Call | 500.000 | 27.445 | |||||
| 2026-02-17 | 13F | Scopus Asset Management, L.p. | 0 | -100,00 | 0 | |||||
| 2026-02-04 | 13F | Seelaus Asset Management LLC | 11.985 | 1,87 | 658 | -7,46 | ||||
| 2026-02-17 | 13F | Scopus Asset Management, L.p. | Call | 0 | -100,00 | 0 | ||||
| 2026-02-17 | 13F | Sig Brokerage, Lp | Call | 20.000 | 1.098 | |||||
| 2025-11-12 | 13F | Transce3nd, LLC | 0 | -100,00 | 0 | |||||
| 2026-01-05 | 13F | Commons Capital, Llc | 5.323 | 16,15 | 292 | 5,80 | ||||
| 2026-02-03 | 13F | Cheviot Value Management, LLC | 27.330 | 0,00 | 2.295 | 33,28 | ||||
| 2026-02-10 | 13F | Goldman Sachs Group Inc | 88.829 | -20,83 | 4.876 | -28,10 | ||||
| 2026-02-17 | 13F | Garnet Equity Capital Holdings, Inc. | 39.686 | 0,00 | 2.178 | -9,17 | ||||
| 2026-02-17 | 13F | Equitable Holdings, Inc. | 13.034 | 7,39 | 715 | -2,46 | ||||
| 2026-02-10 | 13F | Fielder Capital Group LLC | 145.877 | 2,59 | 8.007 | -6,81 | ||||
| 2026-02-13 | 13F | Gts Securities Llc | 5.644 | -45,46 | 310 | -50,56 | ||||
| 2025-11-04 | 13F | Winnow Wealth Llc | 0 | -100,00 | 0 | |||||
| 2025-11-13 | 13F | Empowered Funds, LLC | 0 | -100,00 | 0 | |||||
| 2025-11-21 | 13F/A | CIBC Bancorp USA Inc. | 18.191 | 1.099 | ||||||
| 2026-01-26 | 13F | Nations Financial Group Inc, /ia/ /adv | 10.150 | -29,99 | 557 | -36,42 | ||||
| 2026-01-22 | 13F | Mh & Associates Securities Management Corp /adv | 38.039 | 2.088 | ||||||
| 2026-01-30 | 13F | Pekin Hardy Strauss, Inc. | 8.280 | 0,30 | 454 | -8,84 | ||||
| 2025-11-10 | 13F | X-Square Capital, LLC | 0 | -100,00 | 0 | |||||
| 2026-02-13 | 13F | Mariner, LLC | 12.008 | 28,79 | 659 | 17,05 | ||||
| 2026-02-12 | 13F | Hrt Financial Lp | 16.328 | 1 | ||||||
| 2026-01-29 | 13F | Comerica Bank | 2.912 | 0,00 | 160 | -9,14 | ||||
| 2026-01-08 | 13F | Maridea Wealth Management LLC | 0 | -100,00 | 0 | |||||
| 2026-02-05 | 13F | Thrivent Financial For Lutherans | 138.784 | 13,43 | 8 | 0,00 | ||||
| 2026-02-10 | 13F | Titan Global Capital Management Usa Llc | 26.219 | 1,61 | 1.439 | -7,70 | ||||
| 2026-02-02 | 13F | Truist Financial Corp | 9.484 | 2,15 | 521 | -7,31 | ||||
| 2026-01-12 | 13F | DAVENPORT & Co LLC | 6.499 | -0,55 | 357 | -9,64 | ||||
| 2026-02-06 | 13F | Global Retirement Partners, LLC | 502 | -44,35 | 28 | -50,00 | ||||
| 2026-02-02 | 13F | CENTRAL TRUST Co | 141 | 0,00 | 8 | -12,50 | ||||
| 2026-02-17 | 13F/A | Uniplan Investment Counsel, Inc. | 0 | -100,00 | 0 | |||||
| 2026-02-13 | 13F | MAI Capital Management | 2.690 | 0,00 | 148 | -9,26 | ||||
| 2026-02-10 | 13F | Foundations Investment Advisors, LLC | 22.763 | 1.249 | ||||||
| 2026-02-28 | 13F | Corecam Pte. Ltd. | 110.675 | 8,54 | 6.093 | -1,49 | ||||
| 2026-02-04 | 13F | BCJ Capital Management, LLC | 131.424 | 7.214 | ||||||
| 2026-02-13 | 13F | National Bank Of Canada /fi/ | 5.181 | -78,46 | 284 | -80,44 | ||||
| 2026-02-20 | 13F | Sunbelt Securities, Inc. | 206 | 3,00 | 11 | -8,33 | ||||
| 2025-10-28 | 13F | BFI Infinity Ltd. | 0 | -100,00 | 0 | -100,00 | ||||
| 2026-02-13 | 13F | Smartleaf Asset Management LLC | 1.504 | 82 | ||||||
| 2026-01-21 | 13F | Flagship Harbor Advisors, Llc | 880 | 48 | ||||||
| 2026-02-13 | 13F | Bridgewater Associates, LP | 0 | -100,00 | 0 | |||||
| 2026-01-15 | 13F | Fortitude Family Office, LLC | 424 | 1,19 | 23 | -8,00 | ||||
| 2026-02-13 | 13F | Bay Colony Advisory Group, Inc d/b/a Bay Colony Advisors | 0 | -100,00 | 0 | |||||
| 2026-01-20 | 13F | Arvest Investments, Inc. | 0 | -100,00 | 0 | -100,00 | ||||
| 2026-01-14 | 13F | Stegent Equity Advisors, Inc. | 64.357 | -9,99 | 3.533 | -18,24 | ||||
| 2026-01-30 | 13F | Carrera Capital Advisors | 36.451 | -11,86 | 2.001 | -19,97 | ||||
| 2025-11-13 | 13F | Total Investment Management Inc | 0 | -100,00 | 0 | |||||
| 2026-02-18 | 13F | GWM Advisors LLC | 3.495 | -39,20 | 192 | -44,96 | ||||
| 2026-01-27 | 13F | TD Waterhouse Canada Inc. | 76 | -89,20 | 4 | -90,48 | ||||
| 2026-04-10 | 13F | Ballew Advisors, Inc | 4.169 | 2,01 | 269 | 2,67 | ||||
| 2026-02-04 | 13F | Tls Advisors Llc | 0 | -100,00 | 0 | |||||
| 2025-11-12 | 13F | Creekmur Asset Management LLC | 57 | 54,05 | 3 | 200,00 | ||||
| 2025-11-19 | 13F | Captrust Financial Advisors | 0 | -100,00 | 0 | |||||
| 2026-02-11 | 13F | Signet Private Wealth LLC | 5.183 | 284 | ||||||
| 2026-02-09 | 13F | Bleakley Financial Group, LLC | 78.717 | 4,67 | 4.321 | -4,93 | ||||
| 2026-02-12 | 13F | Bank Of Montreal /can/ | 25.893 | -2,09 | 1.421 | -11,08 | ||||
| 2026-02-17 | 13F | Alpine Woods Capital Investors, Llc | 3.881 | -67,44 | 213 | -70,42 | ||||
| 2026-01-16 | 13F | Beaumont Financial Advisors, LLC | 4.306 | 10,30 | 236 | 0,43 | ||||
| 2025-10-27 | 13F | Kiker Wealth Management, LLC | 0 | -100,00 | 0 | |||||
| 2026-01-28 | 13F | Chicago Partners Investment Group LLC | 3.402 | -18,40 | 258 | -1,53 | ||||
| 2026-02-12 | 13F | Brown Brothers Harriman & Co | 1.520 | 0,00 | 83 | -8,79 | ||||
| 2025-10-30 | 13F | Glenorchy Capital Ltd | 0 | -100,00 | 0 | |||||
| 2026-03-12 | 13F/A | Peak6 Llc | Call | 0 | -100,00 | 0 | -100,00 | |||
| 2026-02-02 | 13F | JDM Financial Group LLC | 0 | -100,00 | 0 | -100,00 | ||||
| 2026-02-13 | 13F | Rafferty Asset Management, LLC | 63.483 | 64,34 | 3.485 | 49,27 | ||||
| 2026-01-14 | 13F | Spire Wealth Management | 825 | 0,12 | 45 | -8,16 | ||||
| 2026-02-10 | 13F/A | Northwestern Mutual Wealth Management Co | 15.187 | 544,34 | 834 | 486,62 | ||||
| 2026-02-10 | 13F | Evolution Wealth Management Inc. | 36 | 2 | ||||||
| 2026-02-13 | 13F | Stifel Financial Corp | 65.740 | 25,43 | 3.608 | 13,92 | ||||
| 2026-01-12 | 13F | Heartwood Wealth Advisors LLC | 0 | -100,00 | 0 | |||||
| 2026-02-10 | 13F | CIBC World Markets Inc. | 8.076 | -10,31 | 443 | -18,57 | ||||
| 2026-02-23 | 13F | Walser Wealth Management Company, A Ltd Liability Co | 22.663 | 1.244 | ||||||
| 2026-04-10 | 13F | Quaker Wealth Management, LLC | 297 | -1,66 | 19 | 12,50 | ||||
| 2026-04-10 | 13F | Affinity Wealth Management Llc | 3.690 | 0,00 | 233 | 15,35 | ||||
| 2026-02-13 | 13F | Walleye Trading LLC | Call | 107.400 | 5.895 | |||||
| 2026-02-12 | 13F | Cruiser Capital Advisors, Llc | 10.000 | 0,00 | 549 | -9,27 | ||||
| 2026-02-13 | 13F | Walleye Trading LLC | Put | 3.800 | 209 | |||||
| 2026-02-06 | 13F | Axxcess Wealth Management, Llc | 57.398 | -0,65 | 3.151 | -9,77 | ||||
| 2026-02-13 | 13F | Kestra Advisory Services, LLC | 0 | -100,00 | 0 | |||||
| 2026-02-17 | 13F | Asset One Wealth Management LLC | 26.840 | 1.924 | ||||||
| 2026-01-29 | 13F | IMC-Chicago, LLC | 65.806 | 3.612 | ||||||
| 2026-02-09 | 13F | Hantz Financial Services, Inc. | 340 | 0,00 | 0 | |||||
| 2026-01-15 | 13F | Lodestone Wealth Management LLC | 109 | 6 | ||||||
| 2026-02-06 | 13F | Larson Financial Group LLC | 3.908 | 2,12 | 215 | -7,36 | ||||
| 2026-02-12 | 13F | Sbe Llc Dba Cedar Cove Wealth Partners | 78.500 | 4.309 | ||||||
| 2025-11-10 | 13F | Citigroup Inc | 0 | -100,00 | 0 | |||||
| 2026-03-02 | 13F | Amicus Financial Advisors, LLC | 3.984 | 219 | ||||||
| 2026-01-30 | 13F | Us Bancorp \de\ | 2.800 | 40,00 | 154 | 27,50 | ||||
| 2026-01-27 | 13F | Rye Brook Capital LLC | 14.800 | -1,33 | 1 | |||||
| 2026-02-12 | 13F | Sprott Inc. | 25.099 | -5,22 | 1.378 | -13,94 | ||||
| 2026-01-28 | 13F | Geneos Wealth Management Inc. | 27.732 | -4,26 | 1.522 | -13,03 | ||||
| 2026-01-29 | 13F | UMA Financial Services, Inc. | 3 | 0,00 | 0 | |||||
| 2026-02-17 | 13F | SIH Partners, LLLP | 0 | -100,00 | 0 | |||||
| 2026-02-17 | 13F | Clear Street Markets Llc | 7.800 | 428 | ||||||
| 2026-01-15 | 13F | Brookstone Capital Management | 25.732 | 62,35 | 1.412 | 47,54 | ||||
| 2026-01-22 | 13F | Apollon Wealth Management, LLC | 11.947 | -24,37 | 656 | -31,34 | ||||
| 2026-02-13 | 13F | Diametric Capital, LP | 12.535 | 227,97 | 688 | 199,13 | ||||
| 2026-02-13 | 13F | Sunbeam Capital Management, LLC | 14.158 | 0,13 | 777 | -9,02 | ||||
| 2026-02-13 | 13F | Fiduciary Trust Co | 6.805 | 0,00 | 374 | -9,25 | ||||
| 2026-02-12 | 13F | Intesa Sanpaolo Wealth Management | 5.950 | 327 | ||||||
| 2026-02-03 | 13F | Sequoia Financial Advisors, LLC | 6.012 | 6,26 | 330 | -3,23 | ||||
| 2026-02-12 | 13F | Principal Securities, Inc. | 7.145 | 12,54 | 392 | 2,35 | ||||
| 2026-02-11 | 13F | Parallel Advisors, LLC | 1.204 | 5,61 | 66 | -2,94 |