Grundlæggende statistik
| Institutionelle aktier (lange) | 71.106.722 - 42,44% (ex 13D/G) - change of -9,29MM shares -11,55% MRQ |
| Institutionel værdi (lang) | $ 3.625.421 USD ($1000) |
Institutionelt ejerskab og aktionærer
Millicom International Cellular S.A. (US:TIGO) har 333 institutionelle ejere og aktionærer, der har indsendt 13D/G- eller 13F-formularer til Securities Exchange Commission (SEC). Disse institutioner har i alt 71,106,722 aktier. Største aktionærer omfatter Dodge & Cox, Jpmorgan Chase & Co, BlackRock, Inc., Price T Rowe Associates Inc /md/, Brandes Investment Partners, Lp, Barclays Plc, State Street Corp, Swedbank AB, Perpetual Ltd, and Boston Partners .
Millicom International Cellular S.A. (NasdaqGS:TIGO) institutionel ejerskabsstruktur viser aktuelle positioner i virksomheden efter institutioner og fonde, samt seneste ændringer i positionsstørrelse. Større aktionærer kan omfatte individuelle investorer, investeringsforeninger, hedgefonde eller institutioner. Skema 13D angiver, at investoren besidder (eller besidder) mere end 5 % af virksomheden og har til hensigt (eller har til hensigt at) aktivt at forfølge en ændring i forretningsstrategi. Skema 13G indikerer en passiv investering på over 5%.
The share price as of April 24, 2026 is 84,06 / share. Previously, on April 28, 2025, the share price was 33,95 / share. This represents an increase of 147,60% over that period.

Fondens stemningsscore
Fund Sentiment Score (fka Ownership Accumulation Score) finder de aktier, der bliver mest købt af fonde. Det er resultatet af en sofistikeret, multi-faktor kvantitativ model, der identificerer virksomheder med de højeste niveauer af institutionel akkumulering. Scoringsmodellen bruger en kombination af den samlede stigning i oplyste ejere, ændringerne i porteføljeallokeringer i disse ejere og andre målinger. Tallet går fra 0 til 100, hvor højere tal indikerer et højere niveau af akkumulering for sine jævnaldrende, og 50 er gennemsnittet.
Opdateringsfrekvens: Dagligt
Se Ownership Explorer, som giver en liste over højest rangerende virksomheder.
AI+ Ask Fintel’s AI assistant about Millicom International Cellular S.A..
Select a question to share a public post with an AI-crafted answer.
Thinking of good questions…
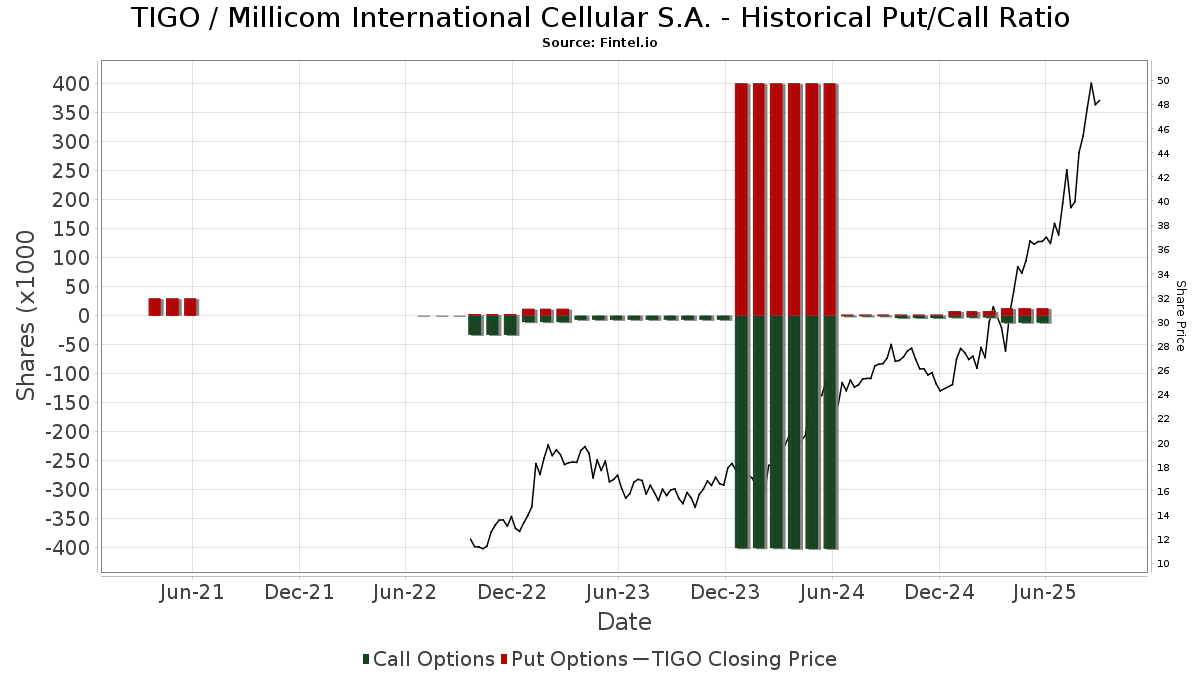
Institutionel Put/Call-forhold
Ud over at indberette standardaktie- og gældsudstedelser skal institutter med mere end 100 mill. aktiver under forvaltning også oplyse deres put- og call-optionsbeholdninger. Da salgsoptioner generelt indikerer negativ stemning, og købsoptioner indikerer positiv stemning, kan vi få en fornemmelse af den overordnede institutionelle stemning ved at plotte forholdet mellem put og kald. Diagrammet til højre viser det historiske put/call-forhold for dette instrument.
Brug af Put/Call Ratio som en indikator for investorernes stemning overvinder en af de vigtigste mangler ved at bruge totalt institutionelt ejerskab, som er, at en betydelig mængde af aktiver under forvaltning investeres passivt for at spore indekser. Passivt forvaltede fonde køber typisk ikke optioner, så indikatoren for put/call-forholdet følger mere nøje følelsen af aktivt forvaltede fonde.
13D/G-arkivering
Vi præsenterer 13D/G ansøgninger separat fra 13F ansøgninger på grund af den forskellige behandling af SEC. 13D/G-ansøgninger kan indgives af grupper af investorer (med én ledende), hvorimod 13F-ansøgninger ikke kan. Dette resulterer i situationer, hvor en investor kan indsende en 13D/G, der rapporterer én værdi for de samlede aktier (der repræsenterer alle de aktier, der ejes af investorgruppen), men derefter indsender en 13F, der rapporterer en anden værdi for de samlede aktier (der udelukkende repræsenterer deres egne) ejendomsret). Det betyder, at aktieejerskab af 13D/G-arkiver og 13F-arkiveringer ofte ikke er direkte sammenlignelige, så vi præsenterer dem separat.
Bemærk: Fra den 16. maj 2021 viser vi ikke længere ejere, der ikke har indsendt en 13D/G inden for det seneste år. Tidligere viste vi den fulde historie af 13D/G-arkiver. Generelt skal enheder, der er forpligtet til at indgive 13D/G-ansøgninger, indgive mindst årligt, før de indsender en afsluttende ansøgning. Dog forlader fonde nogle gange positioner uden at indsende en afsluttende ansøgning (dvs. de afvikler), så visning af den fulde historie resulterede nogle gange i forvirring om det nuværende ejerskab. For at undgå forvirring viser vi nu kun 'aktuelle' ejere - det vil sige - ejere, der har anmeldt inden for det seneste år.
Upgrade to unlock premium data.
| Fil dato | Form | Investor | Forrige Aktier |
Seneste Aktier |
Δ Aktier (Procent) |
Ejendomsret (Procent) |
Δ Ejerskab (Procent) |
|
|---|---|---|---|---|---|---|---|---|
| 2026-03-13 | Atlas Investissement | 70,470,018 | 73,820,018 | 4.75 | 44.10 | 4.50 |
13F og NPORT arkivering
Detaljer om 13F-arkivering er gratis. Detaljer om NP-ansøgninger kræver et premium-medlemskab. Grønne rækker angiver nye positioner. Røde rækker angiver lukkede positioner. Klik på linket ikon for at se den fulde transaktionshistorik.
Opgrader
for at låse premium-data op og eksportere til Excel ![]() .
.
| Fil dato | Kilde | Investor | Type | Gennemsnitlig pris (Øst) |
Aktier | Δ Aktier (%) |
Rapporteret Værdi ($1000) |
Δ Værdi (%) |
Port Alloc (%) |
|
|---|---|---|---|---|---|---|---|---|---|---|
| 2026-02-11 | 13F | Brand Asset Management Group, Inc. | 6.463 | 358 | ||||||
| 2025-11-14 | 13F | Millennium Management Llc | 0 | -100,00 | 0 | -100,00 | ||||
| 2026-01-27 | 13F | WealthCollab, LLC | 143 | 0,00 | 8 | 16,67 | ||||
| 2026-02-13 | 13F | Wexford Capital Lp | 40.000 | 0,00 | 2.218 | 14,22 | ||||
| 2026-02-17 | 13F | Nomura Holdings Inc | 48.834 | 35,52 | 2.707 | 54,77 | ||||
| 2026-02-13 | 13F | Causeway Capital Management Llc | 215.950 | 468,29 | 11.972 | 549,24 | ||||
| 2026-04-06 | 13F | CX Institutional | 33.517 | -81,20 | 3 | -77,78 | ||||
| 2026-04-14 | 13F | Perpetual Ltd | 1.759.938 | -14,11 | 131.890 | 16,10 | ||||
| 2026-04-17 | 13F | AdvisorNet Financial, Inc | 250 | 19 | ||||||
| 2026-04-22 | 13F | Sterling Capital Management LLC | 5.772 | -53,93 | 433 | -37,75 | ||||
| 2026-02-10 | 13F | Future Fund LLC | 81.240 | 24,87 | 4.504 | 42,64 | ||||
| 2026-01-28 | 13F | Geneos Wealth Management Inc. | 253 | 110,83 | 14 | 180,00 | ||||
| 2026-04-13 | 13F | True Wealth Design, LLC | 18 | 1 | ||||||
| 2026-01-23 | 13F | Robeco Institutional Asset Management B.V. | 0 | -100,00 | 0 | |||||
| 2026-02-11 | 13F | Zions Bancorporation, National Association /ut/ | 22 | 1 | ||||||
| 2026-01-26 | 13F | Childress Capital Advisors, Llc | 6.258 | 347 | ||||||
| 2026-01-20 | 13F | Harbor Capital Advisors, Inc. | 499 | -6,20 | 0 | |||||
| 2026-02-12 | 13F | MetLife Investment Management, LLC | 1.632 | -4,73 | 90 | 8,43 | ||||
| 2026-02-17 | 13F | State Of Wisconsin Investment Board | 0 | -100,00 | 0 | |||||
| 2026-02-09 | 13F | Atlantic Trust, LLC | 85 | 117,95 | 5 | 300,00 | ||||
| 2026-02-12 | 13F | Triumph Capital Management | 300 | 17 | ||||||
| 2026-02-13 | 13F | Truvestments Capital Llc | 8.850 | 491 | ||||||
| 2026-04-21 | 13F | Pinnacle Wealth Management Advisory Group, LLC | 5.321 | 399 | ||||||
| 2026-02-10 | 13F | Connor, Clark & Lunn Investment Management Ltd. | 247.913 | 111,76 | 13.744 | 141,89 | ||||
| 2026-04-20 | 13F | Tower View Investment Management & Research LLC | 23 | 0,00 | 0 | |||||
| 2026-02-11 | 13F | Brandes Investment Partners, Lp | 4.836.505 | -17,12 | 268.136 | -5,33 | ||||
| 2026-02-17 | 13F | Quantedge Capital Pte Ltd | 12.000 | 140,00 | 665 | 174,79 | ||||
| 2026-02-06 | 13F | Addison Advisors LLC | 2 | 0,00 | 0 | |||||
| 2026-04-23 | 13F | Spinnaker Trust | 34.000 | 385,71 | 2.548 | 556,44 | ||||
| 2026-02-17 | 13F | Point72 Asset Management, L.P. | Put | 16.700 | 926 | |||||
| 2026-02-17 | 13F | Point72 Asset Management, L.P. | Call | 37.700 | 2.090 | |||||
| 2026-04-20 | 13F | Kestra Private Wealth Services, Llc | 30.436 | -0,71 | 2.281 | 34,20 | ||||
| 2026-01-28 | 13F | Kingswood Wealth Advisors, Llc | 5.809 | -39,01 | 322 | -30,30 | ||||
| 2026-04-13 | 13F | Massmutual Trust Co Fsb/adv | 185 | -9,76 | 14 | 18,18 | ||||
| 2026-02-12 | 13F | Swiss National Bank | 200.822 | -0,15 | 11.134 | 14,04 | ||||
| 2026-02-12 | 13F | Commonwealth Equity Services, Llc | 15.038 | -5,89 | 834 | |||||
| 2025-10-29 | 13F | Inspire Advisors, LLC | 0 | -100,00 | 0 | |||||
| 2026-02-18 | 13F | EP Wealth Advisors, Inc. | 3.921 | 217 | ||||||
| 2026-02-06 | 13F | Handelsbanken Fonder AB | 28.500 | -19,49 | 2 | 0,00 | ||||
| 2026-02-10 | 13F | Rothschild Investment Llc | 81 | 305,00 | 4 | |||||
| 2026-01-30 | 13F | Mitsubishi UFJ Trust & Banking Corp | 9.068 | 503 | ||||||
| 2026-02-17 | 13F | Schonfeld Strategic Advisors LLC | 23.073 | -38,95 | 1.279 | -30,26 | ||||
| 2025-11-06 | 13F | Abich Financial Wealth Management LLC | 3.167 | 154 | ||||||
| 2026-04-06 | 13F | GAMMA Investing LLC | 832 | 45,20 | 62 | 100,00 | ||||
| 2026-02-17 | 13F | Two Sigma Investments, Lp | 24.042 | -11,04 | 1.333 | 1,60 | ||||
| 2026-02-13 | 13F | Stifel Financial Corp | 43.331 | 16,77 | 2.402 | 33,37 | ||||
| 2026-02-13 | 13F | Verition Fund Management LLC | 76.390 | 0,00 | 4.235 | 14,24 | ||||
| 2026-02-17 | 13F | Tudor Investment Corp Et Al | 7.219 | 400 | ||||||
| 2026-04-02 | 13F | Byrne Asset Management LLC | 1.474 | -1,34 | 22 | -4,35 | ||||
| 2025-11-04 | 13F | State of Wyoming | 0 | -100,00 | 0 | |||||
| 2026-04-22 | 13F | Janney Montgomery Scott LLC | 0 | -100,00 | 0 | |||||
| 2026-02-12 | 13F | Renaissance Technologies Llc | 462.392 | -34,00 | 25.635 | -24,62 | ||||
| 2026-02-17 | 13F | Sagewood Asset Management LP | 4.109 | 228 | ||||||
| 2026-02-13 | 13F | National Bank Of Canada /fi/ | 8.942 | 496 | ||||||
| 2026-04-15 | 13F | Archford Capital Strategies, LLC | 0 | -100,00 | 0 | |||||
| 2026-01-29 | 13F | Calamos Advisors LLC | 79.550 | -26,50 | 4.410 | -16,05 | ||||
| 2026-02-13 | 13F | Prudential Financial Inc | 0 | -100,00 | 0 | |||||
| 2026-04-20 | 13F | North of South Capital LLP | 0 | -100,00 | 0 | |||||
| 2026-02-17 | 13F | Aqr Capital Management Llc | 406.444 | 1.865,49 | 22.533 | 2.146,56 | ||||
| 2026-04-09 | 13F | Park Place Capital Corp | 260 | -15,58 | 19 | 11,76 | ||||
| 2026-02-13 | 13F | Martingale Asset Management L P | 0 | -100,00 | 0 | |||||
| 2026-04-06 | 13F | Versant Capital Management, Inc | 30 | 2 | ||||||
| 2026-04-20 | 13F | CWA Asset Management Group, LLC | 25.355 | 18,90 | 1.900 | 60,74 | ||||
| 2026-02-11 | 13F | Meeder Asset Management Inc | 141 | 0,00 | 8 | 16,67 | ||||
| 2026-04-21 | 13F | OneAscent Family Office, LLC | 3.549 | 266 | ||||||
| 2025-11-14 | 13F | Skopos Labs, Inc. | 0 | -100,00 | 0 | |||||
| 2026-04-24 | 13F | UMA Financial Services, Inc. | 29 | 0,00 | 2 | 100,00 | ||||
| 2026-01-27 | 13F | Zurcher Kantonalbank (Zurich Cantonalbank) | 46.876 | 17,57 | 2.599 | 34,26 | ||||
| 2026-04-14 | 13F | Nbc Securities, Inc. | 4.140 | -1,71 | 310 | 33,05 | ||||
| 2026-04-23 | 13F | S.E.E.D. Planning Group LLC | 4.000 | 0,00 | 300 | 35,29 | ||||
| 2026-02-13 | 13F | Dodge & Cox | 8.133.132 | -3,73 | 450.901 | 9,95 | ||||
| 2026-02-17 | 13F | Jones Financial Companies Lllp | 372 | 23,18 | 21 | 42,86 | ||||
| 2026-02-09 | 13F | Keating Financial Advisory Services, Inc. | 6 | 0 | ||||||
| 2026-04-14 | 13F | USA Financial Portformulas Corp | 3.051 | -22,95 | 229 | 4,11 | ||||
| 2026-04-24 | 13F | Marathon Asset Mgmt Ltd | 1.107.258 | 0,57 | 82.978 | 35,86 | ||||
| 2026-02-13 | 13F | Wells Fargo & Company/mn | 142.863 | 149,61 | 7.920 | 185,10 | ||||
| 2026-04-14 | 13F | Seven Mile Advisory | 4.093 | 0,61 | 307 | 36,00 | ||||
| 2026-02-04 | 13F | Plato Investment Management Ltd | 0 | -100,00 | 0 | -100,00 | ||||
| 2025-11-12 | 13F | Western Standard LLC | 0 | -100,00 | 0 | |||||
| 2026-02-11 | 13F | Jpmorgan Chase & Co | 6.713.607 | 3,93 | 372.202 | 18,70 | ||||
| 2026-02-17 | 13F | Northern Trust Corp | 1.252.949 | -1,43 | 69.463 | 12,59 | ||||
| 2025-11-10 | 13F | Moon Capital Management Lp | 0 | -100,00 | 0 | |||||
| 2026-02-17 | 13F | Citadel Advisors Llc | Call | 33.100 | -39,71 | 1.835 | -31,12 | |||
| 2026-02-17 | 13F | Citadel Advisors Llc | 65.830 | 3.650 | ||||||
| 2026-02-06 | 13F | Tredje AP-fonden | 1.090.531 | 60.459 | ||||||
| 2026-02-12 | 13F | Empirical Finance, LLC | 17.082 | 88,65 | 947 | 115,72 | ||||
| 2026-02-17 | 13F | Citadel Advisors Llc | Put | 13.000 | 103,12 | 721 | 132,26 | |||
| 2026-02-06 | 13F | Covestor Ltd | 5.475 | 1.781,44 | 0 | |||||
| 2026-02-11 | 13F | Simplex Trading, Llc | 42.040 | -18,14 | 2.331 | 116.400,00 | ||||
| 2026-02-10 | 13F | Commonwealth Of Pennsylvania Public School Empls Retrmt Sys | 142.013 | 22,11 | 7.873 | 39,47 | ||||
| 2026-02-17 | 13F | Aperture Investors, LLC | 0 | -100,00 | 0 | |||||
| 2026-02-13 | 13F | Brown Advisory Inc | 4.000 | 222 | ||||||
| 2026-02-11 | 13F | Brandywine Global Investment Management, LLC | 110.551 | 50,24 | 6.129 | 71,60 | ||||
| 2026-02-13 | 13F | Centiva Capital, LP | 5.536 | 307 | ||||||
| 2026-02-05 | 13F | Atria Investments Llc | 12.612 | -2,31 | 699 | 11,66 | ||||
| 2026-02-13 | 13F | Golden State Wealth Management, LLC | 207 | 11 | ||||||
| 2025-11-13 | 13F | Dynamic Technology Lab Private Ltd | 0 | -100,00 | 0 | |||||
| 2026-02-11 | 13F | Picton Mahoney Asset Management | 6.824 | 378 | ||||||
| 2026-02-06 | 13F | Pnc Financial Services Group, Inc. | 727 | 10,32 | 40 | 29,03 | ||||
| 2026-02-12 | 13F | Counterpoint Mutual Funds LLC | 0 | -100,00 | 0 | |||||
| 2026-04-02 | 13F | Marex Group plc | 14.400 | 436 | ||||||
| 2026-02-05 | 13F | Gamco Investors, Inc. Et Al | 651.150 | -9,08 | 36.100 | 3,84 | ||||
| 2026-01-28 | 13F | West Michigan Advisors, Llc | 47.870 | -10,54 | 2.654 | 2,16 | ||||
| 2026-02-12 | 13F | Quadrant Capital Group Llc | 891 | 0,00 | 49 | 13,95 | ||||
| 2026-01-30 | 13F | Precision Wealth Strategies, LLC | 18.744 | 12,77 | 1.039 | 28,91 | ||||
| 2026-02-17 | 13F | PDT Partners, LLC | 225.909 | 0,00 | 12.524 | 14,22 | ||||
| 2026-02-17 | 13F | Dark Forest Capital Management Lp | 28.904 | -6,10 | 1.602 | 7,23 | ||||
| 2026-01-30 | 13F | Us Bancorp \de\ | 476 | 17,24 | 26 | 36,84 | ||||
| 2026-02-05 | 13F | Allworth Financial LP | 455 | 1.129,73 | 25 | 2.400,00 | ||||
| 2026-02-12 | 13F | Index Technologies Group LLC | 10.517 | 583 | ||||||
| 2026-02-13 | 13F | Smartleaf Asset Management LLC | 455 | -11,82 | 25 | 4,17 | ||||
| 2025-11-05 | 13F | SPC Financial, Inc. | 4.198 | 204 | ||||||
| 2026-02-10 | 13F | One Capital Management, LLC | 62.959 | 42,19 | 3.490 | 62,40 | ||||
| 2026-02-13 | 13F | Atlas Capital Advisors Llc | 13.230 | 32,66 | 733 | 96,51 | ||||
| 2026-04-07 | 13F | Farther Finance Advisors, LLC | 517 | -52,79 | 40 | -35,00 | ||||
| 2026-02-12 | 13F | Johnson Financial Group, Inc. | 244 | 4 | ||||||
| 2026-02-13 | 13F | Ubs Asset Management Americas Inc | 315.380 | 17.485 | ||||||
| 2025-11-14 | 13F | Cubist Systematic Strategies, LLC | Put | 14.600 | 709 | |||||
| 2026-02-13 | 13F | Morgan Stanley | 847.747 | 38,13 | 46.999 | 57,77 | ||||
| 2025-11-14 | 13F | Cubist Systematic Strategies, LLC | Call | 27.900 | 1.354 | |||||
| 2026-02-13 | 13F | Cullen Capital Management, LLC | 656.608 | 2,11 | 36.402 | 16,63 | ||||
| 2026-01-22 | 13F | Massachusetts Financial Services Co /ma/ | 31.517 | 1.747 | ||||||
| 2026-02-12 | 13F | Polen Capital Management Llc | 0 | -100,00 | 0 | |||||
| 2026-02-17 | 13F | BTG Pactual Asset Management US LLC | 78.787 | 23,23 | 4.368 | 82,34 | ||||
| 2026-01-28 | 13F | Teacher Retirement System Of Texas | 40.264 | 7,80 | 2.232 | 23,18 | ||||
| 2026-02-17 | 13F | Tower Research Capital LLC (TRC) | 2.207 | 424,23 | 122 | 510,00 | ||||
| 2026-02-03 | 13F | SBI Securities Co., Ltd. | 3.967 | 18,24 | 220 | 35,19 | ||||
| 2026-02-17 | 13F | MIRAE ASSET GLOBAL ETFS HOLDINGS Ltd. | 45.868 | 2.543 | ||||||
| 2026-02-17 | 13F | Mercer Global Advisors Inc /adv | 4.788 | 265 | ||||||
| 2026-02-17 | 13F | Susquehanna Portfolio Strategies, LLC | 111.511 | -37,25 | 6.182 | -28,32 | ||||
| 2026-02-11 | 13F | LPL Financial LLC | 35.474 | 27,00 | 1.967 | 45,09 | ||||
| 2026-02-05 | 13F | GABELLI & Co INVESTMENT ADVISERS, INC. | 5.000 | 0,00 | 277 | 14,46 | ||||
| 2026-02-06 | 13F | Lsv Asset Management | 78.180 | 0,00 | 4 | 33,33 | ||||
| 2026-02-17 | 13F | Canada Pension Plan Investment Board | 299.060 | 58,78 | 16.580 | 81,35 | ||||
| 2026-02-13 | 13F | Sei Investments Co | 415.419 | 55,25 | 23.031 | 77,32 | ||||
| 2026-02-13 | 13F | Caitong International Asset Management Co., Ltd | 0 | -100,00 | 0 | |||||
| 2026-01-29 | 13F | UBS Group AG | 356.286 | -32,60 | 19.752 | -23,02 | ||||
| 2026-02-11 | 13F | Los Angeles Capital Management Llc | 220.619 | -28,22 | 10.321 | -30,82 | ||||
| 2026-02-12 | 13F | BRYN MAWR TRUST Co | 0 | -100,00 | 0 | -100,00 | ||||
| 2026-02-12 | 13F | Federation des caisses Desjardins du Quebec | 7.678 | 426 | ||||||
| 2026-02-13 | 13F | Neo Ivy Capital Management | 0 | -100,00 | 0 | -100,00 | ||||
| 2025-11-14 | 13F | Wolverine Trading, Llc | Call | 0 | -100,00 | 0 | ||||
| 2025-11-14 | 13F | Wolverine Trading, Llc | Put | 0 | -100,00 | 0 | ||||
| 2026-02-17 | 13F | Magnetar Financial LLC | 9.817 | 544 | ||||||
| 2026-02-05 | 13F | Thrivent Financial For Lutherans | 3.839 | 0 | ||||||
| 2026-02-10 | 13F | Triodos Investment Management BV | 607.000 | -14,39 | 33.440 | -2,77 | ||||
| 2026-01-26 | 13F | Strid Group, LLC | 3.848 | 213 | ||||||
| 2026-04-22 | 13F | ABN AMRO Bank N.V. | 17.260 | 1.301 | ||||||
| 2026-02-17 | 13F | Raymond James Financial Inc | 65.251 | 34,45 | 3.618 | 53,59 | ||||
| 2026-02-19 | 13F | Invesco Ltd. | 181.118 | 14,79 | 10.041 | 31,12 | ||||
| 2025-11-14 | 13F | Investor Ab | 0 | -100,00 | 0 | |||||
| 2026-02-13 | 13F | Y-Intercept (Hong Kong) Ltd | 52.099 | -20,17 | 2.888 | -8,81 | ||||
| 2026-02-10 | 13F | Bnp Paribas Arbitrage, Sa | 47.630 | 68,70 | 2.641 | 92,70 | ||||
| 2026-02-10 | 13F | Goldman Sachs Group Inc | 450.091 | 85,59 | 24.953 | 111,99 | ||||
| 2026-02-14 | 13F | Rockefeller Capital Management L.P. | 375 | 0,00 | 21 | 11,11 | ||||
| 2026-02-03 | 13F | Crossmark Global Holdings, Inc. | 413.983 | 4,05 | 22.951 | 18,85 | ||||
| 2026-02-09 | 13F | Legal & General Group Plc | 249.096 | 4,55 | 13.810 | 19,41 | ||||
| 2026-02-13 | 13F | Police & Firemen's Retirement System of New Jersey | 80.199 | -4,39 | 4.446 | 9,21 | ||||
| 2026-02-13 | 13F | Peak6 Llc | 0 | -100,00 | 0 | |||||
| 2026-04-22 | 13F | Spire Wealth Management | 0 | -100,00 | 0 | |||||
| 2026-02-11 | 13F | Franklin Resources Inc | 371.022 | 30,66 | 20.569 | 49,23 | ||||
| 2026-02-13 | 13F | Bridgewater Associates, LP | 0 | -100,00 | 0 | |||||
| 2025-11-14 | 13F | Snowden Capital Advisors LLC | 0 | -100,00 | 0 | -100,00 | ||||
| 2026-04-21 | 13F | Financial Consulate, Inc | 17 | 0,00 | 1 | |||||
| 2026-04-13 | 13F | Artemis Investment Management LLP | 32.183 | 2.412 | ||||||
| 2026-02-06 | 13F | Gsa Capital Partners Llp | 5.211 | 0 | ||||||
| 2026-02-17 | 13F | Two Sigma Advisers, Lp | 68.400 | -6,68 | 3.792 | 6,61 | ||||
| 2026-02-09 | 13F | William Blair Investment Management, Llc | 125.175 | -2,47 | 6.940 | 11,38 | ||||
| 2026-04-24 | 13F | Root Financial Partners, LLC | 15 | 1 | ||||||
| 2026-02-13 | 13F | Quarry LP | 30 | -98,98 | 2 | -99,30 | ||||
| 2026-02-13 | 13F | Absolute Gestao de Investimentos Ltda. | 0 | -100,00 | 0 | |||||
| 2026-02-13 | 13F | State Street Corp | 2.279.268 | 14,94 | 126.364 | 31,28 | ||||
| 2026-04-17 | 13F | IFC & Insurance Marketing, Inc. | 0 | -100,00 | 0 | |||||
| 2026-02-17 | 13F | Numerai GP LLC | 7.748 | 430 | ||||||
| 2026-04-13 | 13F | Highland Capital Management, Llc | 5.995 | 48,87 | 449 | 101,35 | ||||
| 2026-02-17 | 13F | Aster Capital Management (DIFC) Ltd | 1.100 | 61 | ||||||
| 2026-02-13 | 13F | Treasurer of the State of North Carolina | 226.611 | 311,18 | 13 | 500,00 | ||||
| 2026-02-17 | 13F | Price T Rowe Associates Inc /md/ | 4.936.030 | -15,36 | 274 | -3,53 | ||||
| 2026-01-21 | 13F | Oak Thistle LLC | 0 | -100,00 | 0 | |||||
| 2026-02-10 | 13F | Intech Investment Management Llc | 10.804 | 599 | ||||||
| 2026-04-21 | 13F | OneAscent Wealth Management LLC | 6.800 | -10,02 | 510 | 21,77 | ||||
| 2026-02-17 | 13F | Fmr Llc | 557.358 | 89,48 | 30.900 | 116,41 | ||||
| 2026-02-05 | 13F | Bessemer Group Inc | 244 | 0,00 | 0 | |||||
| 2026-02-06 | 13F | Sierra Summit Advisors Llc | 17.661 | 979 | ||||||
| 2026-02-13 | 13F | Squarepoint Ops LLC | 51.152 | 2.836 | ||||||
| 2026-04-08 | 13F | Bond & Devick Financial Network, Inc. | 6.000 | 0,00 | 450 | 35,24 | ||||
| 2026-02-13 | 13F | Barclays Plc | 2.860.379 | -1,20 | 158.579 | 12,84 | ||||
| 2026-02-17 | 13F | Bank Of America Corp /de/ | 199.831 | 170,10 | 11.079 | 208,49 | ||||
| 2026-02-12 | 13F | State Board Of Administration Of Florida Retirement System | 31.410 | 135,10 | 1.741 | 168,67 | ||||
| 2025-11-14 | 13F | Southeastern Asset Management Inc/tn/ | 0 | -100,00 | 0 | |||||
| 2026-02-17 | 13F | TCG Advisory Services, LLC | 4.122 | 229 | ||||||
| 2026-02-12 | 13F | Federated Hermes, Inc. | 173 | 32,06 | 10 | 50,00 | ||||
| 2026-02-12 | 13F | Penserra Capital Management LLC | 6.114 | 0 | ||||||
| 2026-02-04 | 13F | Swiss Life Asset Management Ltd | 8.644 | 76,19 | 479 | 101,26 | ||||
| 2026-01-23 | 13F | Assetmark, Inc | 85.059 | 31,13 | 4.716 | 49,78 | ||||
| 2026-04-16 | 13F | Evolve Private Wealth, Llc | 19.607 | 5,04 | 1.469 | 42,07 | ||||
| 2026-04-24 | 13F | Raiffeisen Bank International AG | 49.661 | 3,46 | 3.632 | 37,33 | ||||
| 2026-01-28 | 13F | Klp Kapitalforvaltning As | 124.697 | -3,93 | 6.913 | 9,73 | ||||
| 2026-02-11 | 13F | Fjarde Ap-fonden /fourth Swedish National Pension Fund | 1.000.000 | 55.440 | ||||||
| 2026-04-24 | 13F | Triasima Portfolio Management inc. | 203.790 | 0,18 | 15.272 | 35,43 | ||||
| 2025-11-10 | 13F | Jupiter Asset Management Ltd | 0 | -100,00 | 0 | |||||
| 2026-02-10 | 13F | Quantbot Technologies LP | 9.335 | -79,69 | 518 | -76,83 | ||||
| 2026-02-05 | 13F | Amalgamated Bank | 7.000 | 21,95 | 0 | |||||
| 2026-02-06 | 13F | Larson Financial Group LLC | 170 | 269,57 | 9 | 350,00 | ||||
| 2026-03-02 | 13F | Reflection Asset Management | 21 | 0 | ||||||
| 2026-02-12 | 13F | Principal Securities, Inc. | 0 | -100,00 | 0 | |||||
| 2026-04-22 | 13F | Stone House Investment Management, LLC | 60 | 0,00 | 4 | 33,33 | ||||
| 2026-02-12 | 13F | Jane Street Group, Llc | 51.267 | 268,30 | 2.842 | 321,04 | ||||
| 2026-02-11 | 13F | Parallel Advisors, LLC | 47 | 0,00 | 3 | 0,00 | ||||
| 2026-02-09 | 13F | Hartland & Co., LLC | 64 | -58,71 | 4 | -57,14 | ||||
| 2026-04-10 | 13F | Oxinas Partners Wealth Management LLC | 3.703 | 278 | ||||||
| 2026-02-17 | 13F | Mirabella Financial Services Llp | 18.726 | -40,94 | 1.038 | -32,55 | ||||
| 2026-02-12 | 13F | denkapparat Operations GmbH | 4.578 | 254 | ||||||
| 2026-04-24 | 13F | LB Partners LLC | 143.000 | -38,36 | 10.716 | -16,68 | ||||
| 2026-01-15 | 13F | Nisa Investment Advisors, Llc | 83.896 | 1,55 | 4.651 | 15,99 | ||||
| 2026-04-15 | 13F | Merit Financial Group, LLC | 5.586 | 49,04 | 419 | 101,93 | ||||
| 2026-02-18 | 13F | Mackenzie Financial Corp | 457.752 | 1,98 | 25.168 | 15,51 | ||||
| 2026-04-21 | 13F | OneAscent Financial Services LLC | 7.877 | -21,92 | 590 | 5,55 | ||||
| 2026-02-13 | 13F | Toroso Investments, LLC | 10.677 | 52,14 | 592 | 73,82 | ||||
| 2026-02-17 | 13F | Cetera Investment Advisers | 10.935 | 4,07 | 606 | 18,82 | ||||
| 2026-01-26 | 13F | Private Trust Co Na | 47 | 4,44 | 3 | 0,00 | ||||
| 2026-02-17 | 13F | California State Teachers Retirement System | 112.877 | -2,21 | 6.258 | 11,69 | ||||
| 2026-02-06 | 13F | HighTower Advisors, LLC | 6.652 | -14,99 | 369 | -2,90 | ||||
| 2026-02-11 | 13F | Vestcor Inc | 107.009 | 31,90 | 6 | 66,67 | ||||
| 2026-02-11 | 13F | Illinois Municipal Retirement Fund | 63.210 | 3.504 | ||||||
| 2026-02-05 | 13F | Cambridge Investment Research Advisors, Inc. | 8.897 | 0 | ||||||
| 2025-11-14 | 13F | Twinbeech Capital Lp | 0 | -100,00 | 0 | |||||
| 2026-02-13 | 13F | Charles Schwab Investment Management Inc | 200.624 | -5,65 | 11.123 | 7,76 | ||||
| 2026-02-17 | 13F | Balyasny Asset Management Llc | 0 | -100,00 | 0 | |||||
| 2026-02-13 | 13F | Strategic Global Advisors, LLC | 7.360 | 408 | ||||||
| 2026-04-23 | 13F | Ewa, Llc | 7.107 | 1,17 | 533 | 36,76 | ||||
| 2026-02-11 | 13F | Allianz Asset Management GmbH | 6.343 | 352 | ||||||
| 2026-02-12 | 13F | Jane Street Group, Llc | Put | 8.900 | 493 | |||||
| 2026-02-12 | 13F | Jane Street Group, Llc | Call | 108.600 | -2,51 | 6.021 | 11,34 | |||
| 2026-02-13 | 13F | Marshall Wace, Llp | 0 | -100,00 | 0 | |||||
| 2026-02-13 | 13F | Walleye Capital LLC | 22.200 | 1.231 | ||||||
| 2026-04-15 | 13F | Activest Wealth Management | 0 | -100,00 | 0 | |||||
| 2026-02-06 | 13F | EverSource Wealth Advisors, LLC | 2.470 | 32,30 | 137 | 51,11 | ||||
| 2026-02-13 | 13F | Victory Capital Management Inc | 810.521 | 8,87 | 44.935 | 24,34 | ||||
| 2026-02-17 | 13F | Creative Planning | 6.317 | 27,51 | 350 | 45,83 | ||||
| 2026-02-17 | 13F | Boothbay Fund Management, Llc | 0 | -100,00 | 0 | |||||
| 2026-02-13 | 13F | Neuberger Berman Group LLC | 35.959 | 106,57 | 1.994 | 136,14 | ||||
| 2026-02-13 | 13F | Rhumbline Advisers | 82.286 | -3,10 | 4.562 | 10,65 | ||||
| 2026-02-17 | 13F | Ameriprise Financial Inc | 10.201 | -64,22 | 566 | -59,15 | ||||
| 2026-01-16 | 13F | Empirical Financial Services, LLC d.b.a. Empirical Wealth Management | 4.571 | 253 | ||||||
| 2026-02-09 | 13F | Huntington National Bank | 4 | 0 | ||||||
| 2026-02-12 | 13F | CIBC Private Wealth Group, LLC | 1.383 | 0,14 | 77 | 13,43 | ||||
| 2026-02-17 | 13F | SIH Partners, LLLP | 9.316 | 516 | ||||||
| 2026-02-17 | 13F | Royal Bank Of Canada | 34.106 | -40,99 | 1.891 | -32,58 | ||||
| 2026-02-13 | 13F | American Century Companies Inc | 63.196 | 87,49 | 3.504 | 114,12 | ||||
| 2026-04-07 | 13F | Signaturefd, Llc | 2.660 | 6,44 | 199 | 44,20 | ||||
| 2026-02-10 | 13F | AXS Investments LLC | 62 | -7,46 | 3 | 0,00 | ||||
| 2026-04-20 | 13F | State of Alaska, Department of Revenue | 119.000 | 495,00 | 9 | 700,00 | ||||
| 2026-02-19 | 13F | CI Private Wealth, LLC | 4.058 | 225 | ||||||
| 2026-02-02 | 13F | Truist Financial Corp | 6.991 | 17,50 | 388 | 34,38 | ||||
| 2026-04-21 | 13F | Pinnacle Associates Ltd | 5.321 | 399 | ||||||
| 2026-02-06 | 13F | Global Retirement Partners, LLC | 95 | 5 | ||||||
| 2026-01-26 | 13F | KBC Group NV | 44.587 | 0,86 | 2 | 0,00 | ||||
| 2026-02-10 | 13F | Globeflex Capital L P | 3.392 | 188 | ||||||
| 2026-02-11 | 13F | Deutsche Bank Ag\ | 724.810 | -13,37 | 40.183 | -1,06 | ||||
| 2026-02-17 | 13F | Guggenheim Capital Llc | 6.654 | 369 | ||||||
| 2026-02-13 | 13F | Wbi Investments, Inc. | 7.518 | -54,65 | 417 | -48,26 | ||||
| 2026-02-09 | 13F | Employees Retirement System of Texas | 1.097 | 0,00 | 0 | |||||
| 2026-02-17 | 13F | Eddie Patel Inc | 15.075 | 836 | ||||||
| 2026-02-13 | 13F | Bridgefront Capital, LLC | 0 | -100,00 | 0 | |||||
| 2026-04-22 | 13F | Vinland Capital Management Gestora de Recursos LTDA. | 0 | -100,00 | 0 | -100,00 | ||||
| 2026-02-12 | 13F | Voya Investment Management Llc | 19.183 | -2,45 | 1.064 | 11,43 | ||||
| 2026-02-17 | 13F | Amundi | 240.023 | 26,05 | 13.307 | 44,18 | ||||
| 2025-11-13 | 13F | Winton Capital Group Ltd | 0 | -100,00 | 0 | -100,00 | ||||
| 2026-02-13 | 13F | First Trust Advisors Lp | 893.412 | -7,81 | 49.531 | 5,29 | ||||
| 2026-01-30 | 13F | Wealthstar Advisors, Llc | 32.393 | 1.796 | ||||||
| 2026-02-10 | 13F | Thoroughbred Financial Services, Llc | 6.303 | 0 | ||||||
| 2026-02-24 | 13F | DGS Capital Management, LLC | 5.771 | 1,67 | 320 | 16,00 | ||||
| 2026-02-09 | 13F/A | Fideuram - Intesa Sanpaolo Private Banking S.p.a. | 12.833 | 711 | ||||||
| 2026-02-17 | 13F | Quantinno Capital Management LP | 21.457 | 72,00 | 1.190 | 96,53 | ||||
| 2026-02-17 | 13F | Public Employees Retirement System Of Ohio | 454.917 | -5,65 | 25.221 | 7,76 | ||||
| 2025-11-14 | 13F | Scientech Research LLC | 0 | -100,00 | 0 | -100,00 | ||||
| 2026-04-23 | 13F | CBOE Vest Financial, LLC | 62.025 | 9,44 | 4.648 | 47,93 | ||||
| 2026-02-13 | 13F | Integrated Wealth Concepts LLC | 0 | -100,00 | 0 | |||||
| 2026-02-17 | 13F | Susquehanna Fundamental Investments, Llc | 17.650 | 0,00 | 979 | 14,25 | ||||
| 2026-02-11 | 13F | Fox Run Management, L.l.c. | 15.714 | 871 | ||||||
| 2026-02-12 | 13F | Qtron Investments LLC | 8.386 | 465 | ||||||
| 2026-02-17 | 13F | Susquehanna International Group, Llp | Call | 285.500 | 8,84 | 15.828 | 24,32 | |||
| 2026-02-17 | 13F | Lazard Asset Management Llc | 78.374 | 4.345 | ||||||
| 2026-02-18 | 13F | State of Tennessee, Treasury Department | 73.900 | 4.510 | ||||||
| 2025-11-14 | 13F | Delos Wealth Advisors, LLC | 0 | -100,00 | 0 | |||||
| 2026-02-13 | 13F | Mml Investors Services, Llc | 16.839 | 5,26 | 934 | 20,23 | ||||
| 2026-02-17 | 13F | Altshuler Shaham Ltd | 463 | 26 | ||||||
| 2026-02-17 | 13F | Mangrove Partners | 7.738 | 429 | ||||||
| 2026-02-13 | 13F | JustInvest LLC | 35.393 | 4,07 | 1.962 | 18,91 | ||||
| 2026-02-17 | 13F | Susquehanna International Group, Llp | 60.311 | 3.344 | ||||||
| 2026-02-17 | 13F | Russell Investments Group, Ltd. | 32.259 | -10,05 | 1.788 | 2,76 | ||||
| 2026-02-17 | 13F | Susquehanna International Group, Llp | Put | 34.800 | 319,28 | 1.929 | 379,85 | |||
| 2026-04-24 | 13F | IFM Investors Pty Ltd | 29 | 2 | ||||||
| 2026-01-29 | 13F | Sanctuary Advisors, LLC | 27.152 | 37,08 | 1.505 | 56,61 | ||||
| 2026-04-08 | 13F | Wealth Enhancement Advisory Services, Llc | 4.209 | 11,64 | 335 | 57,28 | ||||
| 2026-01-29 | 13F | Vanguard Group Inc | 322.113 | -8,58 | 17.858 | 4,41 | ||||
| 2026-02-04 | 13F | Bailard, Inc. | 3.702 | 205 | ||||||
| 2025-11-07 | 13F | Skandinaviska Enskilda Banken AB (publ) | 0 | -100,00 | 0 | |||||
| 2026-02-18 | 13F | GWM Advisors LLC | 15.134 | 1.860,36 | 839 | 2.167,57 | ||||
| 2026-02-12 | 13F | Nuveen, LLC | 267.847 | 8,47 | 14.849 | 23,89 | ||||
| 2026-04-20 | 13F | Ronald Blue Trust, Inc. | 52 | -89,28 | 4 | -88,46 | ||||
| 2026-02-14 | 13F | Militia Capital Partners, LP | 38.000 | 8,57 | 2.107 | 24,03 | ||||
| 2026-02-10 | 13F | Lummis Asset Management, LP | 3 | 0 | ||||||
| 2026-02-17 | 13F | Family Management Corp | 9.392 | 521 | ||||||
| 2026-02-10 | 13F | Envestnet Asset Management Inc | 100.987 | -23,28 | 5.599 | -12,38 | ||||
| 2026-01-16 | 13F | RHS Financial, LLC | 8.765 | 6,31 | 486 | 21,25 | ||||
| 2026-04-21 | 13F | Hennessy Advisors Inc | 252.100 | -3,37 | 18.892 | 30,61 | ||||
| 2026-02-09 | 13F | HBK Sorce Advisory LLC | 5.888 | -5,20 | 394 | 35,86 | ||||
| 2026-02-17 | 13F | Principal Street Partners, LLC | 4.527 | -23,83 | 251 | -13,19 | ||||
| 2026-01-16 | 13F | Longboard Asset Management, LP | 0 | -100,00 | 0 | |||||
| 2026-02-12 | 13F | Hrt Financial Lp | 116.500 | 6 | ||||||
| 2026-02-12 | 13F | LWM Advisory Services, LLC | 7.978 | -25,00 | 442 | -14,34 | ||||
| 2026-02-12 | 13F | BlackRock, Inc. | 5.424.834 | 2,29 | 300.753 | 16,83 | ||||
| 2026-03-20 | 13F/A | Hsbc Holdings Plc | 54.576 | 455,88 | 3.038 | 539,37 | ||||
| 2026-02-05 | 13F | Gabelli Funds Llc | 419.100 | -5,93 | 23.235 | 7,45 | ||||
| 2026-02-18 | 13F | Caitlin John, LLC | 49 | 0,00 | 3 | 0,00 | ||||
| 2026-04-09 | 13F | FCG Investment Co | 21.149 | 1.585 | ||||||
| 2026-01-26 | 13F | Cwm, Llc | 2.725 | 214,30 | 0 | |||||
| 2026-02-13 | 13F | Transamerica Financial Advisors, Inc. | 179 | 10 | ||||||
| 2026-01-28 | 13F | Ruffer LLP | 0 | -100,00 | 0 | |||||
| 2026-02-17 | 13F | Wellington Management Group Llp | 69.503 | 282,87 | 3.853 | 337,34 | ||||
| 2026-02-17 | 13F | Cape Investment Advisory, Inc. | 539 | 20,85 | 30 | 38,10 | ||||
| 2026-02-03 | 13F | Anfield Capital Management, LLC | 42.313 | -12,36 | 2.346 | 0,09 | ||||
| 2026-02-12 | 13F | New York State Common Retirement Fund | 45.853 | 0,31 | 2.542 | 14,61 | ||||
| 2026-02-10 | 13F | Acadian Asset Management Llc | 29.428 | -30,32 | 2 | -50,00 | ||||
| 2026-04-21 | 13F | Hosking Partners LLP | 351.482 | -0,89 | 26.340 | 33,98 | ||||
| 2026-02-12 | 13F | Campbell & CO Investment Adviser LLC | 12.853 | -2,15 | 713 | 11,77 | ||||
| 2025-11-07 | 13F | Fifth Third Bancorp | 0 | -100,00 | 0 | -100,00 | ||||
| 2025-11-10 | 13F | Options Solutions, Llc | 0 | -100,00 | 0 | |||||
| 2026-02-17 | 13F | Clear Street Markets Llc | 1.572 | 87 | ||||||
| 2026-02-04 | 13F | Ameritas Advisory Services, LLC | 0 | -100,00 | 0 | |||||
| 2026-01-16 | 13F | Standard Life Aberdeen plc | 9.390 | -98,26 | 521 | -98,01 | ||||
| 2026-02-13 | 13F | Citigroup Inc | 10.824 | 438,51 | 600 | 518,56 | ||||
| 2026-02-13 | 13F | Citigroup Inc | Call | 24.000 | 0,00 | 1.331 | 14,26 | |||
| 2026-04-16 | 13F | SG Americas Securities, LLC | 366.461 | -15,42 | 27 | 12,50 | ||||
| 2026-02-10 | 13F | Bank of New York Mellon Corp | 355.177 | 4,47 | 19.691 | 19,33 | ||||
| 2025-11-14 | 13F | Petrus Trust Company, LTA | 0 | -100,00 | 0 | -100,00 | ||||
| 2026-02-13 | 13F | BNP Paribas Asset Management Holding S.A. | 1.010.621 | 83,24 | 56 | 115,38 | ||||
| 2026-02-11 | 13F | Group One Trading, L.p. | 11.490 | 85,95 | 637 | 113,04 | ||||
| 2026-04-23 | 13F | Impact Partnership Wealth, LLC | 2.939 | 220 | ||||||
| 2025-11-12 | 13F | Itau Unibanco Holding S.A. | 0 | -100,00 | 0 | |||||
| 2026-04-13 | 13F | Wolff Wiese Magana Llc | 500 | 37 | ||||||
| 2026-04-22 | 13F | Pictet Asset Management Holding SA | 23.216 | 10,48 | 1.740 | 49,27 | ||||
| 2026-02-11 | 13F | Renaissance Group Llc | 180.034 | -10,83 | 9.981 | 1,85 | ||||
| 2026-04-16 | 13F | Beese Fulmer Investment Management, Inc. | 11.813 | 0,07 | 885 | 35,32 | ||||
| 2026-02-17 | 13F | Advisor Group Holdings, Inc. | 4.506 | -22,78 | 250 | -11,70 | ||||
| 2026-02-02 | 13F | Danske Bank A/s | 0 | -100,00 | 0 | |||||
| 2026-04-15 | 13F | Exchange Traded Concepts, Llc | 0 | -100,00 | 0 | |||||
| 2026-01-08 | 13F | Nordea Investment Management Ab | 204.852 | -11,86 | 11.375 | 0,98 | ||||
| 2026-02-17 | 13F | ExodusPoint Capital Management, LP | 0 | -100,00 | 0 | -100,00 | ||||
| 2026-02-13 | 13F | Segall Bryant & Hamill, Llc | 98.577 | 1,02 | 5.465 | 15,39 | ||||
| 2026-02-17 | 13F | Capstone Investment Advisors, Llc | 0 | -100,00 | 0 | -100,00 | ||||
| 2026-04-07 | 13F | Carolina Wealth Advisors, LLC | 221 | -81,78 | 17 | -76,12 | ||||
| 2026-02-17 | 13F | Readystate Asset Management Lp | 0 | -100,00 | 0 | |||||
| 2026-02-17 | 13F | Jain Global LLC | 26.439 | 237,28 | 1.466 | 285,53 | ||||
| 2026-02-17 | 13F | Alliancebernstein L.p. | 145.646 | 32,95 | 8.075 | 51,85 | ||||
| 2026-02-11 | 13F | Empowered Funds, LLC | 111.342 | 6.173 | ||||||
| 2026-02-09 | 13F | Geode Capital Management, Llc | 776.978 | -1,81 | 43.067 | 12,14 | ||||
| 2026-02-12 | 13F | Xponance, Inc. | 5.278 | -0,62 | 293 | 13,62 | ||||
| 2026-02-09 | 13F/A | Swedbank AB | 2.014.033 | -15,93 | 111.658 | -3,98 | ||||
| 2026-02-17 | 13F | Summit Trail Advisors, Llc | 11.254 | 142,23 | 624 | 176,89 | ||||
| 2026-01-14 | 13F | ORG Partners LLC | 90 | 0,00 | 5 | 0,00 | ||||
| 2026-01-29 | 13F | Quent Capital, LLC | 25 | 733,33 | 1 | |||||
| 2026-02-05 | 13F | ARS Investment Partners, LLC | 0 | -100,00 | 0 | |||||
| 2026-02-17 | 13F | Utah Retirement Systems | 5.430 | 0,00 | 301 | 14,45 | ||||
| 2026-04-10 | 13F | Matrix Trust Co | 246 | 5,13 | 0 | |||||
| 2026-02-17 | 13F | Occudo Quantitative Strategies Lp | 7.958 | 441 | ||||||
| 2026-02-11 | 13F | OneAscent Investment Solutions LLC | 6.316 | -16,08 | 350 | -4,11 | ||||
| 2026-02-09 | 13F | Jackson Creek Investment Advisors LLC | 19.553 | 1 | ||||||
| 2026-02-23 | 13F | Mv Capital Management, Inc. | 1 | 0 | ||||||
| 2026-04-13 | 13F | IFP Advisors, Inc | 1.875 | 72,02 | 141 | 133,33 | ||||
| 2026-02-17 | 13F | Jump Financial, LLC | 5.910 | 328 | ||||||
| 2026-02-03 | 13F | Ethic Inc. | 21.842 | 30,99 | 1.211 | 49,57 | ||||
| 2026-01-20 | 13F | Stratos Wealth Partners, LTD. | 3.793 | 210 | ||||||
| 2026-02-10 | 13F/A | Northwestern Mutual Wealth Management Co | 7.315 | 169,93 | 406 | 209,16 | ||||
| 2026-01-21 | 13F | South Shore Capital Advisors | 5.500 | 305 | ||||||
| 2026-02-12 | 13F | Cibc World Markets Corp | 29.392 | 1.629 | ||||||
| 2025-10-31 | 13F | Whittier Trust Co Of Nevada Inc | 0 | -100,00 | 0 | |||||
| 2026-04-17 | 13F | Bell Investment Advisors, Inc | 29 | 123,08 | 2 | |||||
| 2026-01-16 | 13F | Crewe Advisors LLC | 63 | 0,00 | 3 | 0,00 | ||||
| 2026-02-13 | 13F | Boston Partners | 1.603.730 | 2,67 | 88.911 | 17,27 | ||||
| 2026-02-17 | 13F | Park West Asset Management LLC | 335.130 | -25,61 | 18.580 | -15,04 | ||||
| 2026-01-27 | 13F | Meritage Portfolio Management | 124.666 | -3,03 | 6.911 | 10,75 | ||||
| 2026-02-17 | 13F | Advisory Services Network, LLC | 0 | -100,00 | 0 | |||||
| 2026-02-17 | 13F | SageView Advisory Group, LLC | 2.025 | -77,56 | 112 | -74,43 | ||||
| 2026-02-17 | 13F | Credit Agricole S A | 575.588 | 1,96 | 31.911 | 16,46 | ||||
| 2025-11-14 | 13F | Engineers Gate Manager LP | 0 | -100,00 | 0 | |||||
| 2026-02-04 | 13F | Atlantic Union Bankshares Corp | 75 | 1 | ||||||
| 2026-04-22 | 13F | Qp Wealth Management, Llc | 0 | -100,00 | 0 | |||||
| 2026-01-28 | 13F | CAPROCK Group, Inc. | 8.239 | 457 | ||||||
| 2026-02-12 | 13F | Custom Index Systems, Llc | 17.104 | 948 | ||||||
| 2026-02-09 | 13F | New Age Alpha Advisors, LLC | 0 | -100,00 | 0 | |||||
| 2026-02-18 | 13F | Vident Advisory, LLC | 11.455 | 2,27 | 635 | 16,94 | ||||
| 2026-02-11 | 13F | Cerity Partners LLC | 15.612 | 9,53 | 866 | 25,18 | ||||
| 2025-10-30 | 13F | Emerald Advisers, Llc | 0 | -100,00 | 0 | |||||
| 2025-11-12 | 13F | HAP Trading, LLC | 18.023 | 875 | ||||||
| 2026-02-17 | 13F | Blackstone Group Inc | 0 | -100,00 | 0 | |||||
| 2025-11-12 | 13F | HAP Trading, LLC | Call | 50.400 | 199 | |||||
| 2026-02-05 | 13F | AlphaCore Capital LLC | 5.545 | 307 | ||||||
| 2026-01-15 | 13F | Alpine Bank Wealth Management | 0 | -100,00 | 0 | |||||
| 2026-04-24 | 13F | Strs Ohio | 2.386 | -0,13 | 179 | 34,85 | ||||
| 2026-02-13 | 13F | Arrowstreet Capital, Limited Partnership | 940.729 | -22,70 | 52.154 | -11,72 | ||||
| 2026-02-17 | 13F | Man Group plc | 81.476 | 46,55 | 4.517 | 67,42 | ||||
| 2026-02-10 | 13F | Savant Capital, LLC | 4.941 | -3,80 | 274 | 9,64 | ||||
| 2025-11-14 | 13F | Clifford Capital Partners Llc | 0 | -100,00 | 0 | |||||
| 2026-02-12 | 13F | Brinker Capital Investments, LLC | 11.889 | 118,31 | 659 | 149,62 | ||||
| 2026-02-13 | 13F | Mariner, LLC | 38.345 | 11,55 | 2.126 | 27,40 | ||||
| 2025-11-10 | 13F | Equitable Trust Co | 0 | -100,00 | 0 | |||||
| 2026-02-17 | 13F | Qube Research & Technologies Ltd | 850.918 | 31,32 | 47.175 | 49,99 | ||||
| 2026-01-21 | 13F | Flagship Harbor Advisors, Llc | 0 | -100,00 | 0 | |||||
| 2026-02-13 | 13F | SRS Capital Advisors, Inc. | 422 | -66,80 | 23 | -62,30 |
Other Listings
| DE:M4M1 | 72,00 € |