Grundlæggende statistik
| Institutionelle ejere | 249 total, 249 long only, 0 short only, 0 long/short - change of 4,18% MRQ |
| Gennemsnitlig porteføljeallokering | 0.5062 % - change of -2,86% MRQ |
| Institutionelle aktier (lange) | 22.422.758 (ex 13D/G) - change of 0,71MM shares 3,28% MRQ |
| Institutionel værdi (lang) | $ 1.142.319 USD ($1000) |
Institutionelt ejerskab og aktionærer
SPDR Series Trust - State Street SPDR S&P 500 Fossil Fuel Reserves Free ETF (US:SPYX) har 249 institutionelle ejere og aktionærer, der har indsendt 13D/G- eller 13F-formularer til Securities Exchange Commission (SEC). Disse institutioner har i alt 22,422,758 aktier. Største aktionærer omfatter Windmill Hill Asset Management Ltd, Choate Investment Advisors, Betterment LLC, Bank of New York Mellon Corp, Bank Of America Corp /de/, Pnc Financial Services Group, Inc., LPL Financial LLC, Gemmer Asset Management LLC, Morgan Stanley, and Spinnaker Trust .
SPDR Series Trust - State Street SPDR S&P 500 Fossil Fuel Reserves Free ETF (ARCA:SPYX) institutionel ejerskabsstruktur viser aktuelle positioner i virksomheden efter institutioner og fonde, samt seneste ændringer i positionsstørrelse. Større aktionærer kan omfatte individuelle investorer, investeringsforeninger, hedgefonde eller institutioner. Skema 13D angiver, at investoren besidder (eller besidder) mere end 5 % af virksomheden og har til hensigt (eller har til hensigt at) aktivt at forfølge en ændring i forretningsstrategi. Skema 13G indikerer en passiv investering på over 5%.
The share price as of March 6, 2026 is 55,06 / share. Previously, on March 7, 2025, the share price was 47,27 / share. This represents an increase of 16,48% over that period.

Fondens stemningsscore
Fund Sentiment Score (fka Ownership Accumulation Score) finder de aktier, der bliver mest købt af fonde. Det er resultatet af en sofistikeret, multi-faktor kvantitativ model, der identificerer virksomheder med de højeste niveauer af institutionel akkumulering. Scoringsmodellen bruger en kombination af den samlede stigning i oplyste ejere, ændringerne i porteføljeallokeringer i disse ejere og andre målinger. Tallet går fra 0 til 100, hvor højere tal indikerer et højere niveau af akkumulering for sine jævnaldrende, og 50 er gennemsnittet.
Opdateringsfrekvens: Dagligt
Se Ownership Explorer, som giver en liste over højest rangerende virksomheder.
AI+ Ask Fintel’s AI assistant about SPDR Series Trust - State Street SPDR S&P 500 Fossil Fuel Reserves Free ETF.
Select a question to share a public post with an AI-crafted answer.
Thinking of good questions…
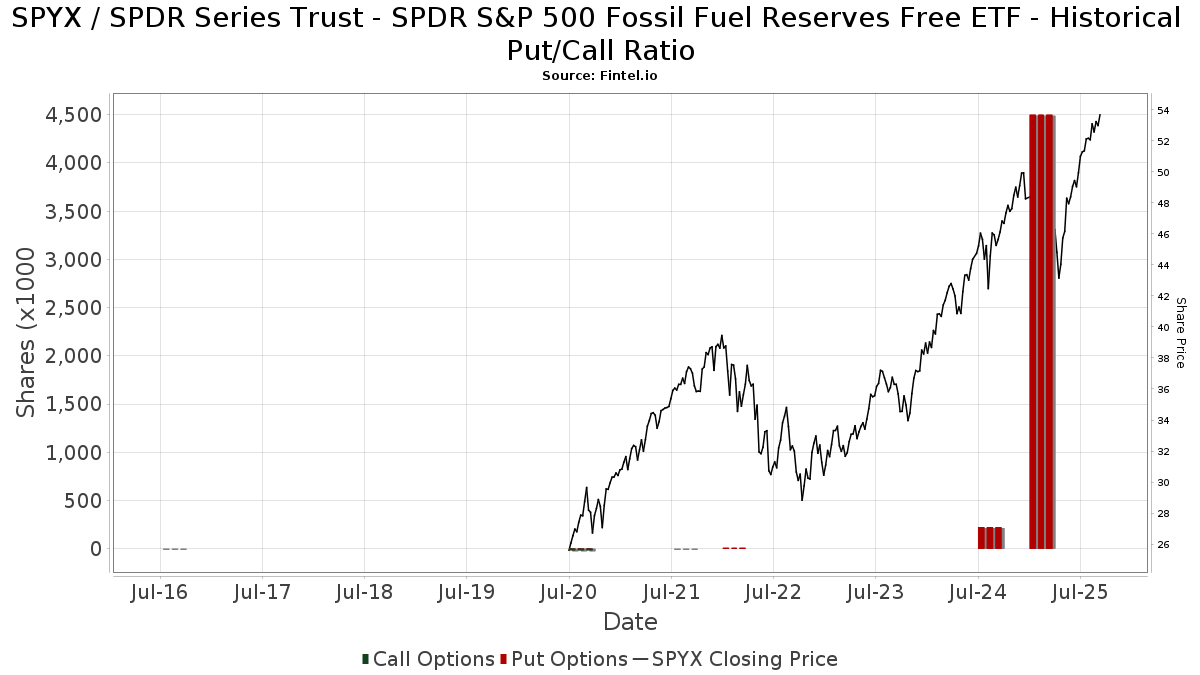
Institutionel Put/Call-forhold
Ud over at indberette standardaktie- og gældsudstedelser skal institutter med mere end 100 mill. aktiver under forvaltning også oplyse deres put- og call-optionsbeholdninger. Da salgsoptioner generelt indikerer negativ stemning, og købsoptioner indikerer positiv stemning, kan vi få en fornemmelse af den overordnede institutionelle stemning ved at plotte forholdet mellem put og kald. Diagrammet til højre viser det historiske put/call-forhold for dette instrument.
Brug af Put/Call Ratio som en indikator for investorernes stemning overvinder en af de vigtigste mangler ved at bruge totalt institutionelt ejerskab, som er, at en betydelig mængde af aktiver under forvaltning investeres passivt for at spore indekser. Passivt forvaltede fonde køber typisk ikke optioner, så indikatoren for put/call-forholdet følger mere nøje følelsen af aktivt forvaltede fonde.
13F og NPORT arkivering
Detaljer om 13F-arkivering er gratis. Detaljer om NP-ansøgninger kræver et premium-medlemskab. Grønne rækker angiver nye positioner. Røde rækker angiver lukkede positioner. Klik på linket ikon for at se den fulde transaktionshistorik.
Opgrader
for at låse premium-data op og eksportere til Excel ![]() .
.
| Fil dato | Kilde | Investor | Type | Gennemsnitlig pris (Øst) |
Aktier | Δ Aktier (%) |
Rapporteret Værdi ($1000) |
Δ Værdi (%) |
Port Alloc (%) |
|
|---|---|---|---|---|---|---|---|---|---|---|
| 2026-02-04 | 13F | Atlantic Union Bankshares Corp | 5.349 | -1,29 | 301 | 1,01 | ||||
| 2026-02-13 | 13F | Ubs Asset Management Americas Inc | 300 | 17 | ||||||
| 2026-02-11 | 13F | WESCAP Management Group, Inc. | 23.393 | 0,00 | 1.314 | 2,42 | ||||
| 2026-02-13 | 13F | Toroso Investments, LLC | 27.802 | -8,52 | 1.562 | -6,30 | ||||
| 2026-01-29 | 13F | Nbc Securities, Inc. | 960 | 0,00 | 54 | 1,92 | ||||
| 2026-02-03 | 13F | Foronjy Financial Llc | 6.991 | -2,40 | 393 | 0,00 | ||||
| 2026-01-27 | 13F | Proffitt & Goodson Inc | 1.816 | 0,00 | 102 | 3,03 | ||||
| 2026-02-13 | 13F | Pacific Center for Financial Services | 5.202 | 0,00 | 285 | 0,00 | ||||
| 2026-02-11 | 13F | Jpmorgan Chase & Co | 27.767 | 0,00 | 1.560 | 2,43 | ||||
| 2026-01-16 | 13F | Values Added Financial LLC | 11.537 | 0,00 | 648 | 2,53 | ||||
| 2026-01-29 | 13F | Sentinel Trust Co Lba | 21.265 | -2,29 | 1 | 0,00 | ||||
| 2026-02-13 | 13F | Smartleaf Asset Management LLC | 690 | 0,00 | 39 | 5,41 | ||||
| 2026-02-09 | 13F | Putnam Fl Investment Management Co | 75.694 | 0,75 | 4.253 | 3,23 | ||||
| 2026-02-09 | 13F | Hantz Financial Services, Inc. | 1.077 | 0,00 | 0 | |||||
| 2026-02-17 | 13F | Wiley Bros.-aintree Capital, Llc | 6.651 | 374 | ||||||
| 2026-02-12 | 13F | BRYN MAWR TRUST Co | 4.500 | 0,00 | 253 | 2,44 | ||||
| 2026-01-15 | 13F | Ironwood Financial, llc | 5.860 | 0,31 | 335 | 4,69 | ||||
| 2026-01-16 | 13F | Matrix Asset Advisors Inc/ny | 13.023 | 0,00 | 732 | 2,38 | ||||
| 2026-01-21 | 13F | Modera Wealth Management, LLC | 46.873 | -0,33 | 2.634 | 2,09 | ||||
| 2026-02-13 | 13F | Gould Asset Management Llc /ca/ | 179.381 | -2,01 | 10.079 | 0,38 | ||||
| 2026-02-17 | 13F | Advisory Services Network, LLC | 0 | -100,00 | 0 | |||||
| 2026-02-19 | 13F | CI Private Wealth, LLC | 8.965 | -65,41 | 504 | -71,93 | ||||
| 2026-02-10 | 13F/A | Northwestern Mutual Wealth Management Co | 3.685 | -7,32 | 207 | -5,05 | ||||
| 2026-02-11 | 13F | Endeavor Private Wealth, Inc. | 10.361 | -1,52 | 582 | 0,87 | ||||
| 2026-01-20 | 13F | Princeton Global Asset Management LLC | 1.177 | 0,26 | 66 | 3,13 | ||||
| 2026-01-27 | 13F | Farrow Financial Inc. | 15.354 | 0,00 | 863 | 2,38 | ||||
| 2026-02-24 | 13F | Bell Investment Advisors, Inc | 19.750 | -0,31 | 1.110 | 2,12 | ||||
| 2026-01-22 | 13F | Evermay Wealth Management Llc | 1.021 | 0,00 | 57 | 1,79 | ||||
| 2026-01-27 | 13F | Evergreen Capital Management Llc | 5.178 | -1,71 | 291 | 0,69 | ||||
| 2026-01-27 | 13F | Northern Financial Advisors Inc | 0 | -100,00 | 0 | |||||
| 2026-02-17 | 13F | Ameriprise Financial Inc | 235.307 | 22,04 | 13.222 | 25,03 | ||||
| 2026-02-18 | 13F | GWM Advisors LLC | 8.637 | 81,37 | 485 | 85,82 | ||||
| 2026-02-10 | 13F | One Capital Management, LLC | 7.959 | 13,52 | 447 | 16,41 | ||||
| 2026-01-06 | 13F | Nelson, Van Denburg & Campbell Wealth Management Group, LLC | 20.559 | 21,16 | 1.155 | 24,19 | ||||
| 2026-01-14 | 13F | Wealthcare Advisory Partners LLC | 0 | -100,00 | 0 | |||||
| 2026-02-17 | 13F | Cetera Investment Advisers | 21.325 | 3,64 | 1.198 | 6,21 | ||||
| 2026-01-20 | 13F | eCIO, Inc. | 20.586 | -3,17 | 1.157 | -0,86 | ||||
| 2026-02-12 | 13F | Johnson Financial Group, Inc. | 951 | 0,00 | 53 | 1,92 | ||||
| 2025-11-14 | 13F | SRS Capital Advisors, Inc. | 0 | -100,00 | 0 | |||||
| 2026-02-12 | 13F | Brown Brothers Harriman & Co | 65.877 | 0,00 | 3.702 | 2,44 | ||||
| 2026-02-17 | 13F | Creative Planning | 45.260 | 0,31 | 2.543 | 2,79 | ||||
| 2026-02-11 | 13F | IMA Wealth, Inc. | 16.238 | 0,23 | 912 | 2,70 | ||||
| 2026-02-13 | 13F | Stifel Financial Corp | 12.945 | 2,66 | 727 | 5,21 | ||||
| 2026-01-28 | 13F | Alesco Advisors Llc | 25.470 | 13,10 | 1.431 | 15,87 | ||||
| 2026-01-29 | 13F | UBS Group AG | 113.188 | 3,43 | 6.360 | 5,96 | ||||
| 2026-01-27 | 13F | Highview Capital Management LLC/DE/ | 5.777 | 0,00 | 325 | 2,53 | ||||
| 2025-10-28 | 13F | First National Corp /ma/ /adv | 22.782 | -0,89 | 1.254 | 7,18 | ||||
| 2026-02-09 | 13F | William Mack & Associates, Inc. | 10.634 | 12,83 | 598 | 15,70 | ||||
| 2026-02-17 | 13F | United Capital Financial Advisers, Llc | 30.322 | 2,96 | 1.704 | 5,45 | ||||
| 2025-11-05 | 13F | Sensible Financial Planning & Management, LLC. | 395.140 | 2,49 | 21.673 | 10,37 | ||||
| 2026-01-26 | 13F | Cwm, Llc | 16.047 | 56,60 | 1 | |||||
| 2026-02-06 | 13F/A | Rathbone Brothers plc | 336.612 | 0,00 | 18.914 | 2,44 | ||||
| 2025-10-30 | 13F | Twin Peaks Wealth Advisors, LLC | 0 | -100,00 | 0 | -100,00 | ||||
| 2026-01-26 | 13F | Private Trust Co Na | 1.236 | 162,42 | 69 | 176,00 | ||||
| 2026-02-11 | 13F | Flagship Wealth Advisors, Llc | 2.220 | 6,42 | 125 | 8,77 | ||||
| 2026-02-11 | 13F | LPL Financial LLC | 481.995 | 9,38 | 27.083 | 12,05 | ||||
| 2026-01-16 | 13F | Marino, Stram & Associates Llc | 38.334 | -9,78 | 2.154 | -7,60 | ||||
| 2026-02-04 | 13F | Bailard, Inc. | 8.632 | -44,40 | 485 | -43,01 | ||||
| 2026-02-13 | 13F | Fortis Capital Management LLC | 31.651 | -0,71 | 1.778 | 1,72 | ||||
| 2026-02-17 | 13F | Advisor Group Holdings, Inc. | 46.101 | 45,39 | 2.591 | 52,89 | ||||
| 2025-11-04 | 13F | IMC-Chicago, LLC | 0 | -100,00 | 0 | -100,00 | ||||
| 2026-01-22 | 13F | Maseco Llp | 34.150 | -0,78 | 1.919 | 1,64 | ||||
| 2026-02-10 | 13F | Savant Capital, LLC | 5.253 | 0,00 | 295 | 2,43 | ||||
| 2026-02-09 | 13F | Key FInancial Inc | 4.540 | 0,00 | 255 | 2,41 | ||||
| 2026-02-13 | 13F | Mml Investors Services, Llc | 26.794 | -0,77 | 1.506 | 1,62 | ||||
| 2026-02-17 | 13F | Holt Capital Advisors, L.L.C. dba Holt Capital Partners, L.P. | 3.828 | 0,00 | 215 | 2,87 | ||||
| 2026-02-13 | 13F | Sei Investments Co | 121.872 | -7,53 | 6.848 | -5,27 | ||||
| 2026-01-23 | 13F | FSM Wealth Advisors, LLC | 4.395 | 0,11 | 247 | 2,50 | ||||
| 2026-02-17 | 13F | Jones Financial Companies Lllp | 18.024 | -9,46 | 1.013 | -6,64 | ||||
| 2026-01-09 | 13F | Affinity Capital Advisors, LLC | 19.755 | 0,01 | 1.110 | 2,02 | ||||
| 2026-01-16 | 13F | Crewe Advisors LLC | 387 | 0,26 | 22 | 0,00 | ||||
| 2026-01-27 | 13F | Horst & Graben Wealth Management LLC | 7.506 | -12,83 | 422 | -10,81 | ||||
| 2026-02-17 | 13F | Susquehanna International Group, Llp | 45.224 | -19,42 | 2.541 | -17,45 | ||||
| 2026-02-03 | 13F | Washington Trust Advisors, Inc. | 2.544 | 0,00 | 143 | 2,16 | ||||
| 2026-02-12 | 13F | Bradley Foster & Sargent Inc/ct | 21.564 | 12,81 | 1.212 | 15,55 | ||||
| 2026-01-26 | 13F | Wbh Advisory Inc | 0 | -100,00 | 0 | |||||
| 2026-01-12 | 13F | Evanson Asset Management, LLC | 5.648 | 0,00 | 317 | 2,59 | ||||
| 2026-01-30 | 13F | Us Bancorp \de\ | 6.259 | 14,65 | 352 | 17,39 | ||||
| 2025-12-09 | 13F | Painted Porch Advisors LLC | 606 | 6,50 | 33 | 17,86 | ||||
| 2026-02-06 | 13F | Creative Financial Designs Inc /adv | 219 | 0,00 | 12 | 0,00 | ||||
| 2026-02-17 | 13F | IHT Wealth Management, LLC | 5.310 | -0,45 | 299 | 1,71 | ||||
| 2026-02-10 | 13F | Operose Advisors LLC | 21.557 | 40,39 | 1.211 | 43,82 | ||||
| 2026-03-02 | 13F | Sankala Group LLC | 7.036 | 395 | ||||||
| 2026-01-27 | 13F | Institute for Wealth Management, LLC. | 4.530 | -96,55 | 255 | -96,47 | ||||
| 2026-02-03 | 13F | Capital City Trust Co/fl | 24.183 | 0,00 | 1.359 | 2,41 | ||||
| 2025-11-14 | 13F | Jane Street Group, Llc | 0 | -100,00 | 0 | |||||
| 2026-01-22 | 13F | Kennebec Savings Bank | 1.803 | -5,06 | 101 | -2,88 | ||||
| 2026-01-23 | 13F | Oxler Private Wealth LLC | 36.180 | 0,18 | 2.033 | 2,63 | ||||
| 2026-01-30 | 13F | Sigma Planning Corp | 8.440 | 0,61 | 474 | 3,04 | ||||
| 2026-02-17 | 13F | Qube Research & Technologies Ltd | 761 | 1.258,93 | 43 | 1.300,00 | ||||
| 2026-01-28 | 13F | Rockingstone Advisors LLC | 4.725 | 10,40 | 265 | 13,25 | ||||
| 2026-02-05 | 13F | Allworth Financial LP | 2.201 | 32,83 | 124 | 36,67 | ||||
| 2026-01-22 | 13F | Alpha Omega Wealth Management LLC | 4.450 | -2,20 | 250 | 0,40 | ||||
| 2026-02-10 | 13F | Johnson Financial Group, LLC | 18.311 | 349,13 | 1.029 | 360,99 | ||||
| 2026-02-11 | 13F | Milestone Investment Advisors LLC | 60.814 | -4,94 | 3.417 | -2,59 | ||||
| 2026-02-10 | 13F | Root Financial Partners, LLC | 0 | -100,00 | 0 | |||||
| 2026-01-20 | 13F | Sovran Advisors, LLC | 7.690 | 0,00 | 438 | 1,39 | ||||
| 2026-02-13 | 13F | National Bank Of Canada /fi/ | 1.586 | 507,66 | 89 | 535,71 | ||||
| 2025-10-24 | 13F | Bristlecone Advisors, LLC | 0 | -100,00 | 0 | |||||
| 2026-02-06 | 13F | Signature Estate & Investment Advisors Llc | 5.543 | 1,59 | 311 | 4,01 | ||||
| 2026-02-12 | 13F | Moneta Group Investment Advisors Llc | 13.585 | 1,60 | 763 | 4,09 | ||||
| 2025-11-12 | 13F | Simplex Trading, Llc | 0 | -100,00 | 0 | |||||
| 2026-02-13 | 13F | Commerce Bank | 15.330 | 0,00 | 861 | 2,50 | ||||
| 2026-02-06 | 13F | Windmill Hill Asset Management Ltd | 6.341.875 | 6,90 | 356.350 | 9,51 | ||||
| 2026-02-17 | 13F | Warren Averett Asset Management, LLC | 4.674 | 6,86 | 263 | 9,62 | ||||
| 2026-02-23 | 13F | Monetary Solutions, Ltd | 2.819 | 158 | ||||||
| 2026-01-29 | 13F | Sanctuary Advisors, LLC | 3.802 | 214 | ||||||
| 2026-02-13 | 13F | Baird Financial Group, Inc. | 4.400 | -90,05 | 247 | -89,82 | ||||
| 2026-01-27 | 13F | Seeds Investor Llc | 134.088 | 16,90 | 7.534 | 19,76 | ||||
| 2026-01-23 | 13F | Bridgewater Advisors Inc. | 19.694 | 3,10 | 1.109 | 5,12 | ||||
| 2026-02-13 | 13F | Wells Fargo & Company/mn | 75.894 | -4,83 | 4.265 | -2,49 | ||||
| 2026-02-13 | 13F | Morgan Stanley | 433.413 | 4,53 | 24.354 | 7,08 | ||||
| 2026-02-13 | 13F | Umb Bank N A/mo | 4.680 | 0,00 | 263 | 2,34 | ||||
| 2026-01-27 | 13F | Wealth Enhancement Trust Services, Inc. | 1.645 | 92 | ||||||
| 2025-11-14 | 13F | Citadel Advisors Llc | 0 | -100,00 | 0 | -100,00 | ||||
| 2025-10-14 | 13F | Dohj, Llc | 0 | -100,00 | 0 | |||||
| 2026-01-13 | 13F | Dakota Wealth Management | 4.336 | 0,00 | 244 | 2,53 | ||||
| 2026-01-26 | 13F | AE Wealth Management LLC | 2.012 | 4,79 | 113 | 7,62 | ||||
| 2026-01-14 | 13F | Eastern Bank | 3.411 | 0,00 | 192 | 2,14 | ||||
| 2026-02-11 | 13F | Empowered Funds, LLC | 3.393 | 191 | ||||||
| 2026-02-11 | 13F | TCTC Holdings, LLC | 3.000 | 0,00 | 169 | 2,44 | ||||
| 2026-02-05 | 13F | Western Wealth Management, LLC | 19.268 | 32,82 | 1.083 | 36,10 | ||||
| 2026-02-05 | 13F | AlphaCore Capital LLC | 3.064 | 172 | ||||||
| 2026-02-17 | 13F | NorthRock Partners, LLC | 7.154 | 0,00 | 402 | 2,30 | ||||
| 2026-01-30 | 13F | Citizens Financial Group Inc/ri | 30.200 | -3,21 | 1.697 | -0,88 | ||||
| 2026-01-13 | 13F | CoreCap Advisors, LLC | 356 | 0,00 | 20 | 5,26 | ||||
| 2026-02-09 | 13F | Choate Investment Advisors | 2.381.460 | -2,48 | 133.814 | -0,10 | ||||
| 2026-02-13 | 13F | Resources Investment Advisors, LLC. | 29.374 | 1,38 | 1.651 | 3,84 | ||||
| 2026-02-17 | 13F | Aqr Capital Management Llc | 28.572 | 120,26 | 1.605 | 125,74 | ||||
| 2026-02-17 | 13F | Private Advisor Group, LLC | 5.476 | 3,85 | 308 | 6,23 | ||||
| 2026-01-23 | 13F | Farther Finance Advisors, LLC | 493 | -21,37 | 28 | -20,59 | ||||
| 2026-01-23 | 13F | Gemmer Asset Management LLC | 443.447 | 0,42 | 24.917 | 2,87 | ||||
| 2026-02-12 | 13F | Commonwealth Equity Services, Llc | 175.656 | 22,31 | 9.870 | 140.900,00 | ||||
| 2026-02-05 | 13F | Cambridge Investment Research Advisors, Inc. | 141.343 | 0,50 | 8 | 0,00 | ||||
| 2026-01-27 | 13F | BLVD Private Wealth, LLC | 8.142 | -18,69 | 457 | -16,76 | ||||
| 2025-11-14 | 13F | Strategic Wealth Partners, Ltd. | 53 | 3 | ||||||
| 2026-01-20 | 13F | Hanson & Doremus Investment Management | 25.461 | -3,96 | 1 | 0,00 | ||||
| 2026-02-03 | 13F | Ballentine Partners, LLC | 4.734 | 0,00 | 266 | 2,70 | ||||
| 2026-01-28 | 13F | WPG Advisers, LLC | 29 | 0,00 | 2 | 0,00 | ||||
| 2026-02-18 | 13F | EP Wealth Advisors, Inc. | 16.401 | -7,53 | 922 | 1,99 | ||||
| 2026-02-10 | 13F | Lido Advisors, LLC | 3.905 | 218 | ||||||
| 2026-02-12 | 13F | Betterment LLC | 1.940.078 | 0,30 | 109 | 2,83 | ||||
| 2026-02-13 | 13F | Atlas Capital Advisors Llc | 0 | -100,00 | 0 | |||||
| 2026-02-06 | 13F | HighTower Advisors, LLC | 48.557 | 5,59 | 2.728 | 8,17 | ||||
| 2026-02-13 | 13F | Citigroup Inc | 2.550 | -0,04 | 143 | 2,88 | ||||
| 2025-11-05 | 13F | Plante Moran Financial Advisors, LLC | 0 | -100,00 | 0 | |||||
| 2026-01-15 | 13F | MEMBERS Trust Co | 3.930 | 0,00 | 221 | 2,33 | ||||
| 2026-02-13 | 13F | Mariner, LLC | 231.043 | 162,12 | 12.982 | 168,56 | ||||
| 2026-02-09 | 13F | Tiff Advisory Services Inc | 86.503 | -74,51 | 4.861 | -73,89 | ||||
| 2026-02-12 | 13F | Scotia Capital Inc. | 4.312 | 0,00 | 242 | 2,54 | ||||
| 2026-01-13 | 13F | First Financial Corp /in/ | 565 | 32 | ||||||
| 2026-01-12 | 13F | Burns J W & Co Inc/ny | 10.600 | 0,00 | 596 | 2,41 | ||||
| 2026-02-06 | 13F | Larson Financial Group LLC | 681 | 0,15 | 38 | 2,70 | ||||
| 2026-01-23 | 13F | Assetmark, Inc | 102 | 6 | ||||||
| 2026-01-12 | 13F | Focus Financial Network, Inc. | 16.973 | 7,52 | 954 | 10,17 | ||||
| 2026-01-16 | 13F | Morris Retirement Advisors, LLC | 6.227 | 0,00 | 350 | 2,35 | ||||
| 2026-02-03 | 13F | Orion Capital Management LLC | 143 | 8 | ||||||
| 2026-02-17 | 13F | Raymond James Financial Inc | 37.564 | 12,02 | 2.111 | 14,74 | ||||
| 2026-02-13 | 13F | Brown Advisory Inc | 5.467 | 0,00 | 307 | 2,68 | ||||
| 2026-02-13 | 13F | Ally Invest Advisors Inc. | 12.342 | 0,24 | 693 | 2,67 | ||||
| 2026-01-29 | 13F | Facet Wealth, Inc. | 13.215 | -0,12 | 755 | 4,00 | ||||
| 2026-02-17 | 13F | Captrust Financial Advisors | 8.555 | 481 | ||||||
| 2026-02-10 | 13F | Clear Harbor Asset Management, LLC | 27.825 | 0,65 | 1.563 | 3,10 | ||||
| 2026-02-11 | 13F | Tiaa Trust, National Association | 6.186 | 0,00 | 348 | 2,36 | ||||
| 2026-01-27 | 13F | Retirement Income Solutions, Inc | 173.073 | 0,05 | 9.725 | 2,49 | ||||
| 2026-02-10 | 13F | Envestnet Asset Management Inc | 35.008 | 16,42 | 1.967 | 19,28 | ||||
| 2026-01-28 | 13F | Schmidt P J Investment Management Inc | 8.925 | 0,00 | 501 | 2,45 | ||||
| 2026-02-06 | 13F | GPS Wealth Strategies Group, LLC | 0 | -100,00 | 0 | |||||
| 2026-02-17 | 13F | First Manhattan Co | 8.409 | 473 | ||||||
| 2026-01-29 | 13F | Comerica Bank | 6.017 | -0,17 | 338 | 2,42 | ||||
| 2026-02-06 | 13F | Tortoise Investment Management, LLC | 4.835 | 0,00 | 272 | 2,26 | ||||
| 2026-02-12 | 13F | Great Valley Advisor Group, Inc. | 7.390 | -8,65 | 415 | -6,32 | ||||
| 2026-01-28 | 13F | Cranbrook Wealth Management, LLC | 540 | 0,00 | 30 | 3,45 | ||||
| 2026-02-17 | 13F | Mercer Global Advisors Inc /adv | 7.637 | -9,96 | 429 | -7,74 | ||||
| 2026-01-29 | 13F | Dunhill Financial, LLC | 12 | 0,00 | 1 | |||||
| 2026-02-11 | 13F | Cerity Partners LLC | 153.828 | 5,49 | 8.644 | 8,06 | ||||
| 2026-01-26 | 13F | Harbor Asset Planning, Inc. | 534 | 0,38 | 30 | 0,00 | ||||
| 2026-02-13 | 13F | AlTi Global, Inc. | 24.496 | -1,58 | 1.376 | 0,81 | ||||
| 2026-02-17 | 13F | Bank Of America Corp /de/ | 949.717 | 6,90 | 53.365 | 9,51 | ||||
| 2026-02-09 | 13F | Prospera Financial Services Inc | 6.975 | -0,26 | 392 | 2,35 | ||||
| 2026-01-21 | 13F | South Shore Capital Advisors | 5.070 | 285 | ||||||
| 2026-02-12 | 13F | Douglass Winthrop Advisors, LLC | 8.000 | 0,00 | 450 | 2,51 | ||||
| 2026-02-02 | 13F | Oak Harbor Wealth Partners, Llc | 999 | 56 | ||||||
| 2026-02-14 | 13F | Rockefeller Capital Management L.P. | 161.929 | 2,81 | 9.099 | 5,33 | ||||
| 2026-02-10 | 13F | Bank of New York Mellon Corp | 1.302.237 | -8,78 | 73.173 | -6,55 | ||||
| 2026-02-17 | 13F | Fmr Llc | 34.454 | 50,47 | 1.936 | 54,18 | ||||
| 2026-01-27 | 13F | Human Investing LLC | 10.329 | 580 | ||||||
| 2026-02-13 | 13F | Golden State Wealth Management, LLC | 8.619 | 11,37 | 484 | 14,15 | ||||
| 2026-01-06 | 13F | Investors Research Corp | 1.051 | -6,91 | 59 | -3,28 | ||||
| 2025-10-22 | 13F | Geneos Wealth Management Inc. | 0 | -100,00 | 0 | |||||
| 2026-02-05 | 13F | Thrivent Financial For Lutherans | 8.650 | 0 | ||||||
| 2026-02-09 | 13F | Bleakley Financial Group, LLC | 0 | -100,00 | 0 | |||||
| 2026-02-13 | 13F | Partners Capital Investment Group, Llp | 356.322 | 24,81 | 20.022 | 27,86 | ||||
| 2026-02-17 | 13F | Cresset Asset Management, LLC | 18.481 | 0,00 | 1.038 | 2,47 | ||||
| 2026-02-06 | 13F | Global Retirement Partners, LLC | 7.240 | -2,54 | 407 | -0,25 | ||||
| 2026-01-12 | 13F | Traynor Capital Management, Inc. | 0 | -100,00 | 0 | |||||
| 2026-02-11 | 13F | Capital Analysts, Inc. | 1.809 | 0,00 | 0 | |||||
| 2026-01-23 | 13F | TFC Financial Management | 309 | 0,00 | 17 | 6,25 | ||||
| 2026-02-13 | 13F | Kestra Advisory Services, LLC | 0 | -100,00 | 0 | |||||
| 2026-01-13 | 13F | NerdWallet Wealth Partners, LLC | 4.099 | -3,71 | 2.795 | 2,95 | ||||
| 2026-02-12 | 13F | Steward Partners Investment Advisory, Llc | 1.755 | 0,00 | 99 | 2,08 | ||||
| 2026-02-12 | 13F | Fiduciary Group LLC | 9.972 | 0,00 | 560 | 2,56 | ||||
| 2026-02-06 | 13F | Addison Advisors LLC | 1.510 | -39,96 | 85 | -38,69 | ||||
| 2026-02-09 | 13F | Smithfield Trust Co | 4.647 | 0,00 | 0 | |||||
| 2026-02-10 | 13F | North Berkeley Wealth Management, LLC | 7.436 | 0,00 | 418 | 2,46 | ||||
| 2026-01-27 | 13F | PFG Advisors | 34.985 | -21,29 | 1.966 | -19,37 | ||||
| 2026-02-02 | 13F | Truist Financial Corp | 18.441 | -0,27 | 1.036 | 2,17 | ||||
| 2026-02-17 | 13F | Agf Management Ltd | 44.225 | -8,34 | 2.485 | -6,08 | ||||
| 2026-01-21 | 13F | Flagship Harbor Advisors, Llc | 317 | 18 | ||||||
| 2026-01-21 | 13F | Sound Income Strategies, LLC | 202 | 0,00 | 11 | 0,00 | ||||
| 2025-11-06 | 13F | Ameritas Advisory Services, LLC | 0 | -100,00 | 0 | |||||
| 2026-02-09 | 13F | Harbour Investments, Inc. | 84.277 | 4,95 | 4.736 | 7,52 | ||||
| 2026-02-11 | 13F | Ameritas Investment Partners, Inc. | 15.210 | 855 | ||||||
| 2026-02-17 | 13F | Equitable Holdings, Inc. | 4.109 | 0,02 | 231 | 2,22 | ||||
| 2026-01-20 | 13F | Investment Research & Advisory Group, Inc. | 2.820 | -1,84 | 1.923 | 0,52 | ||||
| 2026-01-26 | 13F | PFG Investments, LLC | 24.830 | -1,81 | 1.395 | 0,58 | ||||
| 2026-02-06 | 13F | Pnc Financial Services Group, Inc. | 522.214 | 2,81 | 29.343 | 5,32 | ||||
| 2026-01-16 | 13F | Trust Co Of Vermont | 11.251 | 0,00 | 632 | 2,43 | ||||
| 2026-02-06 | 13F | Axxcess Wealth Management, Llc | 50.913 | 9,33 | 2.861 | 11,98 | ||||
| 2026-01-20 | 13F | AdvisorNet Financial, Inc | 1.104 | 1,85 | 62 | 5,08 | ||||
| 2026-02-13 | 13F | Palisade Asset Management, LLC | 0 | -100,00 | 0 | |||||
| 2026-01-28 | 13F | Chicago Partners Investment Group LLC | 8.654 | 0,00 | 490 | 0,00 | ||||
| 2026-02-12 | 13F | Rossby Financial, LCC | 4.657 | 16,63 | 262 | 19,18 | ||||
| 2026-02-02 | 13F | Sachetta, LLC | 97 | -25,38 | 5 | -28,57 | ||||
| 2026-02-10 | 13F | Essex Financial Services, Inc. | 23.612 | 0,03 | 1.327 | 2,47 | ||||
| 2025-10-31 | 13F | JFG Wealth Management, LLC | 14.234 | 0,00 | 781 | 7,73 | ||||
| 2026-02-10 | 13F | Tidemark, LLC | 2.706 | -3,22 | 152 | -0,65 | ||||
| 2026-02-11 | 13F | Parallel Advisors, LLC | 1.200 | 0,00 | 67 | 3,08 | ||||
| 2025-11-14 | 13F | Skopos Labs, Inc. | 0 | -100,00 | 0 | |||||
| 2026-01-20 | 13F | Steel Peak Wealth Management LLC | 9.268 | 1,48 | 521 | 4,00 | ||||
| 2026-01-23 | 13F | Westside Investment Management, Inc. | 300 | 0,00 | 17 | 0,00 | ||||
| 2026-02-10 | 13F | Rothschild Investment Llc | 1.920 | 0,00 | 108 | 1,90 | ||||
| 2026-02-18 | 13F | Beacon Pointe Advisors, LLC | 393.370 | 22.103 | ||||||
| 2026-02-10 | 13F | Goldman Sachs Group Inc | 29.160 | -39,93 | 1.638 | -38,47 | ||||
| 2026-01-29 | 13F | 4Thought Financial Group Inc. | 4.624 | -3,20 | 260 | -1,15 | ||||
| 2026-02-12 | 13F | Bank Of Montreal /can/ | 5.900 | 0,00 | 332 | 2,48 | ||||
| 2026-02-04 | 13F | Rollins Financial Advisors, LLC | 8.079 | 0,00 | 454 | 2,26 | ||||
| 2026-01-16 | 13F | First Pacific Financial | 5.491 | -2,59 | 309 | -0,32 | ||||
| 2026-01-14 | 13F | Cornerstone Wealth Advisors, Inc. | 9.385 | -0,04 | 527 | 2,53 | ||||
| 2026-02-13 | 13F | Integrated Wealth Concepts LLC | 8.461 | 475 | ||||||
| 2026-02-05 | 13F | Trevian Wealth Management LLC | 15.686 | 0,00 | 881 | 2,44 | ||||
| 2026-02-09 | 13F | CBIZ Investment Advisory Services, LLC | 8.490 | 0,00 | 477 | 2,58 | ||||
| 2026-02-13 | 13F | Pathstone Holdings, LLC | 266.117 | -4,67 | 14.953 | -2,34 | ||||
| 2026-02-12 | 13F | Walled Lake Planning & Wealth Management, Llc | 7.335 | 0,23 | 412 | 2,74 | ||||
| 2026-02-17 | 13F | Blair William & Co/il | 1.128 | 0,00 | 63 | 3,28 | ||||
| 2026-02-10 | 13F | CIBC World Markets Inc. | 11.458 | 0,00 | 644 | 2,39 | ||||
| 2025-11-12 | 13F | Willow Creek Wealth Management Inc. | 3.953 | -10,50 | 217 | -3,57 | ||||
| 2026-01-28 | 13F | N.E.W. Advisory Services LLC | 5.700 | 0,02 | 320 | 2,56 | ||||
| 2026-02-17 | 13F | Royal Bank Of Canada | 219.012 | 1,99 | 12.306 | 4,48 | ||||
| 2026-01-26 | 13F | Asset Dedication, LLC | 780 | 0,00 | 44 | 2,38 | ||||
| 2026-02-13 | 13F | Bragg Financial Advisors, Inc | 20.059 | 0,64 | 1.127 | 3,11 | ||||
| 2026-01-09 | 13F | Diversified Trust Co | 7.932 | 0,00 | 446 | 2,30 | ||||
| 2026-01-22 | 13F | Hager Investment Management Services, Llc | 812 | 2,78 | 46 | 4,65 | ||||
| 2026-01-23 | 13F | Optima Capital Llc | 555 | 31 | ||||||
| 2026-01-14 | 13F | Enclave Advisors LLC | 11.327 | -10,85 | 636 | -8,62 | ||||
| 2026-01-30 | 13F | North Star Investment Management Corp. | 34 | 0,00 | 2 | 0,00 | ||||
| 2026-01-30 | 13F | Wealthfront Advisers Llc | 25.626 | -2,59 | 1.440 | -0,21 | ||||
| 2026-01-22 | 13F | Apollon Wealth Management, LLC | 4.651 | 0,04 | 261 | 2,76 | ||||
| 2026-01-28 | 13F | Trademark Financial Management, LLC | 7.785 | 0,00 | 437 | 2,34 | ||||
| 2026-02-13 | 13F | Fiduciary Trust Co | 5.270 | -8,67 | 296 | -6,33 | ||||
| 2026-01-08 | 13F | Wealth Enhancement Advisory Services, Llc | 19.154 | 10,16 | 1.092 | 14,00 | ||||
| 2026-01-28 | 13F | Boyd Wealth Management, LLC | 36.151 | 1,42 | 2.031 | 3,89 | ||||
| 2026-02-12 | 13F | Foster Dykema Cabot & Partners, Llc | 100.831 | -0,69 | 5.666 | 1,74 | ||||
| 2026-01-27 | 13F | TD Waterhouse Canada Inc. | 1.274 | 0,87 | 72 | 2,90 | ||||
| 2026-02-10 | 13F | Spinnaker Trust | 427.850 | 0,87 | 24.041 | 3,33 | ||||
| 2026-02-13 | 13F | Resources Management Corp /ct/ /adv | 168 | 0,00 | 0 | |||||
| 2026-01-21 | 13F | Crux Wealth Advisors | 85.697 | -1,18 | 4.815 | 1,24 | ||||
| 2026-02-12 | 13F | Xponance, Inc. | 112.864 | -18,57 | 6.342 | -16,59 | ||||
| 2026-01-13 | 13F | Stonehearth Capital Management, LLC | 71.322 | -0,30 | 4.008 | 2,14 | ||||
| 2026-02-13 | 13F | Allianz Se | 298.008 | 5,67 | 16.745 | 8,26 | ||||
| 2026-02-13 | 13F | Pinnacle Wealth Planning Services, Inc. | 147 | 8 | ||||||
| 2026-01-08 | 13F | Grove Bank & Trust | 100 | 0,00 | 6 | 0,00 |