Grundlæggende statistik
| Institutionelle ejere | 118 total, 118 long only, 0 short only, 0 long/short - change of -0,84% MRQ |
| Gennemsnitlig porteføljeallokering | 0.1933 % - change of -12,27% MRQ |
| Institutionelle aktier (lange) | 19.416.222 (ex 13D/G) - change of 0,54MM shares 2,88% MRQ |
| Institutionel værdi (lang) | $ 962.930 USD ($1000) |
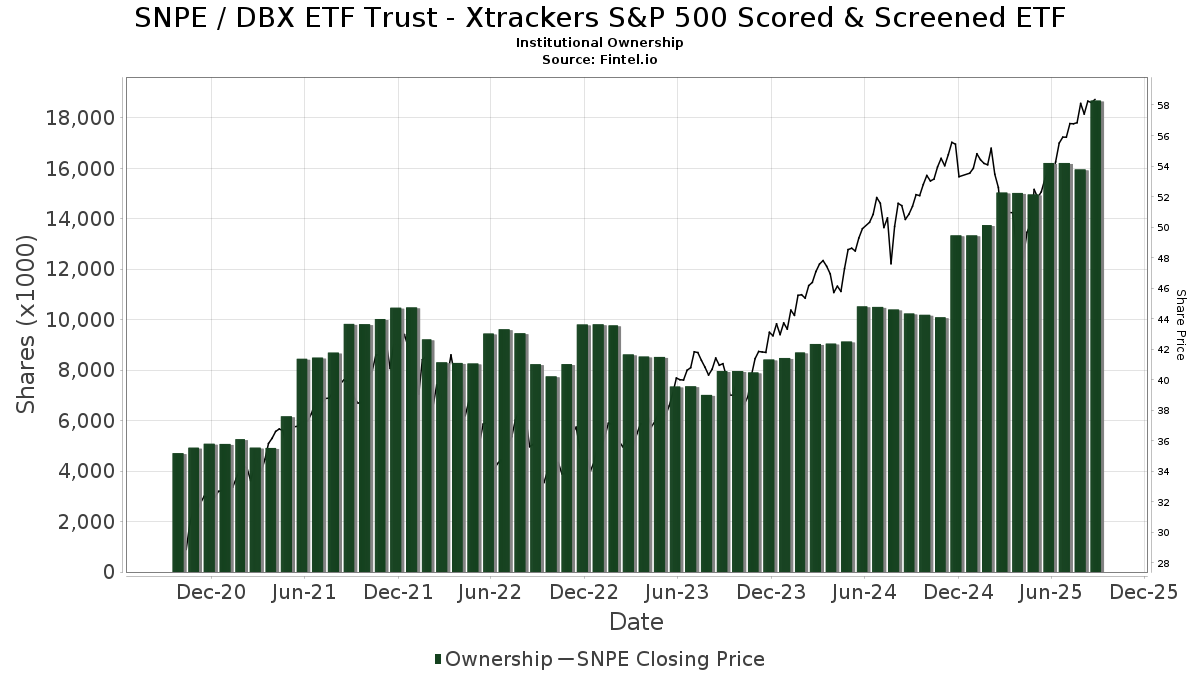
Institutionelt ejerskab og aktionærer
DBX ETF Trust - Xtrackers S&P 500 Scored & Screened ETF (US:SNPE) har 118 institutionelle ejere og aktionærer, der har indsendt 13D/G- eller 13F-formularer til Securities Exchange Commission (SEC). Disse institutioner har i alt 19,416,222 aktier. Største aktionærer omfatter Jpmorgan Chase & Co, Sun Life Financial Inc, Morgan Stanley, WCG Wealth Advisors LLC, Mirae Asset Global Investments Co., Ltd., Royal Bank Of Canada, LPL Financial LLC, UBS Group AG, Ameriprise Financial Inc, and Raymond James Financial Inc .
DBX ETF Trust - Xtrackers S&P 500 Scored & Screened ETF (ARCA:SNPE) institutionel ejerskabsstruktur viser aktuelle positioner i virksomheden efter institutioner og fonde, samt seneste ændringer i positionsstørrelse. Større aktionærer kan omfatte individuelle investorer, investeringsforeninger, hedgefonde eller institutioner. Skema 13D angiver, at investoren besidder (eller besidder) mere end 5 % af virksomheden og har til hensigt (eller har til hensigt at) aktivt at forfølge en ændring i forretningsstrategi. Skema 13G indikerer en passiv investering på over 5%.
The share price as of April 2, 2026 is 60,20 / share. Previously, on April 4, 2025, the share price was 45,63 / share. This represents an increase of 31,93% over that period.
Fondens stemningsscore
Fund Sentiment Score (fka Ownership Accumulation Score) finder de aktier, der bliver mest købt af fonde. Det er resultatet af en sofistikeret, multi-faktor kvantitativ model, der identificerer virksomheder med de højeste niveauer af institutionel akkumulering. Scoringsmodellen bruger en kombination af den samlede stigning i oplyste ejere, ændringerne i porteføljeallokeringer i disse ejere og andre målinger. Tallet går fra 0 til 100, hvor højere tal indikerer et højere niveau af akkumulering for sine jævnaldrende, og 50 er gennemsnittet.
Opdateringsfrekvens: Dagligt
Se Ownership Explorer, som giver en liste over højest rangerende virksomheder.
AI+ Ask Fintel’s AI assistant about DBX ETF Trust - Xtrackers S&P 500 Scored & Screened ETF.
Select a question to share a public post with an AI-crafted answer.
Thinking of good questions…
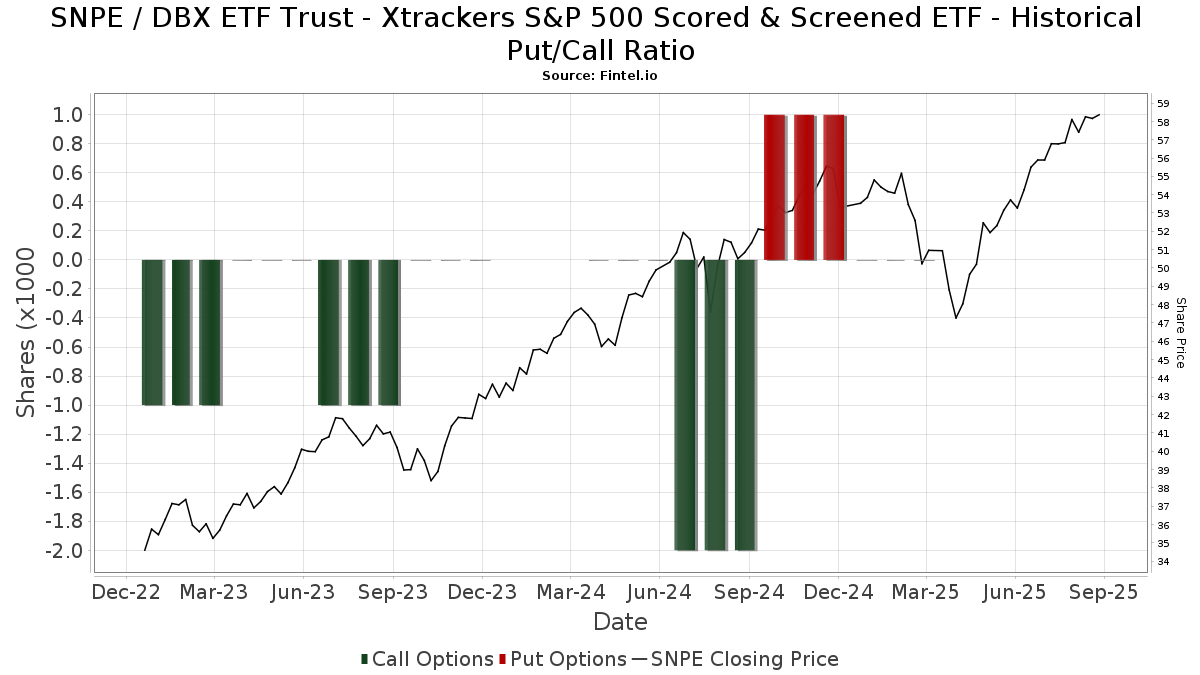
Institutionel Put/Call-forhold
Ud over at indberette standardaktie- og gældsudstedelser skal institutter med mere end 100 mill. aktiver under forvaltning også oplyse deres put- og call-optionsbeholdninger. Da salgsoptioner generelt indikerer negativ stemning, og købsoptioner indikerer positiv stemning, kan vi få en fornemmelse af den overordnede institutionelle stemning ved at plotte forholdet mellem put og kald. Diagrammet til højre viser det historiske put/call-forhold for dette instrument.
Brug af Put/Call Ratio som en indikator for investorernes stemning overvinder en af de vigtigste mangler ved at bruge totalt institutionelt ejerskab, som er, at en betydelig mængde af aktiver under forvaltning investeres passivt for at spore indekser. Passivt forvaltede fonde køber typisk ikke optioner, så indikatoren for put/call-forholdet følger mere nøje følelsen af aktivt forvaltede fonde.
13F og NPORT arkivering
Detaljer om 13F-arkivering er gratis. Detaljer om NP-ansøgninger kræver et premium-medlemskab. Grønne rækker angiver nye positioner. Røde rækker angiver lukkede positioner. Klik på linket ikon for at se den fulde transaktionshistorik.
Opgrader
for at låse premium-data op og eksportere til Excel ![]() .
.
| Fil dato | Kilde | Investor | Type | Gennemsnitlig pris (Øst) |
Aktier | Δ Aktier (%) |
Rapporteret Værdi ($1000) |
Δ Værdi (%) |
Port Alloc (%) |
|
|---|---|---|---|---|---|---|---|---|---|---|
| 2026-02-10 | 13F | Goldstein Advisors, LLC | 11.078 | 7,11 | 692 | 11,45 | ||||
| 2026-02-13 | 13F | Gts Securities Llc | 17.549 | 1.096 | ||||||
| 2026-02-10 | 13F | IAG Wealth Partners, LLC | 252 | 0,00 | 16 | 0,00 | ||||
| 2026-01-28 | 13F | Migdal Insurance & Financial Holdings Ltd. | 120.788 | 34,89 | 8 | 40,00 | ||||
| 2026-02-11 | 13F | O'shaughnessy Asset Management, Llc | 387 | 0,00 | 24 | 4,35 | ||||
| 2026-02-17 | 13F | Fmr Llc | 8.541 | 11,31 | 533 | 15,87 | ||||
| 2026-02-13 | 13F | Baird Financial Group, Inc. | 6.085 | 0,00 | 380 | 4,11 | ||||
| 2026-02-10 | 13F | One Capital Management, LLC | 24.034 | -14,83 | 1.501 | -11,45 | ||||
| 2026-02-11 | 13F | Simplex Trading, Llc | 0 | -100,00 | 0 | |||||
| 2026-02-13 | 13F | Sofos Investments, Inc. | 3.178 | -1,27 | 198 | 2,59 | ||||
| 2026-01-07 | 13F | Cyndeo Wealth Partners, LLC | 3.773 | -0,58 | 236 | 3,52 | ||||
| 2026-01-23 | 13F | Assetmark, Inc | 171 | -25,97 | 11 | -23,08 | ||||
| 2026-02-09 | 13F | Hartland & Co., LLC | 9.162 | 4,00 | 572 | 8,33 | ||||
| 2026-02-13 | 13F | MAI Capital Management | 104.332 | -1,48 | 6.516 | 2,49 | ||||
| 2026-02-17 | 13F | Qube Research & Technologies Ltd | 1.617 | 16,00 | 101 | 20,48 | ||||
| 2026-02-17 | 13F | Cetera Investment Advisers | 23.671 | -6,38 | 1.478 | -2,57 | ||||
| 2026-02-03 | 13F | RFG Advisory, LLC | 4.584 | 286 | ||||||
| 2026-02-10 | 13F | Argent Trust Co | 3.269 | 204 | ||||||
| 2026-02-10 | 13F | WCG Wealth Advisors LLC | 961.706 | 292,80 | 60.059 | 308,64 | ||||
| 2026-04-02 | 13F | MJT & Associates Financial Advisory Group, Inc. | 1.974 | 0,25 | 118 | -4,10 | ||||
| 2026-01-06 | 13F | Nelson, Van Denburg & Campbell Wealth Management Group, LLC | 32.027 | 0,31 | 2.000 | 4,38 | ||||
| 2026-02-17 | 13F | Bank Of America Corp /de/ | 292.997 | 14,81 | 18.298 | 19,44 | ||||
| 2026-01-29 | 13F | UBS Group AG | 509.825 | 0,57 | 31.839 | 4,62 | ||||
| 2026-02-04 | 13F | Urban Financial Advisory Corp | 1.985 | 0,30 | 124 | 4,24 | ||||
| 2026-02-13 | 13F | Morgan Stanley | 3.618.867 | -2,99 | 225.998 | 0,93 | ||||
| 2026-02-17 | 13F | Two Sigma Securities, Llc | 5.013 | 313 | ||||||
| 2026-01-26 | 13F | Private Trust Co Na | 10.042 | 0,00 | 627 | 4,15 | ||||
| 2026-02-05 | 13F | Cambridge Investment Research Advisors, Inc. | 5.184 | -40,39 | 0 | |||||
| 2026-02-13 | 13F/A | Abound Financial, Llc | 4.496 | 0,02 | 281 | 4,09 | ||||
| 2026-01-15 | 13F | Heirloom Wealth Management | 13.271 | 59,97 | 829 | 66,27 | ||||
| 2026-02-17 | 13F | Private Advisor Group, LLC | 3.562 | 222 | ||||||
| 2026-02-13 | 13F | APCM Wealth Management for Individuals | 161.006 | -6,10 | 10.055 | -2,32 | ||||
| 2026-01-26 | 13F | AE Wealth Management LLC | 855 | 18,75 | 53 | 23,26 | ||||
| 2026-01-27 | 13F | TD Waterhouse Canada Inc. | 1.955 | 0,00 | 122 | 4,27 | ||||
| 2026-02-13 | 13F | Stifel Financial Corp | 3.238 | 202 | ||||||
| 2026-02-17 | 13F | Insight Wealth Partners, LLC | 50.193 | -1,44 | 3.135 | 2,52 | ||||
| 2026-01-28 | 13F | WPG Advisers, LLC | 18 | 0,00 | 1 | 0,00 | ||||
| 2026-01-23 | 13F | Cantor Fitzgerald Investment Adviser L.p. | 29.576 | -4,74 | 1.847 | -0,86 | ||||
| 2026-02-13 | 13F | Aptus Capital Advisors, LLC | 50 | 3 | ||||||
| 2025-10-30 | 13F | Twin Peaks Wealth Advisors, LLC | 0 | -100,00 | 0 | |||||
| 2026-02-11 | 13F | Palladiem, Llc | 9.326 | 582 | ||||||
| 2026-02-12 | 13F | Triumph Capital Management | 235 | 0,00 | 15 | 0,00 | ||||
| 2026-01-29 | 13F | Comerica Bank | 1.661 | -44,89 | 104 | -42,78 | ||||
| 2026-02-10 | 13F | Goldman Sachs Group Inc | 144.590 | 9,12 | 9.030 | 13,52 | ||||
| 2026-01-23 | 13F | Rsm Us Wealth Management Llc | 109.105 | -6,80 | 6.862 | -2,36 | ||||
| 2026-02-06 | 13F | Warner Group LLC | 20.475 | -0,68 | 1.279 | 3,31 | ||||
| 2026-02-10 | 13F | Ellevest, Inc. | 3.649 | 0,00 | 228 | 3,65 | ||||
| 2026-02-11 | 13F | Cerity Partners LLC | 16.165 | 0,00 | 1.010 | 4,02 | ||||
| 2026-02-03 | 13F | Ethic Inc. | 3.696 | 0,00 | 231 | 4,07 | ||||
| 2026-02-05 | 13F | Thrivent Financial For Lutherans | 18.185 | 21,59 | 1 | |||||
| 2026-02-12 | 13F | Bank Of Montreal /can/ | 278 | 0,00 | 17 | 6,25 | ||||
| 2026-01-07 | 13F | IMPACTfolio, LLC | 0 | -100,00 | 0 | |||||
| 2026-02-10 | 13F | Nomura Asset Management Co Ltd | 0 | -100,00 | 0 | |||||
| 2026-01-12 | 13F | GenWealth Group, Inc. | 50.368 | -2,80 | 3.189 | 2,51 | ||||
| 2026-02-12 | 13F | Brinker Capital Investments, LLC | 13.529 | -4,52 | 845 | -0,71 | ||||
| 2026-02-12 | 13F | Steward Partners Investment Advisory, Llc | 5.335 | 1,75 | 333 | 6,05 | ||||
| 2026-02-02 | 13F | Fifth Third Bancorp | 250.282 | -0,62 | 15.630 | 3,39 | ||||
| 2026-02-13 | 13F | Potomac Fund Management Inc /adv | 7.453 | -1,49 | 465 | 2,42 | ||||
| 2026-02-13 | 13F | Jupiter Wealth Management LLC | 1.737 | -52,07 | 109 | -49,77 | ||||
| 2026-02-17 | 13F | Two Sigma Investments, Lp | 0 | -100,00 | 0 | |||||
| 2026-01-29 | 13F | West Bancorporation Inc | 4.035 | 0,00 | 252 | 3,72 | ||||
| 2026-02-03 | 13F | LJI Wealth Management, LLC | 4.752 | 0,51 | 297 | 4,59 | ||||
| 2026-01-21 | 13F | Balance Wealth, LLC | 17.596 | -1,42 | 1.099 | 2,52 | ||||
| 2026-02-10 | 13F | Envestnet Asset Management Inc | 56.725 | -2,10 | 3.542 | 1,84 | ||||
| 2026-02-17 | 13F | NorthRock Partners, LLC | 26.466 | 11,62 | 1.653 | 16,09 | ||||
| 2026-01-20 | 13F | Sheets Smith Wealth Management | 47.565 | -2,46 | 2.970 | 1,47 | ||||
| 2026-01-09 | 13F | Rf&l Wealth Management, Llc | 4.697 | 0,00 | 293 | 4,27 | ||||
| 2026-01-30 | 13F | Citizens Financial Group Inc/ri | 4.569 | 0,00 | 285 | 4,01 | ||||
| 2026-02-17 | 13F | Advisor Group Holdings, Inc. | 59.921 | -13,16 | 3.742 | -7,70 | ||||
| 2026-01-07 | 13F | Fragasso Group Inc. | 9.184 | 11,21 | 574 | 14,83 | ||||
| 2026-02-18 | 13F | GWM Advisors LLC | 0 | -100,00 | 0 | |||||
| 2026-02-12 | 13F | Commonwealth Equity Services, Llc | 4.076 | 0,25 | 255 | |||||
| 2026-01-26 | 13F | Cwm, Llc | 628 | 0,00 | 0 | |||||
| 2026-02-11 | 13F | Deutsche Bank Ag\ | 2.500 | -84,38 | 156 | -83,75 | ||||
| 2026-02-13 | 13F | Wells Fargo & Company/mn | 129.232 | -0,13 | 8.070 | 3,90 | ||||
| 2026-01-29 | 13F | Nbc Securities, Inc. | 136 | 8 | ||||||
| 2026-02-13 | 13F | Retirement Capital Strategies | 38.735 | 0,51 | 2.419 | 4,58 | ||||
| 2026-02-12 | 13F | Wealthspire Advisors, LLC | 0 | -100,00 | 0 | |||||
| 2026-04-02 | 13F | Noble Wealth Management PBC | 350 | 0,00 | 21 | -4,76 | ||||
| 2026-02-09 | 13F | Harbour Investments, Inc. | 10 | 0,00 | 1 | |||||
| 2026-02-17 | 13F | Nepc Llc | 9.245 | 0,00 | 577 | 4,15 | ||||
| 2026-02-17 | 13F | Ameriprise Financial Inc | 437.773 | 1,07 | 27.341 | 5,11 | ||||
| 2026-01-16 | 13F | First Pacific Financial | 1.172 | 0,34 | 73 | 4,29 | ||||
| 2026-02-12 | 13F | Prudent Man Investment Management, Inc. | 1.068 | 91,06 | 67 | 127,59 | ||||
| 2026-02-20 | 13F | Kovitz Investment Group Partners, LLC | 0 | -100,00 | 0 | |||||
| 2026-01-12 | 13F | Abound Wealth Management | 45 | 0,00 | 3 | 0,00 | ||||
| 2026-02-17 | 13F | Captrust Financial Advisors | 4.393 | 0,21 | 274 | 4,18 | ||||
| 2026-01-23 | 13F | Farther Finance Advisors, LLC | 1.424 | 0,00 | 89 | 3,53 | ||||
| 2026-01-21 | 13F | Carolina Wealth Advisors, LLC | 941 | 0,00 | 59 | 3,57 | ||||
| 2026-02-13 | 13F | Smartleaf Asset Management LLC | 170 | 11 | ||||||
| 2026-02-12 | 13F | Hm Payson & Co | 0 | -100,00 | 0 | |||||
| 2026-02-23 | 13F | Sonoma Allocations LLC | 14.382 | -3,07 | 919 | 3,96 | ||||
| 2026-02-13 | 13F | Kestra Advisory Services, LLC | 0 | -100,00 | 0 | |||||
| 2026-02-10 | 13F/A | Northwestern Mutual Wealth Management Co | 98.259 | -3,75 | 6.136 | 0,15 | ||||
| 2026-02-17 | 13F | Tower Research Capital LLC (TRC) | 10.202 | 195,45 | 637 | 207,73 | ||||
| 2026-02-05 | 13F | Allworth Financial LP | 31.151 | -2,41 | 1.945 | 1,51 | ||||
| 2026-02-17 | 13F | Citadel Advisors Llc | 23.462 | 1.465 | ||||||
| 2025-11-13 | 13F | Jump Financial, LLC | 0 | -100,00 | 0 | -100,00 | ||||
| 2025-10-30 | 13F | WFA Asset Management Corp | 1.294 | 0,23 | 68 | 6,25 | ||||
| 2025-11-14 | 13F | Jane Street Group, Llc | 0 | -100,00 | 0 | |||||
| 2026-02-11 | 13F | LPL Financial LLC | 522.496 | -0,13 | 32.630 | 3,89 | ||||
| 2026-02-17 | 13F | Royal Bank Of Canada | 865.727 | 986,34 | 54.065 | 1.030,12 | ||||
| 2026-02-09 | 13F | Weinberger Asset Management, Inc | 6.565 | 410 | ||||||
| 2026-02-11 | 13F | Jpmorgan Chase & Co | 4.626.330 | -10,23 | 288.914 | -6,61 | ||||
| 2026-01-20 | 13F | Stratos Wealth Partners, LTD. | 40.539 | -5,91 | 2.532 | -2,13 | ||||
| 2026-02-05 | 13F | Mason & Associates Inc | 14.927 | 0,00 | 932 | 4,02 | ||||
| 2026-02-13 | 13F | Ubs Asset Management Americas Inc | 12.323 | 770 | ||||||
| 2025-11-12 | 13F | TCG Advisory Services, LLC | 0 | -100,00 | 0 | |||||
| 2026-02-14 | 13F | Rockefeller Capital Management L.P. | 4.359 | 1.532,58 | 272 | 1.600,00 | ||||
| 2026-02-12 | 13F | Investment Counsel Co Of Nevada | 34.155 | 0,40 | 2.133 | 4,46 | ||||
| 2026-01-26 | 13F | Mirae Asset Global Investments Co., Ltd. | 929.600 | -17,71 | 58.054 | -14,39 | ||||
| 2026-02-02 | 13F | Principal Financial Group Inc | 178.292 | 0,00 | 11.134 | 4,04 | ||||
| 2026-01-26 | 13F | PFG Investments, LLC | 4.495 | -0,20 | 281 | 3,70 | ||||
| 2026-02-17 | 13F | Susquehanna International Group, Llp | 42.774 | 36,94 | 2.671 | 42,45 | ||||
| 2026-02-13 | 13F | Pine Valley Investments Ltd Liability Co | 26.497 | 0,17 | 1.655 | 4,22 | ||||
| 2026-02-17 | 13F | Raymond James Financial Inc | 308.994 | -4,95 | 19.297 | -1,12 | ||||
| 2026-02-13 | 13F | Y-Intercept (Hong Kong) Ltd | 4.570 | 285 | ||||||
| 2026-01-08 | 13F | Wealth Enhancement Advisory Services, Llc | 15.786 | 0,69 | 999 | 5,60 | ||||
| 2026-02-17 | 13F | Advisory Services Network, LLC | 0 | -100,00 | 0 | |||||
| 2026-02-02 | 13F | Millstone Evans Group, LLC | 131 | 627,78 | 8 | 700,00 | ||||
| 2026-01-20 | 13F | AdvisorNet Financial, Inc | 2.385 | 0,13 | 149 | 4,23 | ||||
| 2026-02-10 | 13F | Bnp Paribas Arbitrage, Sa | 0 | -100,00 | 0 | |||||
| 2026-02-05 | 13F | GSB Wealth Management, LLC | 7.295 | 6,37 | 456 | 10,71 | ||||
| 2026-01-20 | 13F | Savvy Advisors, Inc. | 28.160 | 0,86 | 1.759 | 4,96 | ||||
| 2026-02-11 | 13F | Gateway Wealth Partners, LLC | 30.122 | -0,18 | 1.881 | 3,87 | ||||
| 2026-02-12 | 13F | Sun Life Financial Inc | 3.857.067 | 13,05 | 241 | 17,65 | ||||
| 2026-02-06 | 13F | Pnc Financial Services Group, Inc. | 187 | 0,00 | 12 | 0,00 | ||||
| 2026-02-13 | 13F | National Bank Of Canada /fi/ | 2.200 | -97,87 | 137 | -97,79 | ||||
| 2026-01-12 | 13F | Corundum Group, Inc. | 5.799 | 362 | ||||||
| 2026-01-15 | 13F | Fifth Third Wealth Advisors LLC | 5.420 | 27,53 | 338 | 32,55 | ||||
| 2026-02-11 | 13F | Prudential Plc | 25.000 | 0,00 | 1.561 | 4,07 | ||||
| 2026-02-12 | 13F | Renaissance Technologies Llc | 23.500 | 64,34 | 1.468 | 70,98 | ||||
| 2026-02-13 | 13F | Veridan Wealth LLC | 0 | -100,00 | 0 | |||||
| 2026-01-09 | 13F | Dynamic Advisor Solutions LLC | 37.989 | 2.372 |